Retraction notice for: Characteristics of liver
fi
brosis
with different etiologies using a fully quantitative
fi
brosis assessment tool [Braz J Med Biol Res
(2017) 50(6): e5234]
Q. Wu
1,2, X. Zhao
1,2and H. You
1,21Beijing Key Laboratory of Translational Medicine in Liver Cirrhosis, Liver Research Center, Beijing Friendship Hospital,
Capital Medical University, Beijing, China 2National Clinical Research Center for Digestive Diseases, Beijing, China
Retraction for:Braz J Med Biol Res | doi: 10.1590/1414-431x20175234 | PMID: 28538834
The authors would like to retract the article‘‘Characteristics of liverfibrosis with different etiologies using a fully quantitative
fibrosis assessment tool’’that was published in volume 50 no. 6 (2017) (Epub May 18, 2017) in theBrazilian Journal of Medical and Biological Researchohttp://dx.doi.org/10.1590/1414-431x201752344PMID: 28538834.
The Corresponding author Hong You states that‘‘I am the corresponding author of this article, but I have not reviewed any data or the manuscript; therefore I do not agree with the submission. Although the data is not false, it is inappropriate behavior. Therefore, after discussing with the other authors, we have decided to retract this article.’’
The email used by Hong You for this statement is different from the email used by the authors during the submission, evaluation, correspondence, and publishing processes with the Brazilian Journal. We regret the unprofessional behavior of the authors involved.
Brazilian Journal of Medical and Biological Research (2017) 50(7): e5234retraction, http://dx.doi.org/10.1590/1414-431X20175234retraction
Characteristics of liver
fi
brosis with different etiologies
using a fully quantitative
fi
brosis assessment tool
Q. Wu
1,2, X. Zhao
1,2and H. You
1,21Beijing Key Laboratory of Translational Medicine in Liver Cirrhosis, Liver Research Center, Beijing Friendship Hospital,
Capital Medical University, Beijing, China
2National Clinical Research Center for Digestive Diseases, Beijing, China
Abstract
This study aimed to test the diagnostic performance of a fully quantitativefibrosis assessment tool for liverfibrosis in patients with chronic hepatitis B (CHB), primary biliary cirrhosis (PBC) and non-alcoholic steatohepatitis (NASH). A total of 117 patients with liver fibrosis were included in this study, including 50 patients with CHB, 49 patients with PBC and 18 patients with NASH. All patients underwent liver biopsy (LB). Fibrosis stages were assessed by two experienced pathologists. Histopathological images of LB slices were processed by second harmonic generation (SHG)/two-photon excitedfluorescence (TPEF) microscopy without staining, a system called qFibrosis (quantitativefibrosis) system. Altogether 101 quantitative features of the SHG/TPEF images were acquired. The parameters of aggregated collagen in portal, septal andfibrillar areas increased significantly with stages of liverfibrosis in PBC and CHB (Po0.05), but the same was not found for parameters of distributed collagen (P40.05). There was a significant correlation between parameters of aggregated collagen in portal, septal andfibrillar areas and stages of liverfibrosis from CHB and PBC (Po0.05), but no correlation was found between the distributed collagen parameters and the stages of liverfibrosis from those patients (P40.05). There was no significant correlation between NASH parameters and stages offibrosis (P40.05). For CHB and PBC patients, the highest correlation was between septal parameters andfibrosis stages, the second highest was between portal parameters andfibrosis stages and the lowest correlation was betweenfibrillar parameters andfibrosis stages. The correlation between the septal parameters of the PBC and stages is significantly higher than the parameters of the other two areas (Po0.05). The qFibrosis candidate parameters based on CHB were also applicable for quantitative analysis of liverfibrosis in PBC patients. Different parameters should be selected for liverfibrosis assessment in different stages of PBC compared with CHB.
Key words: Liverfibrosis; Quantitative assessment; Etiology
Introduction
The severity of liverfibrosis is an important factor for long-term prognosis of liver disease. Studies show that liver fibrosis is a reversible process (1–3). Accurate and
quantitative assessment of liverfibrosis is very important in diagnosis, treatment and prognosis of liver disease.
Liver biopsy is still the gold standard for quantitative assessment of liverfibrosis. From the initial subjective and descriptive diagnosis to the current semi-quantitative score system, the pathological assessment of liverfibrosis has improved greatly. Several semi-quantitative staging sys-tems exist, including Knodell staging system, Ishak staging system, Metavir staging system, and others (4). Although semi-quantitative diagnosis is more convenient for clinical practitioners compared with the initial descriptive diagno-sis, those methods are still not very reliable and repeatable because the results depend on the staining process.
Noninvasive diagnostic methods for liverfibrosis, includ-ing fibroscan and MRI, have been widely used in the
diagnosis of severe liver fibrosis and cirrhosis in recent years, but these methods are not effective in the diagnosis of mild or moderate liverfibrosis. So currently, the noninvasive diagnostic methods can not completely substitute liver biopsy (5).
In recent years, a new concept of quantitative structure has been proposed, which is based on a new technology tool–qFibrosis analysis system (6). It relies on non-linear
second harmonic generation (SHG)/two-photon excitation fluorescence (TPEF) microscopy imaging technique. Combining organizational engineering, biophotonics and clinical liver disease theory and technology, qFibrosis can faithfully replicate traditional fibrosis score and detect subtle quantitative fibrosis changes (7–10). SHG/TPEF
can analyze and quantify collagenfibers because it is very sensitive in detecting dissymmetry in the structure of fibrillar collagen molecules in stain-free biopsy sections. This quantitative method for liver fibrosis evaluation is
Correspondence: H. You:<[email protected]>
supposedly superior than traditional semi-quantitative staging systems for it is objective, fully quantitative, less sensitive to sampling error, and can mediate inter-/intra-observer variation (6). The method has been recently validated in chronic hepatitis B (6). However, its accuracy to detect extensive fibrosis or cirrhosis in other chronic liver diseases remains to be demonstrated.
The aim of this study is to assess the diagnostic performance of qFibrosis for the evaluation offibrosis and histological stages in chronic cholestatic diseases of primary biliary cirrhosis (PBC) and non-alcoholic steato-hepatitis (NASH) by comparing with the results from chronic hepatitis B (CHB), to analyze the characteristics of different etiology liver fibrosis in different stages, and to provide theoretical basis and data for further clinical application of qFibrosis.
Material and Methods
Patients
Altogether 117 patients with liver fibrosis, including 50 patients with chronic hepatitis B (CHB), 49 patients with primary biliary cirrhosis (PBC), and 18 patients with non-alcoholic steatohepatitis (NASH) were retrospectively enrolled from October 2010 to October 2015, in Beijing Friendship Hospital, Capital Medical University. Patients diagnosed with a single known etiology and that underwent percutaneous liver biopsy (LB) were included in this study. Patients with other or mixed etiologies, and malignancy were excluded. Informed written consent was obtained from all patients and the study was approved by the Research Ethics Committee of the Beijing Friendship Hospital.
PBC was defined according to the 2009 PBC practice guidelines from the American Association for the Study of Liver Diseases (AASLD) (12), as follows: biochemical evidence of cholestasis based mainly on alkaline phos-phatase elevation; presence of antimitochondrial antibod-ies; histological evidence of nonsuppurative destructive cholangitis and destruction of interlobular bile ducts. NASH was defined according to the 2012 Practice Guideline by the American Astroenterological Association (AGA), AASLD, and American College of Gastroenterol-ogy (ACG): The Diagnosis and Management of Non-alcoholic Fatty Liver Disease Practice Guideline (13).
Liver histology
Liver biopsy specimens were routinelyfixed in formalin and paraffin embedded. Five-micron thick sections were stained with Masson trichrome for histological assessment. Biopsy specimens were analyzed independently by two experienced pathologists. Liverfibrosis of CHB and PBC were evaluated semiquantitatively according to the Metavir staging system (14): F0: nofibrosis; F1: stellate enlarge-ment of portal tracts but without septum formation; F2: enlargement of portal tracts with rare septum formation; F3: numerous septa without cirrhosis; F4: cirrhosis. NASH
fibrosis was classified into 5 stages: stage 0: nofibrosis; stage 1: mild or moderate zone 3 perisinusoidal fibrosis; stage 2: perisinusoidal fibrosis enlarged to portal stellate fibrosis; stage 3: bridgingfibrosis; stage 4: cirrhosis.
SHG/TPEF microscopy imaging and processing The embedded biopsy specimen sectioned at 5-mm
thickness were dewaxed for imaging by the SHG/TPEF microscopy system (HistoIndex, Genesis 200s, Singapore). Collagen was visualized by SHG microscopy and hepato-cyte morphology was acquired by the TPEF microscopy. We used the full scan method to acquire the images. Images were acquired at 20 magnification with 512512
pixel resolutions. Image processing and analysis (threshold and SHG scoring) were routinely performed, and 101 quantitative morphological features of the SHG/TPEF image were acquired by the computer-aided system. Three main fibrosis patterns–collagen in portal area (portal expansion),
collagen in septal area (bridging fibrosis), and collagen in fibrillar area (fine collagen distributed in the pericellular/ perisinusoidal space–or space of Disse) were evaluated in
this study. Collagen features were classified into three groups: collagen proportions including total, aggregated and distributed collagen percentages; collagen string properties such as the thickness, length, and width; and ratios of different collagen string types. See Table 1 and Supple-mentary Table S1 for details.
Statistical analysis
The qFibrosis parameters for patients with CHB, PBC and NASH were analyzed. One-way ANOVA test was also used for parameter comparison between differentfibrosis stages. In order to determine the characteristics of liver fibrosis from different etiologies, Spearman correlation analysis was used to analyze correlation between parameters and stages.
Results
Parameters of aggregated collagen in portal, septal and fibrillar areas all increased significantly with higher fibrosis stages in samples from PBC and CHB (Po0.05),
but parameters of distributed collagen did not increase significantly (P40.05). There was no significant increase
in parameters in samples from NASH (P40.05) (Figure 1). Spearman correlation analysis showed a significant correlation between parameters in portal, septal andfibrillar areas for both CHB and PBC samples (Po0.05), but no
significant correlation was found between collagen parameters and stage of liver fibrosis for both CHB and PBC samples (P40.05). There was no significant correlation between
NASH parameters andfibrosis stages (P40.05) (Figure 2). For CHB and PBC patients, the highest correlation was between the septal parameters and stages offibrosis, in the middle was the correlation between portal param-eters and stages, and the lowest correlation was between fibrillar parameters and stages, which suggest that the
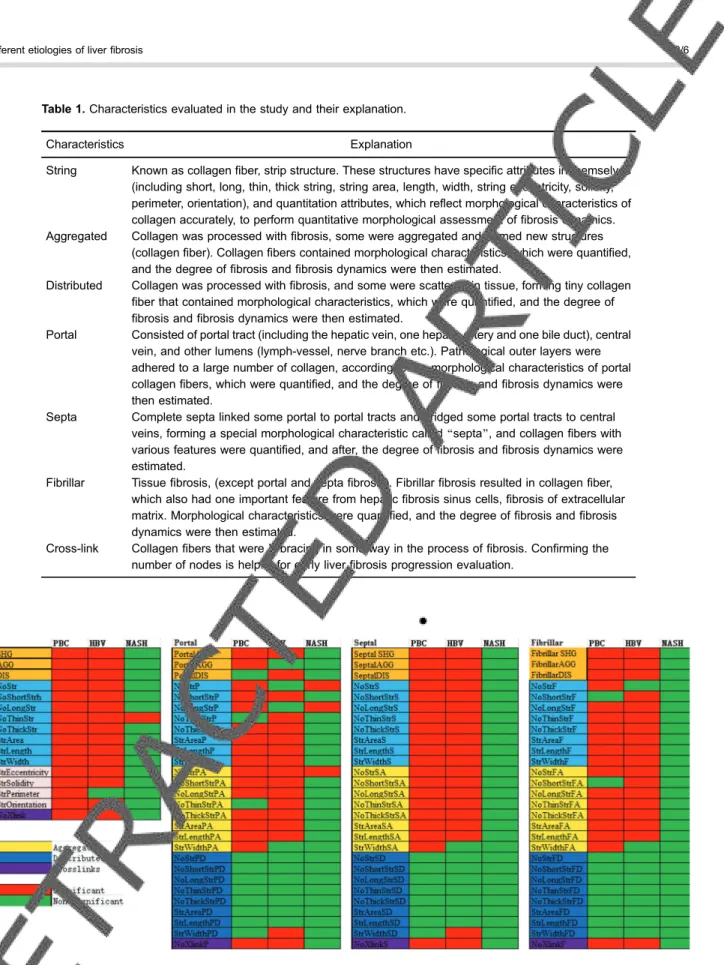
Table 1.Characteristics evaluated in the study and their explanation.
Characteristics Explanation
String Known as collagenfiber, strip structure. These structures have specific attributes in themselves (including short, long, thin, thick string, string area, length, width, string eccentricity, solidity, perimeter, orientation), and quantitation attributes, which reflect morphological characteristics of collagen accurately, to perform quantitative morphological assessment offibrosis dynamics. Aggregated Collagen was processed withfibrosis, some were aggregated and formed new structures
(collagenfiber). Collagenfibers contained morphological characteristics, which were quantified, and the degree offibrosis andfibrosis dynamics were then estimated.
Distributed Collagen was processed withfibrosis, and some were scattered in tissue, forming tiny collagen fiber that contained morphological characteristics, which were quantified, and the degree of fibrosis andfibrosis dynamics were then estimated.
Portal Consisted of portal tract (including the hepatic vein, one hepatic artery and one bile duct), central vein, and other lumens (lymph-vessel, nerve branch etc.). Pathological outer layers were adhered to a large number of collagen, according to the morphological characteristics of portal collagenfibers, which were quantified, and the degree offibrosis andfibrosis dynamics were then estimated.
Septa Complete septa linked some portal to portal tracts and bridged some portal tracts to central veins, forming a special morphological characteristic called‘‘septa’’, and collagenfibers with various features were quantified, and after, the degree offibrosis andfibrosis dynamics were estimated.
Fibrillar Tissuefibrosis, (except portal and septafibrosis). Fibrillarfibrosis resulted in collagenfiber, which also had one important feature from hepaticfibrosis sinus cells,fibrosis of extracellular matrix. Morphological characteristics were quantified, and the degree offibrosis andfibrosis dynamics were then estimated.
Cross-link Collagenfibers that were X-bracing in some way in the process offibrosis. Confirming the number of nodes is helpful for early liverfibrosis progression evaluation.
septal parameter is the most important for predicting liver fibrosis progression (Figure 3).
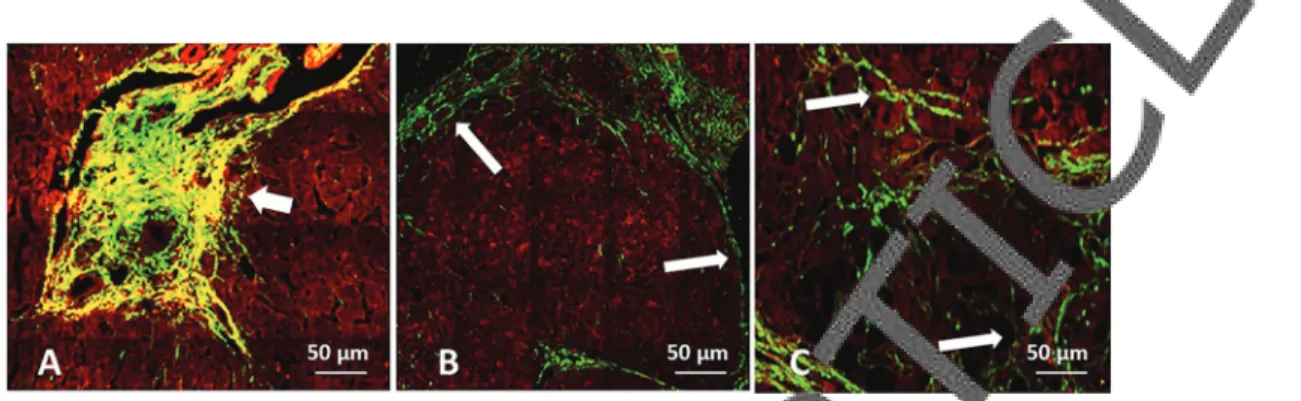
From the second harmonic generation and two-photon excited fluorescence images, the pathological patterns of fibrosis are different in different etiologies, with collagen stained in green and liver cell structure stained in red (Figure 4).
Discussion
Liver biopsy is still the gold standard in etiology differentiation and severity evaluation of liver fibrosis,
providing descriptive diagnosis. By analyzing pathological changes of liver diseases, researchers establish disease severity according to pathological characteristics, such as necrosis in portal or septal area, degeneration or foci necrosis in fibrillar area, portal veins inflammation and liverfibrosis (13). In order to differentiate mild from severe liver diseases with a semi-quantitative analysis, patho-logical changes such as liver tissue inflammation and fibrosis have been given scores. However, it is reported that the intra- and inter-observer discrepancy in the available semi-quantitative systems can be as high as 35% (15–17).
Figure 2.Spearman correlation analysis of parameters in portal, septal andfibrillar areas with stages for chronic hepatitis B (CHB), primary biliary cirrhosis (PBC) and non-alcoholic steatohepatitis (NASH). Orange, light blue and gray colors are used for differentiation of different parameters. SHG, second harmonic generation; AGG, aggregated collagen percentage; DIS, distributed collagen percentage. See Supplementary Table S1 for details.
Figure 3. Correlation of parameters and stages of liverfibrosis in samples from chronic hepatitis B (CHB) and primary biliary cirrhosis (PBC).
Effort is made to assess the progression of liver fibrosis by the proportion of collagen fibers in the liver. Morphological assay (morphometry) is frequently used in clinical studies. In this method, collagen fibers from a stained area are calculated and compared with the whole area under analysis to get the collagen proportionate area (CPA). CPA, also called collagen area ratio, is 1 to 7% in normal liver and 12 to 36% in liver cirrhosis. CPA can be further subdivided, and it is used as an independent predictor for cirrhosis (18). Despite of this, CPA is still inconsistent and subjective to some extent, and showed drastic changes only in advanced stages of fibrosis, and was unable to differentiate between early stages (6).
qFibrosis quantitative analysis of liver biopsies includes quantitative and structural information offibrosis, which can reflect changes offibrosis intensity and distri-bution. Combining the staging method with fully quantita-tivefibrosis analysis can also solve the problems of the traditional stage system – etiology differentiation and
fibrosis reversion. The fully quantitative method can con-firmfibrosis reversion from a pathological point of view.
In this study, we assessed the performance of qFibrosis for the evaluation of fibrosis and histological stages in chronic cholestatic diseases of PBC, CHB, and NASH. We found that the parameters of aggregated collagen in portal, septal andfibrillar areas all increased significantly with higher stages of liverfibrosis in PBC and CHB, but the parameters of distributed collagen did not significantly increase in the same samples. Also, there was a significant correlation between parameters in portal, septal andfibrillar areas for both CHB and PBC, but not between the collagen parameters and the stages of liver fibrosis in those diseases. There was no significant cor-relation between NASH parameters and fibrosis stages. For CHB and PBC patients, the highest correlation was between septal parameters andfibrosis stages, the
second highest was between portal parameters and fibrosis stages and the lowest correlation was between fibrillar parameters andfibrosis stages, which suggest that the septal parameter was the most important predictor for liverfibrosis progression.
Compared with parameters of distributed collagen, parameters of aggregated collagen in portal, septal and fibrillar areas seem to be more suitable for assessment of liver fibrosis progression in PBC and CHB patients. Pathologically, for PBC patients, liverfibrosis progression happens in the septal area, although it starts in the portal area. For CHB, parameters in the portal and septal areas were strongly correlated with progression of stages, which suggests that the parameters in these two areas, partic-ularly the aggregated collagen parameters, could be used in the assessment of liverfibrosis progression and reversion. The qFibrosis candidate parameters based on CHB are also applicable for quantitative analysis of liver fibrosis in PBC. In this study, the parameters for NASH were not significantly correlated withfibrosis stages, sug-gesting that the candidate parameters of qFibrosis based on CHB are not suitable for quantitative assessment of liver fibrosis in NASH. Further studies are necessary to reach a stronger conclusion, because of the small sample size of NASH cases in this study.
Supplementary Material
Click here to view [pdf]
Acknowledgments
This work was supported by the National Science and Technology Major Project (grant #2013ZX10002004), the Key Project of Beijing Science and Technology Commis-sion (D1211000039120003), and National Science and Technology Support Project (#2015BAI13B09).
References
1. Fatourou EM, Tsochatzis EA. ART and science in using transarterial chemoembolization for retreating patients with hepatocellular carcinoma.Hepatobiliary Surg Nutr2014; 3: 415–418, doi: 10.3978/j.issn.2304-3881.2014.07.01. 2. Parisi I, O’Beirne J, Tsochatzis E. Inflammation-based
scores and hepatocellular carcinoma.Liver Transpl2014; 20: 1529–1530, doi: 10.1002/lt.23969.
3. Leonard H, O’Beirne J, Yu D, Tsochatzis E. Embolization of porto-systemic shunt as treatment for recurrent hepatic encephalopathy.Ann Hepatol2014; 13: 555–557. 4. Parisi I, Tsochatzis E, Wijewantha H, Rodriguez-Peralvarez
M, De Luca L, Manousou P, et al. Inflammation-based scores do not predict post-transplant recurrence of hepato-cellular carcinoma in patients within Milan criteria. Liver Transpl2014; 20: 1327–1335, doi: 10.1002/lt.23969. 5. Tsochatzis EA, Crossan C, Longworth L, Gurusamy K,
Rodriguez-Peralvarez M, Mantzoukis K, et al. Cost-effec-tiveness of noninvasive liver fibrosis tests for treatment decisions in patients with chronic hepatitis C.Hepatology 2014; 60: 832–843, doi: 10.1002/hep.27296.
6. Xu S, Wang Y, Tai DC, Wang S, Cheng CL, Peng Q, et al. qFibrosis: a fully-quantitative innovative method incorporat-ing histological features to facilitate accuratefibrosis scoring in animal model and chronic hepatitis B patients.J Hepatol 2014; 61: 260–269, doi: 10.1016/j.jhep.2014.02.015. 7. Thayalasekaran S, Tsochatzis EA. Is MELD the best
prognostic score in acute variceal bleeding? The jury is still out.Ann Gastroenterol2014; 27: 282–83.
8. Tsochatzis EA, Bosch J, Burroughs AK. Future treatments of cirrhosis.Expert Rev Gastroenterol Hepatol2014; 8: 571– 581, doi: 10.1586/17474124.2014.902303.
9. Papastergiou V, O’Beirne J, Tsochatzis EA. Letter: Prog-nostic scores in alcoholic hepatitis - authors’reply.Aliment Pharmacol Ther2014; 39: 1341, doi: 10.1111/apt.12757. 10. Tsochatzis EA, Crossan C, Longworth L. Cost–effectiveness
of upcoming treatments for hepatitis C: we need to get the
models right.J Hepatol2014; 61: 453–454, doi: 10.1016/j. jhep.2014.04.022.
11. Ferrarese A, Tsochatzis E, Burroughs AK, Senzolo M. Beta-blockers in cirrhosis: therapeutic window or an aspirin for all?J Hepatol2014; 61: 449–450, doi: 10.1016/j.jhep.2014.03.038. 12. Lindor KD, Gershwin ME, Poupon R, Kaplan M, Bergasa NV, Heathcote EJ. Primary biliary cirrhosis. Hepatology 2009; 50: 291–308, doi: 10.1002/hep.22906.
13. Chalasani N, Younossi Z, Lavine JE, Diehl AM, Brunt EM, Cusi K, et al. The diagnosis and management of non-alcoholic fatty liver disease: practice Guideline by the American Association for the Study of Liver Diseases, American College of Gastroenterology, and the American Gastroenterological Association. Hepatology 2012; 55: 2005-23, doi: 10.1002/hep.25762.
14. Goodman ZD. Grading and staging systems for infl amma-tion andfibrosis in chronic liver diseases.J Hepatol2007; 47: 598–607, doi: 10.1016/j.jhep.2007.07.006.
15. Papastergiou V, Tsochatzis EA, Pieri G, Thalassinos E, Dhar A, Bruno S, et al. Nine scoring models for short-term mortality in alcoholic hepatitis: cross-validation in a biopsy-proven cohort.Aliment Pharmacol Ther2014; 39: 721–732, doi: 10.1111/apt.12654.
16. Tsochatzis EA, Bosch J, Burroughs AK. Liver cirrhosis. Lancet 2014; 383: 1749–1761, doi: 10.1016/S0140-6736 (14)60121-5.
17. Tsochatzis E, Bruno S, Isgro G, Hall A, Theocharidou E, Manousou P, et al. Collagen proportionate area is superior to other histological methods for sub-classifying cirrhosis and determining prognosis.J Hepatol2014; 60: 948–954, doi: 10.1016/j.jhep.2013.12.023.
18. Manousou P, Cholongitas E, Samonakis D, Tsochatzis E, Corbani A, Dhillon AP, et al. Reducedfibrosis in recurrent HCV with tacrolimus, azathioprine and steroids versus tacrolimus: randomised trial long term outcomes. Gut 2014; 63: 1005–1013, doi: 10.1136/gutjnl-2013-305606.