AMTD
4, 6229–6248, 2011Phase state measurement
E. Saukko et al.
Title Page
Abstract Introduction
Conclusions References
Tables Figures
◭ ◮
◭ ◮
Back Close
Full Screen / Esc
Printer-friendly Version Interactive Discussion
Discussion
P
a
per
|
Dis
cussion
P
a
per
|
Discussion
P
a
per
|
Discussio
n
P
a
per
Atmos. Meas. Tech. Discuss., 4, 6229–6248, 2011 www.atmos-meas-tech-discuss.net/4/6229/2011/ doi:10.5194/amtd-4-6229-2011
© Author(s) 2011. CC Attribution 3.0 License.
Atmospheric Measurement Techniques Discussions
This discussion paper is/has been under review for the journal Atmospheric Measurement Techniques (AMT). Please refer to the corresponding final paper in AMT if available.
A method to resolve the phase state
of aerosol particles
E. Saukko, H. Kuuluvainen, and A. Virtanen
Department of Physics, Tampere University of Technology, Tampere, Finland
Received: 23 June 2011 – Accepted: 30 September 2011 – Published: 6 October 2011 Correspondence to: E. Saukko ([email protected])
AMTD
4, 6229–6248, 2011Phase state measurement
E. Saukko et al.
Title Page
Abstract Introduction
Conclusions References
Tables Figures
◭ ◮
◭ ◮
Back Close
Full Screen / Esc
Printer-friendly Version Interactive Discussion
Discussion
P
a
per
|
Dis
cussion
P
a
per
|
Discussion
P
a
per
|
Discussio
n
P
a
per
|
Abstract
The phase state of atmospheric aerosols has impact on their chemical aging and their deliquescence and thus their ability to act as cloud condensation nuclei (CCN). The phase change of particles can be induced by the deliquescence or efflorescence of water or by chemical aging. Existing methods, such as tandem differential mobility
5
analysis rely on the size change of particles related to the water uptake or release related to deliquescence and efflorescence.
To address the need to study the phase change induced by mass-preserving and nearly mass-preserving processes a new method has been developed. The method relies on the physical impaction of particles on a smooth substrate and subsequent
10
counting of bounced particles by condensation particle counter (CPC). The connection between the bounce probability and physical properties of particles is so far qualitative. To evaluate the performance of this method, the phase state of ammonium sulfate and levoglucosan, crystalline and amorphous solid, in the presence of water vapor was studied. The results show a marked difference in particle bouncing properties between
15
substances – not only at the critical relative humidity level, but also on the slope of the bouncing probability with respect to humidity. This suggests that the method can be used to differentiate between amorphous and crystalline substances as well as to differentiate between liquid and solid phases.
1 Introduction 20
Particle deliquescence plays an important role in cloud condensation dynamics and is thus studied widely. Common methods to investigate particle-water interaction are the use of hygroscopicity tandem DMA, (HTDMA) (Rader and McMurry, 1986; Liu et al., 1978) or cloud condensation nucleus counter (CCN-counter) (Roberts and Nenes, 2005). These methods rely on detecting the size change of particles as they are
ac-25
AMTD
4, 6229–6248, 2011Phase state measurement
E. Saukko et al.
Title Page
Abstract Introduction
Conclusions References
Tables Figures
◭ ◮
◭ ◮
Back Close
Full Screen / Esc
Printer-friendly Version Interactive Discussion
Discussion
P
a
per
|
Dis
cussion
P
a
per
|
Discussion
P
a
per
|
Discussio
n
P
a
per
spectrum is used to determine the efflorescence and deliquescence relative humidity (ERH and DRH) (Seinfeld et al., 1998).
These methods, however can not distinguish the phase state of the particles. In case of water uptake induced phase change, the connection between the phase change from solid to liquid upon major change in particle size is evident, but for example the
5
possible oxidation induced phase change – when the size stays constant – can not be detected by these methods apart from possible changes in the kinetics of the particle growth.
The phase state is an important factor for the lifetime consideration of the particles since the chemical reactions in the particle become diffusion limited surface reactions
10
in solid particles. This may increase the lifetime of organic aerosols markedly, as the oxidation caused by atmospheric ozone, nitrous oxides and hydroxyl radicals is con-fined only to the surface. The water activation of particles can also be strongly affected by its phase. Solid crystalline particles activate faster than amorphous solid particles as the diffusion of water to the bulk is much slower for the latter (Zahardis and Petrucci,
15
2007; Zobrist et al., 2008).
According to the recently published research, the physical phase of the particles can be studied by investigating particle bounce properties (Virtanen et al., 2010). When an aerosol particle collides with an impaction surface, one part of its kinetic energy is dissipated in the deformation process, and another part is converted elastically into the
20
kinetic energy of rebound (Dahneke, 1971). If the rebound energy exceeds the adhe-sion energy, the particle will bounce from the surface. Thus both the elastic properties and surface properties of particles affect their bounce probability (Rogers and Reed, 1984).
In the method utilized by Virtanen et al. (2010) the bounce is determined by using
25
AMTD
4, 6229–6248, 2011Phase state measurement
E. Saukko et al.
Title Page
Abstract Introduction
Conclusions References
Tables Figures
◭ ◮
◭ ◮
Back Close
Full Screen / Esc
Printer-friendly Version Interactive Discussion
Discussion
P
a
per
|
Dis
cussion
P
a
per
|
Discussion
P
a
per
|
Discussio
n
P
a
per
|
and coatings. When particle bounce occurs in an ELPI, a significant excess current is measured in the lowest impactor stages and the back-up filter resulting from the charges carried by the bounced particles. Virtanen et al. (2010) defined theBounce factor by calculating the fraction of excess current measured in the lowest impactor stages. The method is a fast way to detect the bounce, but the Bounce factor, defined
5
from ELPI measurement, depends not only on the bounce properties of the particles, but also on the charge transfer properties of the particles and the substrate. Thus quantitative information on bounce characteristics of particles is not possible to get by utilizing electrical detection.
Here we present a bounce measurement method based on single stage impactor
10
with optical, instead of electrical, detection. The fraction of bounced particles is defined by a direct measurement of particle concentration in the inlet and outlet of the impactor. We test the method with crystalline and amorphous laboratory aerosols and present the bounce results related to the humidity induced phase transitions of crystalline and amorphous solid materials.
15
2 Experimental methods and materials
The measurement setup is described schematically in Fig. 1. The aerosol was gener-ated from de-ionized water (DI-water, Milli-Q) solutions of 1 to 2 g l−1using a Collison
atomizer. After generation, 1.5 lpm of the aerosol was conducted through Topas silica gel diffusion dryer, or in the case of ammonium sulfate, diluted, to reach the effl
ores-20
cence relative humidity of the nebulized material and the rest vented. The aerosol was then charged and classified with a Vienna type DMA. The classified aerosol was di-luted and conducted through a Permapure nafion tube which humidified the aerosol to a controlled RH.
After the humidifier there was a residence time of 3 s after which the flow was
sepa-25
AMTD
4, 6229–6248, 2011Phase state measurement
E. Saukko et al.
Title Page
Abstract Introduction
Conclusions References
Tables Figures
◭ ◮
◭ ◮
Back Close
Full Screen / Esc
Printer-friendly Version Interactive Discussion
Discussion
P
a
per
|
Dis
cussion
P
a
per
|
Discussion
P
a
per
|
Discussio
n
P
a
per
TSI 3786) to measure the number concentration entering into the impactor. The flow to the impactor was constricted using a pinhole orifice and a needle valve to achieve desired upper pressure for the impactor. The flow leaving the impactor is guided to a vacuum pump through a sampling cell of a volume of 0.4 l and a needle valve. This is referred to as the sampling mode, and denoted in dark in the valves in Fig. 1.
5
The sampling is continued until the impactor pressures have stabilized and the sam-pling cell has been flushed several times. Next the valves are turned such that the cell is repressurized with particle free air and the CPC is measuring the decreasing concentration of particles in the cell. This is the measurement mode, and is denoted in white in the valves in Fig. 1. The measurement is continued until sufficient number of
10
particles are measured, after which the system is returned to the sampling mode. The bounced fraction can be computed from the UWCPC data record by comparing the concentration from upstream of the impactor and the sample from the repressurised sample cell. To take in to account the decrease in concentration caused by dilution and the different losses at separate routes and residence times for the reference sample
15
and the bounced sample, a baseline sample calibration was done with the collection plate removed. The bounced fraction of the particles can be thus calculated as the relation of the passed particles to the entering particles, divided by the same relation for the baseline sample.
The collection plate for the impactor was polished steel plate, thoroughly cleaned
20
and finally rinsed with de-ionized water. The operational conditions for the ELPI-type impactor used in the study are presented in Table 1.
The chosen mobility sizes of the levoglucosan and ammonium sulphate particles were 105 and 115 nm, respectively. When taking into account the densities of the substances (1.618 g cm−3, Rosenørn et al., 2006 and 1.77 g cm−3, Lide, 2008,
respec-25
tively) and assuming spherical particles, the aerodynamic size for levoglucosan parti-cles is 155 nm and for ammonium sulfate partiparti-cles 181 nm.
AMTD
4, 6229–6248, 2011Phase state measurement
E. Saukko et al.
Title Page
Abstract Introduction
Conclusions References
Tables Figures
◭ ◮
◭ ◮
Back Close
Full Screen / Esc
Printer-friendly Version Interactive Discussion
Discussion
P
a
per
|
Dis
cussion
P
a
per
|
Discussion
P
a
per
|
Discussio
n
P
a
per
|
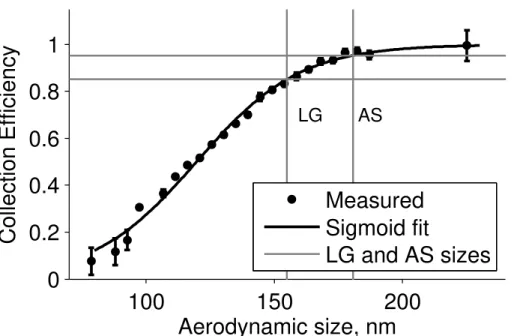
Keskinen et al. (1999). The collection efficiency curve for the impactor used is shown in Fig. 2.
When efflorescence relative humidity measurements were done, an extra nafion tube humidifier was set to 80 % and after a minimum of 3 s residence time, the second nafion tube was used to dry the sample and further 3 s residence time was allowed before
5
measurement step.
2.1 Data analysis
When operating with particle sizes where the calibrated collection efficiency shown in Fig. 2 is below unity, a further correction is needed to get the bounced fraction of the particles separated from the particles which do not impact to the substrate. This
10
corrected bounced fraction is calculated as:
B = B
′
− (1 − CE (da))
CE (da)
(1)
whereB′is the measured, uncorrected bounced fraction andC
E (da) is the calibrated
collection efficiency at the aerodynamic particle size da that was used. The use of
correction allows for the use of smaller particle sizes where the collection efficiency
15
has not reached unity. The downside is the reduced dynamics; using correction means scaling up the real data, but at the same time scaling up the noise. Thus it is not advisable to operate the impactor at the lower portion of the collection efficiency curve. The use of the steepest portion of the curve may also induce larger errors due to the errors in the calculated aerodynamic diameter discussed below; error in the diameter,
20
AMTD
4, 6229–6248, 2011Phase state measurement
E. Saukko et al.
Title Page
Abstract Introduction
Conclusions References
Tables Figures
◭ ◮
◭ ◮
Back Close
Full Screen / Esc
Printer-friendly Version Interactive Discussion
Discussion
P
a
per
|
Dis
cussion
P
a
per
|
Discussion
P
a
per
|
Discussio
n
P
a
per
The aerodynamic particle size can be calculated with (Kelly and McMurry, 1992):
da = dp
CC dp
CC (da)
!1/2 ρ
e
ρ0 1/2
, (2)
wheredpis the mobility diameter,CCis the Cunningham slip correction factor, and ρe
and ρ0 are the effective densities of the particle matter and water, respectively. The
aerodynamic particle sizes for dry particles are 155 nm and 181 nm for levoglucosan
5
and ammonium sulfate.
The growth factors for the aerosols were not measured, but based on Mikhailov et al. (2009), the growth factor at the maximum attainable humidity conditions system, 60 % RH (see Figs. 4 and 5) for levoglucosan is 1.2 and about 1.3 for deliquesced ammonium sulfate. While this is a notable increase in the mobility diameter, the
aero-10
dynamic diameter, for which the collection efficiency is calibrated, does not change very much. When the particles are hydrated, the new diameter isdp·GF and the effective
density, assuming a volume additivity of the mixture:
ρp =
ρp + ρ0
GF3 − 1
GF3 . (3)
When the deliquesced density and mobility diameter is substituted to Eq. (2), the
deli-15
quesced aerodynamic diameters are 162 nm and 188 nm, respectively. This results in a maximum error of 3.2 % of the collection efficiency. Further error analysis gives the maximum error on corrected bounce to be:
∆B = 1 − B
′
CE
∆CE. (4)
At the maximum condition i.e. lowest used collection efficiency and lowest bounce
frac-20
AMTD
4, 6229–6248, 2011Phase state measurement
E. Saukko et al.
Title Page
Abstract Introduction
Conclusions References
Tables Figures
◭ ◮
◭ ◮
Back Close
Full Screen / Esc
Printer-friendly Version Interactive Discussion
Discussion
P
a
per
|
Dis
cussion
P
a
per
|
Discussion
P
a
per
|
Discussio
n
P
a
per
|
2.2 Hydration and dehydration induced phase transitions
The humidity induced phase transitions of crystalline and amorphous solids are ex-plained thoroughly by Mikhailov et al. (2009) and experimental data for ammonium sulfate and levoglucosan are presented. Briefly, crystalline substances exhibit hys-teresis upon the phase change very clearly in step-function manner and amorphous
5
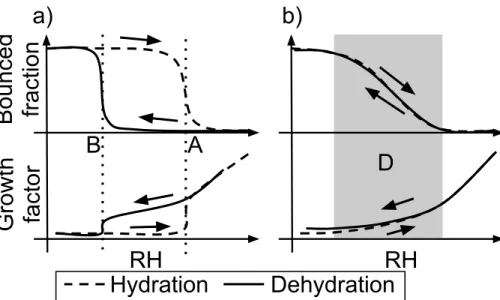
solids have a wide, continuous regime of hydration induced water uptake. Figure 3 shows schematic representations of the effect of phase change to growth factor and to bounce probability. When relating the measured bounce data with the sample humid-ity, the pressure reduction in the impactor must be taken into account. As the pressure decreases, the concentration of water molecules reduces in the pressure ratio. We
10
denote this RH inside the impactorImpactor RH, RHI.
RHI = RHH
pu
pamb
(5)
where RHHis the relative humidity in the humidifier andpuandpambare the impactor
upper pressure and the ambient pressure, respectively. The impactor upper pressure for the present study is 68.56 kPa. This limits the operational RH range in the impactor
15
to less than 65 % RHI.
The particles have sufficient time (0.9 s) to equilibrate to the Impactor RH. This means that in practice, we are drying the particles in the impactor. In the results sec-tion figures, also the relative humidity before the impactor,Humidifier RH, is shown on a separate axis.
20
The particle experiences a short time in the lower-pressure acceleration region be-fore there is a section of stagnation pressure bebe-fore the impaction. The timescale of the acceleration and the impaction are in the order of microseconds. Based on this we assume that the conditions above the stage define the state of the particles at the mo-ment of impaction. This assumption is verified by the results from ammonium sulfate
25
AMTD
4, 6229–6248, 2011Phase state measurement
E. Saukko et al.
Title Page
Abstract Introduction
Conclusions References
Tables Figures
◭ ◮
◭ ◮
Back Close
Full Screen / Esc
Printer-friendly Version Interactive Discussion
Discussion
P
a
per
|
Dis
cussion
P
a
per
|
Discussion
P
a
per
|
Discussio
n
P
a
per
When the sample RH in the inlet of the impactor is higher than the deliquescence RH of the substance (point A in Fig. 3a) particle remain liquid in the impactor conditions if the Impactor RH is higher than the ERH of the material (point B in the Fig. 3a). In that case, the DRH point can be determined by bounce measurement. If the Impactor RH is lower than the ERH, particles are solid at the moment of the impaction and no clear
5
changes in the bounce of the particles even if the sample RH is increased to values corresponding DRH. To avoid the latter case, the operation point should be chosen for high enough pressure.
When the efflorescence behavior of the particle is investigated, the sample is first humidified (RH values larger than DRH). After the humidification, the sample is dried
10
by drier and then lead to the impactor. In the impactor sample is further dried due to the pressure drop. The sample humidity is altered by altering the dryer conditions until the Impactor RH achieves ERH values and bounce increases again (point B in Fig. 3a). For the amorphous sample the deliquescence is continuous in a wide range and there is no sharp hysteresis and thus no sharp phase transition on either the growth
15
factor (Mikhailov et al., 2009) or the bounce probability. This is represented by area D in Fig. 3b.
3 Results
The method is demonstrated with ammonium sulfate as the crystalline test substance and levoglucosan as the amorphous test substance. Both of these substances are
20
easy to obtain and their phase state when in aerosol form with respect to relative humidity is well documented (Mikhailov et al., 2009).
3.1 Crystalline solid
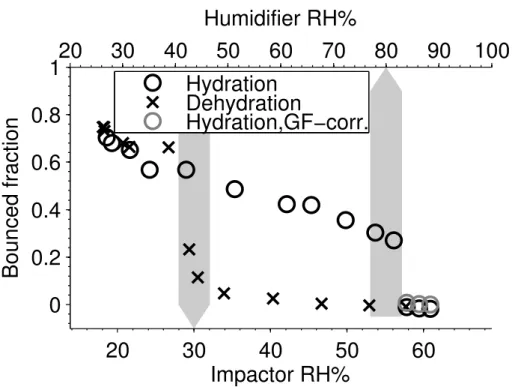
The change of phase can be clearly seen in the bounce diagram of 115 nm (mobility size), ammonium sulfate (Fig. 4), where the fraction of the bounced particles reduce
AMTD
4, 6229–6248, 2011Phase state measurement
E. Saukko et al.
Title Page
Abstract Introduction
Conclusions References
Tables Figures
◭ ◮
◭ ◮
Back Close
Full Screen / Esc
Printer-friendly Version Interactive Discussion
Discussion
P
a
per
|
Dis
cussion
P
a
per
|
Discussion
P
a
per
|
Discussio
n
P
a
per
|
almost with a step-like manner at the deliquescence relative humidity of around 81 % (Humidifier RH) when going up in the humidity. Although the actual humidity the parti-cle is exposed is lower than ERH, the hysteresis of the deliquescence ensures wetted phase state once the particles have reached the DRH. The DRH for AS particles de-fined by Mikhailov et al. (2009) is marked by the gray arrow in Fig. 4.
5
As can be seen in Fig. 4. the bounce of AS particles decreases from value of ap-proximately 0.75 to 0.3 already at the sample RH values lower than DRH. We relate this behavior to adsorption of water molecules on AS particles (Romakkaniemi et al., 2001; Biskos et al., 2006; Mikhailov et al., 2009) as well as possibly on the surface of the collection substrate.
10
When measuring the efflorescence point, deliquesced particles are dried from their DRH, until at around 30 % Impactor RH the particles start to bounce again. The DRH value measured by the bounce method is comparable to DRH values measured for AS particles by the HTDMA method (Mikhailov et al., 2009; Onasch et al., 1999; Brooks et al., 2002). The results are well in line with the assumption that the humidity inside
15
the impactor is reduced by the ratio of the pressure above the impactor stage to the ambient pressure.
The particle bounce does not go up all the way to unity, but at about 20 % Impactor RH, stays at 0.8. This indicates either that when the impactor plate is in place, the changes in flow pattern induce more losses to the walls and the roof of the impactor
20
stage, compared to the baseline setup, or that some of the particles still stick to the impactor plate on impact. With the Humidifier RH above deliquescence, the bounced fraction, when corrected for collection efficiency, is at, or slightly below zero. When the estimated effect of water absorption on aerodynamic size is included, the corrected bounce fraction rises slightly to, or above the zero level (gray circles in Fig. 4).
25
3.2 Amorphous solid
AMTD
4, 6229–6248, 2011Phase state measurement
E. Saukko et al.
Title Page
Abstract Introduction
Conclusions References
Tables Figures
◭ ◮
◭ ◮
Back Close
Full Screen / Esc
Printer-friendly Version Interactive Discussion
Discussion
P
a
per
|
Dis
cussion
P
a
per
|
Discussion
P
a
per
|
Discussio
n
P
a
per
RH. According to Zobrist et al. (2008), the glass transition temperature of levoglu-cosan is 283.6 K. According to the definition, the viscosity of material defined as glass is 1012Pas (Debenedetti and Stillinger, 2001). Thus at dry conditions at room tem-perature, the levoglucosan particles are ultra-viscous, solid-like or rubbery particles rather than glass (Sperling, 2006; Franks, 1993). This, however does not inhibit the
5
bounce, as solid-like or rubbery substance still restitute enough impaction energy for the bounce.
The bounce continues to decrease as the relative humidity increases and achieves minimum value around Impactor RH 60 %. Mikhailov et al. (2009) report that at the relative humidity of 60 % the particles are fully deliquesced, while partially deliquesced
10
starting from 30 % RH, which corresponds well with our observation.
In general, the levoglucosan particle bounce curves behave as expected for an amor-phous solids; the water uptake softens the particles and reduces the bounce steadily as the humidity is increased. This gradual softening is caused by the ability of wa-ter to function as a plasticizer for the levoglucosan particles (Sperling, 2006; Franks,
15
1993). This difference between the bounce behavior of ammonium sulfate and levoglu-cosan suggests that the distinction between crystalline and amorphous particles can be achieved with a rather simple measurement.
4 Conclusions
We presented a new method for studying the phase state of aerosol particles in
atmo-20
spherically relevant particle size range. The reported method decouples any change in the charge transfer properties of the particles from the measurement signal, so the effect of particle phase changes on bounce alone can be investigated.
Two chosen test substances show expected behavior; ammonium sulfate has sharp phase changes and hysteresis at relative humidities reported previously. Likewise,
25
AMTD
4, 6229–6248, 2011Phase state measurement
E. Saukko et al.
Title Page
Abstract Introduction
Conclusions References
Tables Figures
◭ ◮
◭ ◮
Back Close
Full Screen / Esc
Printer-friendly Version Interactive Discussion
Discussion
P
a
per
|
Dis
cussion
P
a
per
|
Discussion
P
a
per
|
Discussio
n
P
a
per
|
changes caused by changes not visible on the particle size, for example by atmospheric chemical aging of the particles.
The current shortcomings of the method are drop in vapor pressure associated with the pressure drop when introducing the sample to the impactor, and the lack of a quantitative connection of the bounce probability and the physical properties of the
5
particles, such as elastic properties or viscosity. These issues are being investigated and are topics for future studies.
The sensitivity of the method to the surface of the impacting particles is also of in-terest (see Fig. 4). The decrease of bounced fraction with ammonium sulfate suggests that the method can be used to test partial water uptake observed also on some other
10
crystalline solids such as sodium chloride (Wise et al., 2008). The knowledge of the degree of deliquescence corresponding to the drop in bounce probability could allow for particle coating specific measurements and more thorough studies of impaction dynamics.
Another suitable use for the method is the differentiation between amorphous and
15
crystalline forms of different materials. This measurement could be done not only with deliquescence with water but with for example temperature induced phase change, where similar behavior is present.
Acknowledgements. This work has been supported by Maj and Tor Nessling Foundation.
References 20
Biskos, G., Paulsen, D., Russell, L. M., Buseck, P. R., and Martin, S. T.: Prompt deliques-cence and efflorescence of aerosol nanoparticles, Atmos. Chem. Phys., 6, 4633–4642, doi:10.5194/acp-6-4633-2006, 2006. 6238
Brooks, S., Wise, M., Cushing, M., and Tolbert, M.: Deliquescence behavior of or-ganic/ammonium sulfate aerosol, Geophys. Res. Lett., 29, 23-1–23-4, 2002. 6238
25
AMTD
4, 6229–6248, 2011Phase state measurement
E. Saukko et al.
Title Page
Abstract Introduction
Conclusions References
Tables Figures
◭ ◮
◭ ◮
Back Close
Full Screen / Esc
Printer-friendly Version Interactive Discussion
Discussion
P
a
per
|
Dis
cussion
P
a
per
|
Discussion
P
a
per
|
Discussio
n
P
a
per
Debenedetti, P. and Stillinger, F.: Supercooled liquids and the glass transition, Nature, 410, 259–267, 2001. 6239
Franks, F.: Solid aqueous solutions, Pure Appl. Chem., 65, 2527–2538, 1993. 6239
Kelly, W. and McMurry, P.: Measurement of Particle Density by Inertial Classification of Diff eren-tial Mobility Analyzer – Generated Monodisperse Aerosols, Aerosol Sci. Tech., 17, 199–212,
5
1992. 6235
Keskinen, J., Marjam ¨aki, M., Virtanen, A., M ¨akel ¨a, T., and Hillamo, R.: Electrical calibra-tion method for cascade impactors, J. Aerosol Sci., 30, 111–116, doi:10.1016/S0021-8502(98)00026-3, 1999. 6234
Lide, D.: CRC handbook of chemistry and physics, CRC Press, 2008. 6233
10
Liu, B., Pui, D., Whitby, K., Kittelson, D., Kousaka, Y., and McKenzie, R.: The aerosol mobility chromatograph: a new detector for sulfuric acid aerosols, Atmos. Environ., 12, 99–104, 1978. 6230
Mikhailov, E., Vlasenko, S., Martin, S. T., Koop, T., and P ¨oschl, U.: Amorphous and crystalline aerosol particles interacting with water vapor: conceptual framework and experimental
ev-15
idence for restructuring, phase transitions and kinetic limitations, Atmos. Chem. Phys., 9, 9491–9522, doi:10.5194/acp-9-9491-2009, 2009. 6235, 6236, 6237, 6238, 6239, 6246, 6247, 6248
Onasch, T., Siefert, R., Brooks, S., Prenni, A., Murray, B., Wilson, M., and Tolbert, M.: Infrared spectroscopic study of the deliquescence and efflorescence of ammonium sulfate aerosol as
20
a function of temperature, J. Geophys. Res., 104, 21317–21326, 1999. 6238
Rader, D. and McMurry, P.: Application of the tandem differential mobility analyzer to studies of droplet growth or evaporation, J. Aerosol Sci., 17, 771–787, 1986. 6230
Roberts, G. and Nenes, A.: A continuous-flow streamwise thermal-gradient CCN chamber for atmospheric measurements, Aerosol Sci. Tech., 39, 206–221, 2005. 6230
25
Rogers, L. and Reed, J.: The adhesion of particles undergoing an elastic-plastic impact with a surface, J. Phys. D, 17, 677, 1984. 6231
Romakkaniemi, S., H ¨ameri, K., V ¨akev ¨a, M., and Laaksonen, A.: Adsorption of Water on 8– 15 nm NaCl and (NH4)2SO4Aerosols Measured Using an Ultrafine Tandem Differential Mo-bility Analyzer, J. Phys. Chem. A, 105, 8183–8188, doi:10.1021/jp010647l, 2001. 6238
30
AMTD
4, 6229–6248, 2011Phase state measurement
E. Saukko et al.
Title Page
Abstract Introduction
Conclusions References
Tables Figures
◭ ◮
◭ ◮
Back Close
Full Screen / Esc
Printer-friendly Version Interactive Discussion
Discussion
P
a
per
|
Dis
cussion
P
a
per
|
Discussion
P
a
per
|
Discussio
n
P
a
per
|
Seinfeld, J., Pandis, S., and Firm, K.: Atmospheric chemistry and physics: from air pollution to climate change, Wiley, New York, 1998. 6231
Sperling, L.: Introduction to physical polymer science, Wiley Online Library, 2006. 6239 Virtanen, A., Joutsensaari, J., Koop, T., Kannosto, J., Yli-Piril ¨a, P., Leskinen, J., M ¨akel ¨a, J.,
Holopainen, J., P ¨oschl, U., Kulmala, M., Worsnop, D. R., and Laaksonen, A.: An amorphous
5
solid state of biogenic secondary organic aerosol particles, Nature, 467, 824–827, 2010. 6231, 6232
Wise, M., Martin, S., Russell, L., and Buseck, P.: Water uptake by NaCl particles prior to deliquescence and the phase rule, Aerosol Sci. Tech., 42, 281–294, 2008. 6240
Zahardis, J. and Petrucci, G. A.: The oleic acid-ozone heterogeneous reaction system:
prod-10
ucts, kinetics, secondary chemistry, and atmospheric implications of a model system - a review, Atmos. Chem. Phys., 7, 1237–1274, doi:10.5194/acp-7-1237-2007, 2007. 6231 Zobrist, B., Marcolli, C., Pedernera, D. A., and Koop, T.: Do atmospheric aerosols form
glasses?, Atmos. Chem. Phys., 8, 5221–5244, doi:10.5194/acp-8-5221-2008, 2008. 6231, 6239
AMTD
4, 6229–6248, 2011Phase state measurement
E. Saukko et al.
Title Page
Abstract Introduction
Conclusions References
Tables Figures
◭ ◮
◭ ◮
Back Close
Full Screen / Esc
Printer-friendly Version Interactive Discussion
Discussion
P
a
per
|
Dis
cussion
P
a
per
|
Discussion
P
a
per
|
Discussio
n
P
a
per
Table 1. The operational parameters for the impactor,puandpl are the pressures above and below the jet stage, respectively andd50is the 50% collection efficiency cutpoint of the impactor as calibrated.
NTP Air flow d50 Jet diameter Jet number pu pl
AMTD
4, 6229–6248, 2011Phase state measurement
E. Saukko et al.
Title Page
Abstract Introduction
Conclusions References
Tables Figures
◭ ◮
◭ ◮
Back Close
Full Screen / Esc
Printer-friendly Version Interactive Discussion
Discussion
P
a
per
|
Dis
cussion
P
a
per
|
Discussion
P
a
per
|
Discussio
n
P
a
per
|
CPC
Neutralizer
Humidity
control
unit
DMA
Impactor
Sample
cell
Filter
Vacuum
pump
Sample
AMTD
4, 6229–6248, 2011Phase state measurement
E. Saukko et al.
Title Page
Abstract Introduction
Conclusions References
Tables Figures
◭ ◮
◭ ◮
Back Close
Full Screen / Esc
Printer-friendly Version Interactive Discussion
Discussion
P
a
per
|
Dis
cussion
P
a
per
|
Discussion
P
a
per
|
Discussio
n
P
a
per
100
150
200
0
0.2
0.4
0.6
0.8
1
Aerodynamic size, nm
Collection Efficiency
AS
LG
Measured
Sigmoid fit
LG and AS sizes
AMTD
4, 6229–6248, 2011Phase state measurement
E. Saukko et al.
Title Page
Abstract Introduction
Conclusions References
Tables Figures
◭ ◮
◭ ◮
Back Close
Full Screen / Esc
Printer-friendly Version Interactive Discussion
Discussion
P
a
per
|
Dis
cussion
P
a
per
|
Discussion
P
a
per
|
Discussio
n
P
a
per
|
A
B
a)
D
b)
RH
RH
B
ounced fract
ion
G
rowt
h
fact
or
Hydration
Dehydration
Fig. 3. A schematic figure of the relation of the fraction of the bounced particles and growth factor during hydration and dehydration of,(a)a crystalline solid sample and(b)an amorphous solid sample. Growth factor curve schematics adapted from Mikhailov et al. (2009).
AMTD
4, 6229–6248, 2011Phase state measurement
E. Saukko et al.
Title Page
Abstract Introduction
Conclusions References
Tables Figures
◭ ◮
◭ ◮
Back Close
Full Screen / Esc
Printer-friendly Version Interactive Discussion
Discussion
P
a
per
|
Dis
cussion
P
a
per
|
Discussion
P
a
per
|
Discussio
n
P
a
per
Humidifier RH%
Bounced fraction
20
30
40
50
60
70
80
90
100
0
0.2
0.4
0.6
0.8
1
Hydration
Dehydration
Hydration,GF−corr.
20
30
40
50
60
Impactor RH%
AMTD
4, 6229–6248, 2011Phase state measurement
E. Saukko et al.
Title Page
Abstract Introduction
Conclusions References
Tables Figures
◭ ◮
◭ ◮
Back Close
Full Screen / Esc
Printer-friendly Version Interactive Discussion
Discussion
P
a
per
|
Dis
cussion
P
a
per
|
Discussion
P
a
per
|
Discussio
n
P
a
per
|