www.atmos-meas-tech.net/5/259/2012/ doi:10.5194/amt-5-259-2012
© Author(s) 2012. CC Attribution 3.0 License.
Atmospheric
Measurement
Techniques
A method to resolve the phase state of aerosol particles
E. Saukko1, H. Kuuluvainen1, and A. Virtanen1,*
1Department of Physics, Tampere University of Technology, Tampere, Finland
*now at: Department of Applied Physics, University of Eastern Finland, Kuopio, Finland Correspondence to:E. Saukko ([email protected])
Received: 23 June 2011 – Published in Atmos. Meas. Tech. Discuss.: 6 October 2011 Revised: 20 December 2011 – Accepted: 18 January 2012 – Published: 30 January 2012
Abstract. The phase state of atmospheric aerosols has an impact on their chemical aging and their deliquescence and thus their ability to act as cloud condensation nuclei (CCN). The phase change of particles can be induced by the deli-quescence or efflorescence of water or by chemical aging. Existing methods, such as tandem differential mobility anal-ysis rely on the size change of particles related to the water uptake or release.
To address the need to study the phase change induced by mass-preserving and nearly mass-preserving processes a new method has been developed. The method relies on the phys-ical impaction of particles on a smooth substrate and subse-quent counting of bounced particles by a condensation parti-cle counter (CPC). The connection between the bounce prob-ability and physical properties of particles is so far qualita-tive.
To evaluate the performance of this method, the phase state of ammonium sulfate and levoglucosan, crystalline and amorphous solid, in the presence of water vapor was studied. The results show a marked difference in particle bouncing properties between substances – not only at the critical rel-ative humidity level, but also on the slope of the bouncing probability with respect to humidity. This suggests that the method can be used to differentiate between amorphous and crystalline substances as well as to differentiate between liq-uid and solid phases.
1 Introduction
Particle deliquescence plays an important role in cloud con-densation dynamics and is thus studied widely. Common methods to investigate particle-water interaction are the use of hygroscopicity tandem DMA, (HTDMA) (Rader and
Mc-Murry, 1986; Liu et al., 1978) and cloud condensation nu-cleus counter (CCN-counter) (Hudson, 1993; Roberts and Nenes, 2005). These methods rely on detecting the size change of particles as they are deliquesced in HDTMA ac-cording to the Köhler theory, or activated to larger droplets in CCN-counter. The notable size change steps in the HT-DMA spectrum is used to determine the efflorescence and deliquescence relative humidity (ERH and DRH) (Seinfeld et al., 1998). These methods, nevertheless, can not distin-guish the phase state of the particles.
The electrodynamic balance technique is also used to study particle-water interaction (Marcolli and Krieger, 2006; Pope et al., 2010) and this gives ample information about the particle size and water uptake kinetics, and also of its phase. The method is, however, constrained to large particles, typi-cally 2–50 µm.
In case of water uptake induced phase change, the connec-tion between the phase change from solid to liquid upon ma-jor change in particle size is evident, but for example the pos-sible oxidation induced phase change – when the size stays constant – can not be detected by these methods apart from possible changes in the kinetics of the particle growth.
According to the recently published research, the physical phase of the particles can be studied by investigating particle bounce properties (Virtanen et al., 2010). When an aerosol particle collides with an impaction surface, one part of its kinetic energy is dissipated in the deformation process, and another part is converted elastically into the kinetic energy of rebound (Dahneke, 1971). If the rebound energy exceeds the adhesion energy, the particle will bounce from the sur-face. Thus both the elastic properties and surface properties of particles affect their bounce probability (Rogers and Reed, 1984).
In the method utilized by Virtanen et al. (2010) the bounce is determined by using electrical low pressure impactor (ELPI). In a cascade impactor, the aerosol particle bounce perturbs the measurement as larger particles are transferred to lower stages upon bounce, thus tilting the inferred size distribution to smaller particles. This phenomenon is usu-ally considered unwanted and is suppressed by different sub-strates and coatings. When particle bounce occurs in an ELPI, a significant excess current is measured in the low-est impactor stages and the back-up filter resulting from the charges carried by the bounced particles. Virtanen et al. (2010) defined theBounce factorby calculating the fraction of excess current measured in the lowest impactor stages. The method is a fast way to detect the bounce, but the Bounce factor, defined from ELPI measurement, depends not only on the bounce properties of the particles, but also on the charge transfer properties of the particles and the substrate. Thus quantitative information on bounce characteristics of parti-cles is not currently possible to get by utilizing the electrical detection method
Here we present a bounce measurement method based on single stage impactor with optical, instead of electrical, de-tection. The fraction of bounced particles is defined by a direct measurement of particle concentration in the inlet and outlet of the impactor. We test the method with crystalline and amorphous laboratory aerosols and present the bounce results related to the humidity induced phase transitions of crystalline and amorphous solid materials.
2 Experimental methods and materials
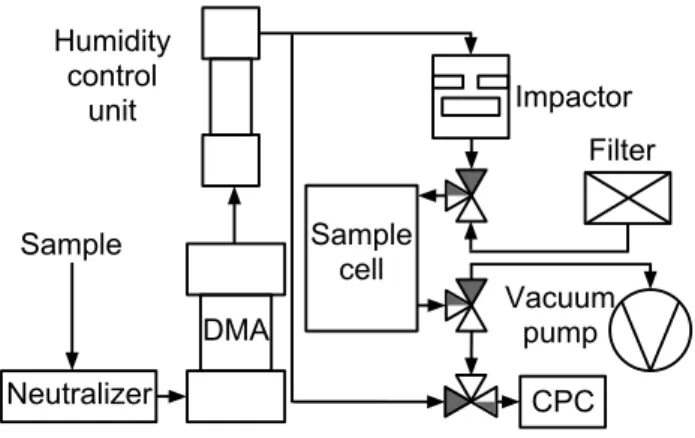
The measurement setup is described schematically in Fig. 1. The aerosol was generated from de-ionized water (DI-water, Milli-Q) solutions of 1 to 2 g l−1 using a Collison atom-izer. After generation, 1.5 lpm of the aerosol was con-ducted through Topas silica gel diffusion dryer, or in the case of ammonium sulfate, diluted, to reach the efflores-cence relative humidity of the nebulized material and the rest vented. The aerosol was then charged and classified with a Vienna type DMA. The classified aerosol was diluted and conducted through a Permapure nafion tube which humidi-fied the aerosol to a controlled RH.
CPC Neutralizer
Humidity control
unit
DMA
Impactor
Sample cell
Filter
Vacuum pump Sample
Fig. 1.Measurement setup used in the DRH experiments. The dark
route through valves denote the sampling period and white route the measurement period.
After the humidifier there was a residence time of 3 s af-ter which the flow was separated to the impactor and to the ultrafine water condensation particle counter (UWCPC, TSI 3786) to measure the number concentration entering into the impactor. The flow to the impactor was constricted using a pinhole orifice and a needle valve to achieve desired upper pressure for the impactor. The flow leaving the impactor is guided to a vacuum pump through a sampling cell of a vol-ume of 0.4 l and a needle valve. This is referred to as the sampling mode, and denoted in dark in the valves in Fig. 1.
The sampling is continued until the impactor pressures have stabilized and the sampling cell has been flushed several times. Next the valves are turned such that the cell is repres-surized with particle free air and the CPC is measuring the decreasing concentration of particles in the cell. This is the measurement mode, and is denoted in white in the valves in Fig. 1. The measurement is continued until sufficient number of particles are measured, after which the system is returned to the sampling mode.
The bounced fraction can be computed from the UWCPC data record by comparing the concentration from upstream of the impactor and the sample from the repressurised sam-ple cell. To take in to account the decrease in concentration caused by dilution and the different losses at separate routes and residence times for the reference sample and the bounced sample, a baseline sample calibration was done with the col-lection plate removed. The bounced fraction of the particles can be thus calculated as the relation of the passed particles to the entering particles, divided by the same relation for the baseline sample.
Table 1.The operational parameters for the impactor, puand plare the pressures above and below the jet stage, respectively andd50is the 50 % collection efficiency cutpoint of the impactor as calibrated.
NTP Air flow d50 Jet diameter Jet number pu pl
2.3 lpm 120 nm 0.3 mm 5 68.56 kPa 38.72 kPa
100 150 200
0 0.2 0.4 0.6 0.8 1
Aerodynamic size, nm
Collection Efficiency
AS LG
Measured Sigmoid fit LG and AS sizes
Fig. 2. The collection efficiency curve and sigmoid fit for the
im-pactor stage used. Marked are the aerodynamic sizes and corre-sponding collection efficiencies for levoglucosan (LG) and ammo-nium sulfate (AS).
The chosen mobility sizes of the levoglucosan and am-monium sulphate particles were 105 and 115 nm, respec-tively. When taking into account the densities of the sub-stances (1.618 g cm−3Rosenørn et al., 2006 and 1.77 g cm−3 Lide, 2008, respectively) and assuming spherical particles, the aerodynamic size for levoglucosan particles is 155 nm and for ammonium sulfate particles 181 nm.
The impactor collection efficiency curve was measured us-ing dioctyl sebacate (DOS), in a similar setup described for electrical low pressure cascade impactor in Keskinen et al. (1999). The collection efficiency curve for the impactor used is shown in Fig. 2.
When efflorescence relative humidity measurements were done, an extra nafion tube humidifier was set to 80 % and after a minimum of 3 s residence time, the second nafion tube was used to dry the sample and further 3 s residence time was allowed before measurement step.
2.1 Data analysis
When operating with particle sizes where the calibrated col-lection efficiency shown in Fig. 2 is below unity, a further correction is needed to get the bounced fraction of the parti-cles separated from the partiparti-cles which do not impact to the
substrate. This corrected bounced fraction is calculated as:
B=B
′−(1−C E(da)) CE(da)
(1)
whereB′is the measured, uncorrected bounced fraction and
CE(da)is the calibrated collection efficiency at the
aerody-namic particle sizeda that was used. The use of correction
allows for the use of smaller particle sizes where the collec-tion efficiency has not reached unity. The downside is the re-duced dynamics; using correction means scaling up the real data, but at the same time scaling up the noise. Thus it is not advisable to operate the impactor at the lower portion of the collection efficiency curve. The use of the steepest portion of the curve may also induce larger errors due to the errors in the calculated aerodynamic diameter discussed below; error in the diameter, shape or density causes large error in col-lection efficiency if the slope is very steep. It should be also noted, that the particle aerodynamic size needs to be known to make the correction.
The aerodynamic particle size can be calculated with (Kelly and McMurry, 1992):
da=dp C
C(dp) CC(da)
1/2ρ e ρ0
1/2
, (2)
wheredp is the mobility diameter, CC is the Cunningham
slip correction factor, andρeandρ0are the effective densities of the particle matter and water, respectively. The aerody-namic particle sizes for dry particles are 155 nm and 181 nm for levoglucosan and ammonium sulfate.
The growth factors for the aerosols were not measured, but based on Mikhailov et al. (2009), the growth factor at the maximum attainable humidity conditions system, 60 % RH (see Figs. 5 and 4) for levoglucosan is 1.2 and about 1.3 for deliquesced ammonium sulfate. While this is a notable increase in the mobility diameter, the aerodynamic diame-ter, for which the collection efficiency is calibrated, does not change very much. When the particles are hydrated, the new diameter isdp·GF and the effective density, assuming a
vol-ume additivity of the mixture:
ρp=
ρp+ρ0 GF3−1
GF3 (3)
A B
a)
D b)
RH RH
B
ounced fract
ion
G
rowt
h
fact
or
Hydration Dehydration
Fig. 3. A schematic figure of the relation of the fraction of the
bounced particles and growth factor during hydration and dehydra-tion of,(a)a crystalline solid sample and(b)an amorphous solid sample. Growth factor curve schematics adapted from Mikhailov et al. (2009).
are 162 nm and 188 nm, respectively. This results in a maxi-mum error of 3.2 % of the collection efficiency. Further error analysis gives the maximum error on corrected bounce to be:
1B=1 −B′
CE 1CE (4)
At the maximum condition i.e. lowest used collection effi-ciency and lowest bounce fraction (zero), the error is 3.8 %, which is within experimental noise.
2.2 Hydration and dehydration induced phase transitions
The humidity induced phase transitions of crystalline and amorphous solids are explained thoroughly by Mikhailov et al. (2009) and experimental data for ammonium sulfate and levoglucosan are presented. Briefly, crystalline sub-stances exhibit hysteresis upon the phase change very clearly in step-function like manner and amorphous solids have a wide, continuous regime of hydration induced water uptake. Figure 3 shows schematic representations of the effect of phase change to growth factor and to bounce probability. When relating the measured bounce data with the sample hu-midity, the pressure reduction in the impactor must be taken into account. As the pressure decreases, the concentration of water molecules reduces in the ratio of the pressure drop. We denote this RH inside the impactorImpactor RH,RHI.
RHI=RHH pu
pamb (5)
where RHHis the relative humidity in the humidifier andpu andpamb are the impactor upper pressure and the ambient pressure, respectively. The impactor upper pressure for the present study is 68.56 kPa. This limits the operational RH range in the impactor to less than 65 % RHI.
The particles have sufficient time (0.9 s) to equilibrate to the Impactor RH. This means that in practice, we are drying the particles in the impactor. In the results section figures, also the relative humidity before the impactor, Humidifier RH, is shown on a separate axis.
The particle experiences a short time in the lower-pressure acceleration region before there is a section of stagnation pressure before the impaction. The timescale of the accel-eration and the impaction are in the order of microseconds. Based on this we assume that the conditions above the stage define the state of the particles at the moment of impaction. This assumption is verified by the results from ammonium sulfate aerosol and is further discussed in the results section. When the sample RH in the inlet of the impactor is higher than the deliquescence RH of the substance (point A in Fig. 3a) particle remain liquid in the impactor conditions if the Impactor RH is higher than the ERH of the material (point B in the Fig. 3a). In that case, the DRH point can be determined by bounce measurement. If the Impactor RH is lower than the ERH, particles are solid at the moment of the impaction and no clear changes in the bounce of the parti-cles can be seen even if the sample RH is increased to values corresponding DRH. To avoid the latter case, the operation point should be chosen for high enough pressure.
When the efflorescence behavior of the particle is investi-gated, the sample is first humidified (RH values larger than DRH). After the humidification, the sample is dried by drier and then lead to the impactor. The sample is further dried due to the pressure drop in the impactor. The sample humidity is altered by altering the dryer conditions until the Impactor RH achieves ERH values and bounce increases again (point B in Fig. 3a).
For the amorphous particles the deliquescence is contin-uous in a wide range and there is no sharp hysteresis and thus no sharp phase transition on either the growth factor (Mikhailov et al., 2009) or the bounce probability. This is represented by area D in Fig. 3b.
3 Results
The method is demonstrated with ammonium sulfate as the crystalline test substance and levoglucosan as the amorphous test substance. Both of these substances are easy to ob-tain and their phase state when in aerosol form, with respect to relative humidity, is well documented (Mikhailov et al., 2009)
3.1 Crystalline solid
Humidifier RH%
Bounced fraction
20 30 40 50 60 70 80 90 100
0 0.2 0.4 0.6 0.8 1
Hydration Dehydration Hydration,GF−corr.
20 30 40 50 60
Impactor RH%
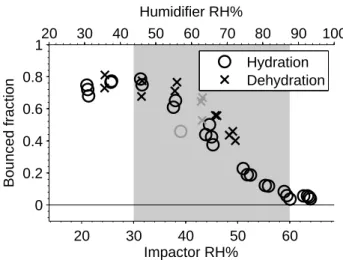
Fig. 4.Bounce fractions of ammonium sulfate aerosol at hydration
and dehydration experiments. TheGF-correctedpoints denote hy-dration points corrected for water uptake induced change in aerody-namic particle size as discussed previously. The first humidifier was kept at 90 % RH for the ERH run. The arrows point at the efflores-cence and deliquesefflores-cence relative humidities reported in Mikhailov et al. (2009). Bounced fraction is corrected according to Eq. 1. The gray symbols denotedownscan points, to show the effect of loading of the substrate.
humidity. Although the actual humidity the particle is ex-posed is lower than DRH, the hysteresis of the deliquescence ensures wetted phase state, once the particles have reached the DRH. The DRH for ammonium sulfate particles defined by Mikhailov et al. (2009) is marked by the gray arrow in Fig. 4.
As can be seen in Fig. 4 the bounce of AS particles de-creases from value of approximately 0.75 to 0.3 already at the sample RH values lower than DRH. We relate this behav-ior to adsorption of water molecules on ammonium sulfate particles (Romakkaniemi et al., 2001; Biskos et al., 2006; Mikhailov et al., 2009) as well as possibly on the surface of the collection substrate.
When measuring the efflorescence point, deliquesced par-ticles are dried from their DRH, until at around 30 % Im-pactor RH the particles start to bounce again. This ERH value measured by the bounce method is comparable to ERH values measured for ammonium sulfate particles by the HT-DMA method (Mikhailov et al., 2009; Onasch et al., 1999; Brooks et al., 2002). The results are well in line with the assumption that the humidity inside the impactor is reduced by the ratio of the pressure above the impactor stage to the ambient pressure and that the particles do equilibrate to the humidity conditions in the impactor.
The particle bounce does not go up all the way to unity, but at about 20 % Impactor RH, stays at 0.8. This indicates either that when the impactor plate is in place, the changes in flow pattern induce more losses to the walls and the roof of the
im-Humidifier RH%
Bounced fraction
20 30 40 50 60 70 80 90 100
0 0.2 0.4 0.6 0.8 1
Hydration Dehydration
20 30 40 50 60
Impactor RH%
Fig. 5. Bounce fractions of levoglucosan aerosol at hydration and
dehydration experiments. The first humidifier was kept above 75 % RH for the ERH run. The gray patch indicates the transitional area from solid to liquid, reported by Mikhailov et al. (2009). Bounced fraction is corrected according to Eq. (1). The gray open symbols denotedownscan points, to show the effect of loading of the sub-strate.
pactor stage, compared to the baseline setup, or that some of the particles still stick to the impactor plate on impact. With the Humidifier RH above deliquescence, the bounced frac-tion, when corrected for collection efficiency, is at, or slightly below zero. When the estimated effect of water absorption on aerodynamic size is included, as discussed in Sect. 2.1, the corrected bounce fraction rises slightly to, or above the zero level (filled circles in Fig. 4).
The effect of loading of the impactor substrate during the experiments was studied by measuring additional points at low humidity values∼30 % RH, after measuring the com-plete range from low humidity to high humidity. These downscan pointsare marked with gray edges in Fig. 4. There is no difference in bounce to the level measured in the up-stepping part of the data. The magnitude of the loading ef-fect is expected to be loading-dependent; at this experiment at number concentration of 1.7 to 2.6×103cm−3it is neg-liglible.
3.2 Amorphous solid
(Sperling, 2006; Franks, 1993). This, however does not in-hibit the bounce, as solid-like or rubbery substance still resti-tute enough impaction energy for the bounce.
The bounce continues to decrease as the relative humidity increases and achieves minimum value around Impactor RH 60 %. Mikhailov et al. (2009) report that at the relative hu-midity of 60 % the particles are fully deliquesced, while par-tially deliquesced starting from 30 % RH, which corresponds well with our observation.
Amorphous particles with extremely high viscosity may exhibit large time constants in diffusive water uptake (Shi-raiwa et al., 2011). The effect of increasing residence time, both in the ambient pressure and in the lowered pressure of the impactor was tested, but no effect was seen.
In general, the levoglucosan particle bounce curves be-have as expected for an amorphous solids; the water uptake softens the particles and reduces the bounce steadily as the humidity is increased. This gradual softening is caused by the ability of water to function as a plasticizer for the lev-oglucosan particles (Sperling, 2006; Franks, 1993). This dif-ference between the bounce behavior of ammonium sulfate and levoglucosan suggests that the distinction between crys-talline and amorphous particles can be achieved with a rather simple measurement.
With levoglucosan the particle concentration was higher than with ammonium sulfate experiment,∼104cm−3. The effect of loading for the hydration run of the experiment seems larger, as the downscan point is lower than the previ-ous points, but on the efflorescence part, with multiple points the effect seems to be minor, and the downscan points are close to within noise limits on average.
4 Conclusions
We presented a new method for studying the phase state of aerosol particles in atmospherically relevant particle size range. The reported method decouples any change in the charge transfer properties of the particles from the measure-ment signal, so the effect of particle phase changes on bounce alone can be investigated.
Two chosen test substances show expected behavior; am-monium sulfate has sharp phase changes and hysteresis at relative humidities reported previously. Likewise, amor-phous levoglucosan particles have more continuous and versible phase change in a wide humidity range. The re-ported method can be also used to study the phase changes caused by changes not visible on the particle size, for exam-ple by atmospheric chemical aging of the particles.
The current shortcomings of the method are drop in vapor pressure associated with the pressure drop when introducing the sample to the impactor, and the lack of a quantitative con-nection of the bounce probability and the physical properties of the particles, such as elastic properties or viscosity. These issues are being investigated and are topics for future studies.
The substrate loading effects can be managed with monitor-ing of the bounce with additional measurement points and proper concentration control and cleaning of the substrate.
The sensitivity of the method to the surface of the impact-ing particles is also of interest (see Fig. 4). The decrease of bounced fraction with ammonium sulfate suggests that the method can be used to test partial water uptake observed also on some other crystalline solids such as sodium chloride (Wise et al., 2008). The knowledge of the degree of deliques-cence corresponding to the drop in bounce probability could allow for particle coating specific measurements and more thorough studies of impaction dynamics.
Another suitable use for the method is the differentiation between amorphous and crystalline forms of different mate-rials. This measurement could be done not only with deli-quescence with water but with for example temperature in-duced phase change, where similar behavior is present. Acknowledgements. This work has been supported by Maj and Tor Nessling Foundation Grant 2012501.
Edited by: H. Herrmann
References
Bilde, M. and Svenningsson, B.: CCN activation of slightly soluble organics: the importance of small amounts of inorganic salt and particle phase, Tellus B, 56, 128–134, doi:10.1111/j.1600-0889. 2004.00090.x, 2004.
Biskos, G., Paulsen, D., Russell, L. M., Buseck, P. R., and Martin, S. T.: Prompt deliquescence and efflorescence of aerosol nanopar-ticles, Atmos. Chem. Phys., 6, 4633–4642, doi:10.5194/acp-6-4633-2006, 2006.
Brooks, S. D., Wise, M. E., Cushing, M., and Tolbert, M. A.: Deliquescence behavior of organic/ammonium sulfate aerosol, Geophys. Res. Lett., 29(19), 1917, doi:10.1029/2002GL014733, 2002.
Dahneke, B.: The capture of aerosol particles by surfaces, Journal of colloid and interface science, 37, 342–353, 1971.
Debenedetti, P. and Stillinger, F.: Supercooled liquids and the glass transition, Nature, 410, 259–267, 2001.
Franks, F.: Solid aqueous solutions, Pure and applied chemistry, 65, 2527–2538, 1993.
Hori, M., Ohta, S., Murao, N., and Yamagata, S.: Activation ca-pability of water soluble organic substances as CCN, J. Aerosol Sci., 34, 419–448, doi:10.1016/S0021-8502(02)00190-8, 2003. Hudson, J.: Cloud condensation nuclei, J. Appl. Meteorol., 32, 596–
607, 1993.
Kelly, W. and McMurry, P.: Measurement of Particle Density by In-ertial Classification of Differential Mobility Analyzer–Generated Monodisperse Aerosols, Aerosol Sci. Technol., 17, 199–212, 1992.
Keskinen, J., Marjamäki, M., Virtanen, A., Mäkelä, T., and Hillamo, R.: Electrical calibration method for cascade impactors, J. Aerosol Sci., 30, 111–116, doi:10.1016/S0021-8502(98) 00026-3, 1999.
Liu, B., Pui, D., Whitby, K., Kittelson, D., Kousaka, Y., and McKenzie, R.: The aerosol mobility chromatograph: a new de-tector for sulfuric acid aerosols, Atmos. Environ., 12, 99–104, 1978.
Marcolli, C. and Krieger, U. K.: Phase Changes during Hygroscopic Cycles of Mixed Organic/Inorganic Model Systems of Tropo-spheric Aerosols, The Journal of Physical Chemistry A, 110, 1881–1893, doi:10.1021/jp0556759, 2006.
Mikhailov, E., Vlasenko, S., Martin, S. T., Koop, T., and Pöschl, U.: Amorphous and crystalline aerosol particles interacting with water vapor: conceptual framework and experimental evidence for restructuring, phase transitions and kinetic limitations, At-mos. Chem. Phys., 9, 9491–9522, doi:10.5194/acp-9-9491-2009, 2009.
Onasch, T., Siefert, R., Brooks, S., Prenni, A., Murray, B., Wilson, M., and Tolbert, M.: Infrared spectroscopic study of the deli-quescence and efflorescence of ammonium sulfate aerosol as a function of temperature, J. Geophys. Res., 104, 21317–21326, 1999.
Pope, F. D., Dennis-Smither, B. J., Griffiths, P. T., Clegg, S. L., and Cox, R. A.: Studies of Single Aerosol Particles Containing Mal-onic Acid, Glutaric Acid, and Their Mixtures with Sodium Chlo-ride. I. Hygroscopic Growth, The Journal of Physical Chemistry A, 114, 5335–5341, doi:10.1021/jp100059k, pMID: 20361768, 2010.
Rader, D. and McMurry, P.: Application of the tandem differential mobility analyzer to studies of droplet growth or evaporation, J. Aerosol Sci., 17, 771–787, 1986.
Roberts, G. and Nenes, A.: A continuous-flow streamwise thermal-gradient CCN chamber for atmospheric measurements, Aerosol Sci. Tech., 39, 206–221, 2005.
Rogers, L. and Reed, J.: The adhesion of particles undergoing an elastic-plastic impact with a surface, Journal of Physics D: Ap-plied Physics, 17, 677–689, 1984.
Romakkaniemi, S., Hämeri, K., Väkevä, M., and Laaksonen, A.: Adsorption of Water on 8Å15 nm NaCl and (NH4)2SO4 Aerosols Measured Using an Ultrafine Tandem Differential Mo-bility Analyzer, The Journal of Physical Chemistry A, 105, 8183–8188, doi:10.1021/jp010647l, 2001.
Rosenørn, T., Kiss, G., and Bilde, M.: Cloud droplet activation of saccharides and levoglucosan particles, Atmos. Environ., 40, 1794–1802, doi:10.1016/j.atmosenv.2005.11.024, 2006. Seinfeld, J., Pandis, S., and Firm, K.: Atmospheric chemistry and
physics: from air pollution to climate change, Wiley New York, 1998.
Shiraiwa, M., Ammann, M., Koop, T., and Pöschl, U.: Gas up-take and chemical aging of semisolid organic aerosol particles, Proceedings of the National Academy of Sciences, 108, 11003– 11008, doi:10.1073/pnas.1103045108, 2011.
Sperling, L.: Introduction to physical polymer science, Wiley On-line Library, 2006.
Virtanen, A., Joutsensaari, J., Koop, T., Kannosto, J., Yli-Pirilä, P., Leskinen, J., Mäkelä, J., Holopainen, J., Pöschl, U., Kul-mala, M., Worsnop, D. R., and Laaksonen, A.: An amorphous solid state of biogenic secondary organic aerosol particles, Na-ture, 467, 824–827, 2010.
Wise, M., Martin, S., Russell, L., and Buseck, P.: Water uptake by NaCl particles prior to deliquescence and the phase rule, Aerosol Sci. Technol., 42, 281–294, 2008.
Zahardis, J. and Petrucci, G. A.: The oleic acid-ozone heteroge-neous reaction system: products, kinetics, secondary chemistry, and atmospheric implications of a model system – a review, At-mos. Chem. Phys., 7, 1237–1274, doi:10.5194/acp-7-1237-2007, 2007.