Antônio Augusto Moura da SilvaI
Leopoldo Muniz da SilvaI Marco Antonio BarbieriII Heloísa BettiolII
Luciana Mendes de CarvalhoI Valdinar Sousa RibeiroIII Marcelo Zubaran GoldaniIV
I Departamento de Saúde Pública. Universidade Federal do Maranhão. São Luís, MA, Brasil
II Departamento de Puericultura e Pediatria. Faculdade de Medicina de Ribeirão Preto. Universidade de São Paulo. São Paulo, SP, Brasil
III Departamento de Medicina III. Universidade Federal do Maranhão. São Luís, MA, Brasil
IV Departamento de Pediatria e Puericultura. Faculdade de Medicina. Universidade Federal do Rio Grande do Sul. Porto Alegre, RS, Brasil
Correspondence:
Antônio Augusto Moura da Silva Universidade Federal do Maranhão Departamento de Saúde Pública R. Barão de Itapary, 155 – Centro 65020-070 São Luís, MA, Brasil E-mail: [email protected] Received: 9/10/2009 Approved: 4/12/2010
Article available at: www.scielo.br/rsp
The epidemiologic paradox of
low birth weight in Brazil
O paradoxo epidemiológico do baixo
peso ao nascer no Brasil
ABSTRACT
OBJECTIVE: To examine whether the low birth weight (LBW) paradox exists in Brazil.
METHODS: LBW and cesarean section rates between 1995 and 2007 were estimated based on data from SINASC (Brazilian Live Births Database). Infant mortality rates (IMRs) were obtained using an indirect method that correct for underreporting. Schooling information was obtained from census data. Trends in LBW rate were assessed using joinpoint regression models. The correlations between LBW rate and other indicators were graphically assessed by lowess regression and tested using Spearman’s rank correlation.
RESULTS: In Brazil, LBW rate trends were non-linear and non-signifi cant: the rate dropped from 7.9% in 1995 to 7.7% in 2000, then increased to 8.2% in 2003 and remained nearly steady thereafter at 8.2% in 2007. However, trends varied among Brazilian regions: there were signifi cant increases in the North from 1999 to 2003 (2.7% per year), and in the South (1.0% per year) and Central-West regions (0.6% per year) from 1995 to 2007. For the entire period studied, higher LBW and lower IMRs were seen in more developed compared to less developed regions. In Brazilian States, in 2005, the higher the IMR rate, the lower the LBW rate (p=0.009); the lower the low schooling rate, the lower the LBW rate (p=0.007); the higher the number of neonatal intensive care beds per 1,000 live births, the higher the LBW rate (p=0.036).
CONCLUSIONS: The low birth weight paradox was seen in Brazil. LBW rate is increasing in some Brazilian regions. Regional differences in LBW rate seem to be more associated to availability of perinatal care services than underlying social conditions.
Low birth weight (LBW) rate is defi ned as the propor-tion of live births < 2,500 grams and it has been clas-sically considered a marker of social development. LBW rates are expected to be lower in more developed settings16 and the lower the LBW rates the lower the
infant mortality rates (IMR). In Brazil, in the 1960s and
1970s, LBW rate (≤ 2,500 g) was lower in Ribeirão
Preto (8.7% in 1968–1970), a more developed city in Southeast Brazil,16 than in three maternity hospitals
in Recife (14.6% in 1974), a less developed city in Northeast Brazil,14,16 whereas IMR was higher in Recife
(91.2 per thousand in 1969) than in Ribeirão Preto (52.5
per thousand in 1968–1970).12,15 In addition, LBW
rate tended to decrease as economic development and life conditions improved, as seen in Recife, where it dropped from 14.6% in 197414 to 9.1% in 2005.a
However, LBW rates have been recently found to be higher in more developed (South and Southeast) than
RESUMO
OBJETIVO: Identifi car a presença do paradoxo do baixo peso ao nascer (BPN) no Brasil.
MÉTODOS:As taxas de BPN e de cesárea, de 1995 a 2007, foram estimadas a partir do Sistema de Informações sobre Nascidos Vivos. As taxas de mortalidade infantil, foram calculadas por métodos indiretos, com correção para sub-registro. A taxa de escolaridade foi obtida de dados censitários. As tendências da taxa de BPN foram avaliadas utilizando-se modelos de regressão joinpoint. As associações entre a taxa de BPN com outros indicadores foram avaliadas por regressão lowess e correlação de Spearman.
RESULTADOS: No Brasil, as tendências da taxa de BPN foram não lineares e não signifi cantes: a taxa caiu de 7,9% em 1995 para 7,7% em 2000, aumentando para 8,2% em 2003 e permanecendo estável em 8,2% em 2007. Entretanto, as tendências variaram nas regiões brasileiras: houve aumentos signifi cantes no Norte (2,7% por ano), de 1999 a 2003, e no Sul (1,0% por ano) e Centro-Oeste (0,6% por ano), de 1995 a 2007. As taxas de BPN foram mais altas e as taxas de mortalidade infantil mais baixas nas regiões mais desenvolvidas do que nas menos desenvolvidas. Em 2005, quanto mais elevada a taxa de mortalidade infantil, menor foi a taxa de BPN (p = 0,009); quanto mais alta a taxa de baixa escolaridade, menor foi a taxa de BPN (p = 0,007); quanto maior o número de leitos de terapia intensiva neonatal por 1.000 nascidos vivos, mais elevada foi a taxa de BPN (p = 0,036).
CONCLUSÕES: O paradoxo do BPN foi detectado no Brasil. A taxa de BPN está aumentando em algumas regiões brasileiras. Diferenças regionais na taxa de BPN parecem estar mais relacionadas à disponibilidade de assistência perinatal do que às condições sociais.
DESCRITORES: Recém-Nascido de Baixo Peso. Mortalidade Infantil. Cesárea. Assistência Perinatal. Brasil.
INTRODUCTION
a Ministério da Saúde. Nascidos vivos - Pernambuco. Nascimentos por residência da mãe segundo peso ao nascer. Município: Recife. Período: 2005. Brasília; 2005[cited 2007 Dec 08]. Available from: http://tabnet.datasus.gov.br/cgi/tabcgi.exe?sinasc/cnv/nvpe.def
in less developed regions (North and Northeast) in Brazil. LBW rate is higher in regions where IMR is lower.13 In some Brazilian cities with improving life
conditions, LBW rate is increasing, e.g., it increased in Ribeirão Preto from 7.6% in 1978–1979 to 10.6% in 1994.17 In the Southern city of Pelotas, LBW rate
also increased from 9.0% in 1982 to 10.4% in 2004.3
Increasing LBW rates have also been reported in other countries such as the USA where it rose from 6.8% in 1980 to 7.6% in 2000.4
The so-called epidemiologic paradox of low birth weight seems to exist in Brazil where higher LBW rates are seen in more developed regions and lower rates in less developed ones. This paradox has also been described in the USA where Hispanic women of lower socioeconomic status have lower LBW rates compared to better-off white women.6 The most accepted
b Ministério da Saúde. Taxa de mortalidade infantil. Número de óbitos infantis (menores de 1 ano) por 1.000 nascidos vivos. Brasil, 1997-2005. Brasília; 2005[cited 2009 May 06]. Available from: http://tabnet.datasus.gov.br/cgi/idb2007/c01.htm
c Simões CC. Brasil. Estimativas da mortalidade infantil por microrregiões e municípios. Brasília: Ministério da Saúde; 1999.
d Ministério da Saúde. F.10 Razão entre nascidos vivos informados e estimados. Razão por ano, segundo Região e UF, Brasil, 1994 a 2005. Brasília; 2005[cited 2009 May 06]. Available from: http://tabnet.datasus.gov.br/cgi/idb2007/f10.htm
e Instituto Brasileiro de Geografi a e Estatística. Projeções de população do Brasil, grandes regiões e unidades de federação, por sexo e idade, para o período 1991-2030. Rio de Janeiro; 2004.
f Ministério da Saúde. Níveis de escolaridade da população de 15 anos e mais. Taxa de escolaridade (%) segundo Região, 2005. Brasília; 2005[cited 2009 May 06]. Available from: http://tabnet.datasus.gov.br/cgi/tabcgi.exe?idb2007/b02.def
g Ministério da Saúde. Cadastro Nacional de Estabelecimentos de Saúde. Brasília; 2000[cited 2007 Dec 08]. Available from: http://cnes. datasus.gov.br/Mod_Ind_Tipo_Leito.asp?VEstado=http://cnes.datasus.gov.br/Mod_Ind_Leitos_Listar.asp?VCod_Leito=63&VTipo_Leito=3&VList ar=1&VEstado=&VMun=
h National Cancer Institute. Joinpoint Regression Program, Version 3.3. Rockfi eld; 2009[cited 2009 May 06]. Available from: http://srab.cancer. gov/joinpoint/
data quality due to underreporting of live births in less developed regions.13
However, not only higher LBW rates are seen in more developed regions but also IMR is decreasing in all Brazilian regions with improved health care. The explanation that LBW paradox is due to underreporting of live births in less developed regions has been chal-lenged. Data from population studies which are less prone to underreport live births have consistently shown higher LBW rate in the more developed city of Ribeirão Preto than in the less developed city of São Luís.20,21 It
is not clear whether this paradox is a true epidemiologic phenomenon similar to that described in developed countries where increasing LBW rates have been asso-ciated with increasing medical interventions.9
The objective of the present study was to examine whether the so-called low birth weight paradox exists in Brazil.
METHODS
Brazil is divided into fi ve geographical regions and 27 states. The South and Southeast regions are the most developed and the North and Northeast are the least developed, while the Central-West region lies some-where in the middle.
LBW rate was calculated based on data from the Brazilian Live Births Database (SINASC). For compar-ison purposes, newborns weighing <500 g and those with missing birth weight information were excluded from the analyses. LBW rate trends in the fi ve Brazilian regions were assessed from 1995 to 2007.
The IMR from 2005 was obtained from the most recent information available in the 2007 Brazilian Basic
Data and Indicators (IDB-2007).b It was calculated
directly from the Brazilian Mortality Database (SIM) and SINASC for Brazilian states where SIM coverage
and regular data fl ow was 80% or higher and SINASC
coverage was 90% or higher. Since underreporting of live births prevents direct calculations of IMR in the least developed Brazilian regions, for all other states the IMR was obtained by indirect methods. b A variant
of the Brass demographic technique proposed by
Trussel and Coale-Trussel was used. Based on census and the Brazilian National Household Study (PNAD) data on live births and living children at the time of interview, death proportions according to maternal age were used to estimate the probability of child death at each age. Fecundity rates were obtained using the ques-tions on total number of live-born children who were born in the last 12 months and then used to estimate the number of live births.c
SINASC coverage was calculated by dividing the actual number of live births by the estimated number of live births.d The estimated number of live births was
obtained from the Brazilian Institute of Geography and Statistics (IBGE) demographic estimates based on mortality, fecundity and migration projections using the
method of components.e
Less than one year of schooling information among those aged 15 years or more was obtained from IBGE
database for socioeconomic indicators.f Cesarean
section rates were obtained from SINASC. The number of neonatal intensive care beds available in each state was obtained from the Brazilian National Registry of
Health Services (CNES),g which was then divided by
1,000 live births to control for population size. Cesarean section rates and number of neonatal intensive care beds per 1,000 live births were taken as proxies of medical intervention.
All data were summarized from the last year with complete information on all variables.
To identify signifi cant trend changes, we carried out a joinpoint regression analysis using the US National Cancer Institute Surveillance Research Program
software.h The Joinpoint Regression Program was
Carlo Permutation method (i.e. it fi nds “the best fi t” line for each segment).10 In our analysis, a maximum
of three joinpoints (four line segments) was allowed for each model. Once line segments were established, the estimated annual percent change was used to describe and test the statistical signifi cance of trends. Testing the hypothesis (two-sided p-value = 0.05) that the annual percent change is equal to zero is equivalent to testing the hypothesis that LBW trend is neither increasing nor decreasing.
For 2005, correlations between LBW and IMR, cesarean section rates, proportion of individuals aged 15 years or more with less than one year of schooling, and number of neonatal intensive care beds per 1,000 live births were graphically assessed by lowess regres-sion and tested using Spearman’s rank correlation because of non-linearity. The level of signifi cance was set at 0.05. Lowess regression is a locally weighted linear regression to smooth data, it makes no assump-tions on the nature of relaassump-tionship and allows to assess it using the data itself.5
The Wilcox-Russell method was used for an indirect estimate of small preterm birth rate using information on birth weight distribution.24 The frequency
distribu-tion of birth weight is approximately normal with an extended lower tail. The normal component of birth weight distribution is called predominant distribution and closely corresponds to the birth weight distribution of term births. The tail is called residual distribution and comprises small preterm babies. The cut-off point between predominant and residual distributions was based on serial and decreasing points immediately below the population’s mean weight estimated using an online software.24 An indirect method to estimate
small preterm birth rate was chosen because it is not clear whether SINASC data is valid for the estimation of preterm birth rate. Although a study concluded that there was good agreement on gestational age between
SINASC and data from a population-based study,23
another study found poor agreement between SINASC and cohort data.18
RESULTS
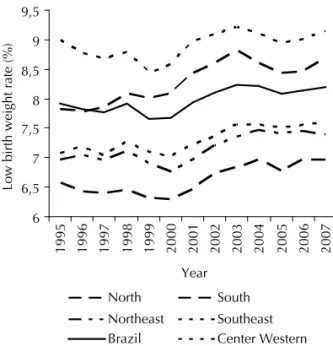
In Brazil, LBW rate trends were linear and non-signifi cant: the rate dropped from 7.9% in 1995 to 7.7% in 2000, then increased to 8.2% in 2003 and remained nearly steady thereafter at 8.2% in 2007. For the entire period studied, LBW rates varied in different regions: lower rates were found in less developed regions (North, Northeast and Central-West) and higher rates in more developed ones (Southeast and South), sharply contrasting to what was expected. In 2007, the highest LBW rate was seen in the Southeast (9.1%) and the lowest in the North (7.0%) (Figure 1).
The joinpoint analysis showed that trends varied among Brazilian regions. In the Northeast and Southeast, LBW rate dropped from 1995 to 1999–2000, then increased until 2002–2004 and leveled off. Trends in Brazil, in the Southeast and Northeast regions were non-linear
and non-signifi cant. In the Southeast, LBW rate in
2007 was practically the same as that seen in 1995. However, there were signifi cant increases in the North from 1999 to 2003 (2.7% per year), in the South from 1995 to 2007 (1.0% per year) and in the Central-West (0.6% per year) (Table 1).
In 2005, LBW rates were higher in more developed regions (South and Southeast) with higher small preterm birth rates. Small preterm birth rate estimated by the percentage of birth weights in the residual distri-bution using the Wilcox-Russell method was higher in more developed (3.2% and 3.1% in the Southeast and South, respectively) than in less developed regions (2.2%, 2.6% and 2.7% in the North, Northeast and Central-West, respectively). Conversely, mean birth weights were higher in less developed (3,287 g in the Northeast) than in more developed regions (3,210 g in the Southeast), a difference of 77 g (Table 2).
In 2005, SINASC coverage was higher than 85% in all regions. IMRs were lower in more developed (14.2 per 1,000 in the Southeast) than in less developed regions (31.6 per 1,000 in the Northeast). IMRs were higher where the proportion of individuals aged 15 year or more with less than one year of schooling were also higher (Table 2).
6 6,5 7 7,5 8 8,5 9 9,5
1995 1996 1997 1998 1999 2000 2001 2002 2003 2004 2005 2006 2007
Year
Low birth weight rate (%)
North
Northeast Southeast
South
Center Western Brazil
a Low birth weight rate was derived from SINASC ((Brazilian
Live Births Database). Newborns weighing < 500g were excluded from calculations.
Figure 1. Low birth weight ratesa in Brazil nationwide and
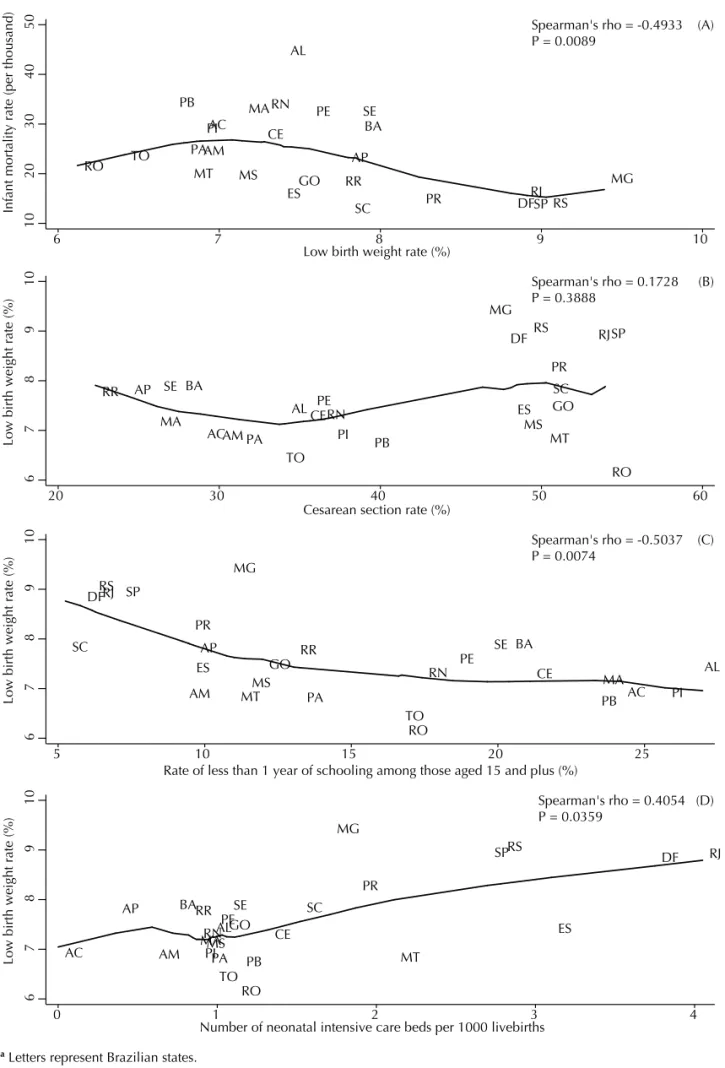
In 2005, IMRs and LBW rates were negatively correlated (p=0.009). More developed states had higher LBW rates and lower IMRs (Figure 2A). LBW rate was not corre-lated with cesarean section rate (p=0.389) (Figure 2B). However, data suggest a non-linear trend: when cesarean section rates were around 30% LBW rates tended to decline as cesarean section increased. But when the rates were higher than 30% LBW rates tended to increase with cesarean sections. The higher the proportion of individuals with low schooling in a state, the lower the LBW rate (p=0.007) (Figure 2C). The higher the number of neonatal intensive care beds per 1,000 live births the higher the LBW rate (p=0.036) (Figure 2D).
DISCUSSION
From 1995 to 2007, no signifi cant LBW rate trend was evident in Brazil nationwide: it decreased from 1995 to 2000, then increased until 2003 and remained practi-cally steady thereafter. However, trends varied among Brazilian regions. There were signifi cant increases in the North from 1999 to 2006, and in the South and Central-West from 1995 to 2007. Brazilian regions seem to be at different stages of epidemiological peri-natal transition. LBW rates are still increasing in some regions whereas they have leveled off in others. An increase in LBW rate has also been described in devel-oped countries such as the US4 and Canada.i Brazilian
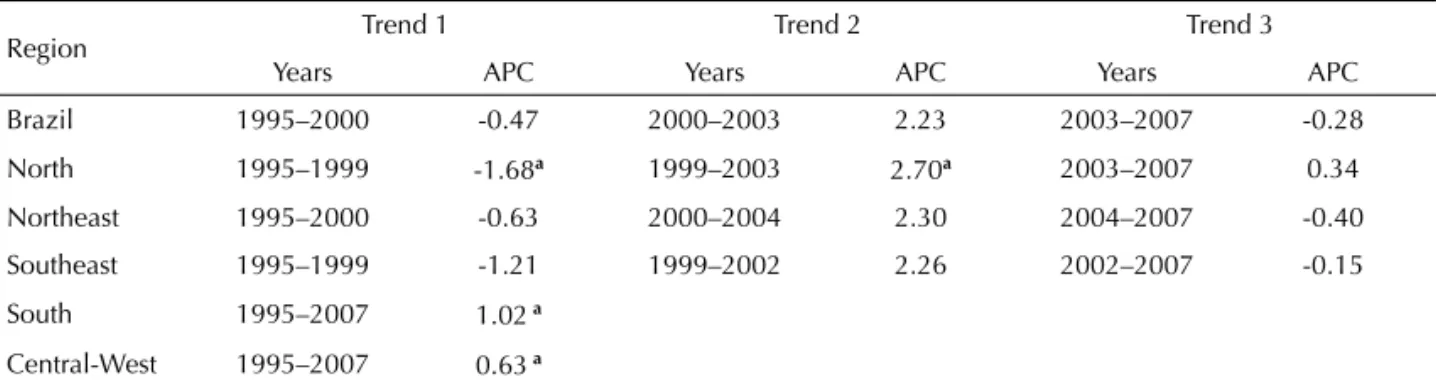
Table 1. Joinpoint regression analysis of LBW rate trends in Brazil nationwide and fi ve regions. Brazil, 1995-2007.
Region Trend 1 Trend 2 Trend 3
Years APC Years APC Years APC
Brazil 1995–2000 -0.47 2000–2003 2.23 2003–2007 -0.28
North 1995–1999 -1.68a 1999–2003 2.70a 2003–2007 0.34
Northeast 1995–2000 -0.63 2000–2004 2.30 2004–2007 -0.40
Southeast 1995–1999 -1.21 1999–2002 2.26 2002–2007 -0.15
South 1995–2007 1.02 a
Central-West 1995–2007 0.63 a
Note: APC, estimated annual percent of change. The joinpoint analysis allowed for up to three joinpoints and is based on LBW rates obtained from the Brazilian Live Births Database (SINASC). Newborns weighing <500 g were excluded from the analyses.
a Signifi cantly different from 0 (p<0.05).
Table 2. Low birth weight rate, percent residual distribution, and mean and standard deviation of the main distribution, live
births reporting coverage, infant mortality and proportion of individuals with less than one year of schooling in fi ve Brazilian regions. Brazil, 2005.
Region
Low birth weight rate
(%)a
Residual distribution
(%)b
Main distribution Mean birth weight (standard
deviation) (g)b
Live births coverage
(%)c
Infant mortality rate (per thousand)d
Proportion of individuals aged 15 or more with
less than one year of schooling (%)e
North 6.79 2.2 3278 (467) 95.12 23.35 13.37
Northeast 7.41 2.6 3287 (477) 85.22 31.61 21.21
Southeast 8.95 3.2 3210 (457) 94.13 14.20 7.90
South 8.44 3.1 3242 (464) 99.31 13.80 7.19
Central-West 7.51 2.7 3257 (457) 96.09 17.83 10.54
Brazil 8.09 2.8 3248 (467) 92.06 21.17 11.91
a LBW rate was obtained from the Brazilian Live Births Database (SINASC). Infants weighing <500 g were excluded from the
analyses.
b Percent residual distribution, mean and standard deviation of the main distribution were estimated using the Wilcox &
Russell method.24
c Ratio between the number of actual and estimated live births. Source: Rede Interagencial de Informações para Saúde.
Indicadores de cobertura. [cited 2010 Jul 15] Available from: http://tabnet.datasus.gov.br/cgi/idb2007/f10.htm
d Source: Rede Interagencial de Informações para Saúde. Indicadores de mortalidade. [cited 2010 Jul 15] Available from:
http://tabnet.datasus.gov.br/cgi/idb2007/c01.htm
e Source: Rede Interagencial de Informações para Saúde. Indicadores socioeconômicos. [cited 2010 Jul 15] Available from:
http://tabnet.datasus.gov.br/cgi/tabcgi.exe?idb2007/b02.def
RO AC AM RR PA AP TO MA PI CE RN PB PE AL SE BA MG ES RJ SP PR SC RS MS MT GO DF 10 20 30 40 50
Infant mortality rate (per thousand)
6 7 8 9 10
Low birth weight rate (%)
RO ACAM RR PA AP TO MA PI CERN PB PE AL SE BA MG ES RJSP PR SC RS MS MT GO DF 6 7 8 9 10
Low birth weight rate (%)
20 30 40 50 60
Cesarean section rate (%)
RO AC AM RR PA AP TO MA PI CE RN PB PE AL SE BA MG ES RJ SP PR SC RS MS MT GO DF 6 7 8 9 10
Low birth weight rate (%)
5 10 15 20 25
Rate of less than 1 year of schooling among those aged 15 and plus (%)
RO AC AM RR PA AP TO MA PI CE RN PB PE AL SE BA MG ES RJ SP PR SC RS MS MT GO DF 6 7 8 9 10
Low birth weight rate (%)
0 1 2 3 4
Number of neonatal intensive care beds per 1000 livebirths
Spearman's rho = -0.4933 P = 0.0089
Spearman's rho = 0.1728 P = 0.3888
Spearman's rho = -0.5037 P = 0.0074
Spearman's rho = 0.4054 P = 0.0359
(D) (C) (B) (A)
a Letters represent Brazilian states.
birth cohort studies from Ribeirão Preto11 and Pelotas3
have also reported increasing LBW rates.
For the entire period studied, LBW rates varied among regions and were lower in less developed (North, Northeast and Central-West) and higher in more devel-oped regions (Southeast and South), sharply contrasting to what was expected. A low LBW rate among less privileged women has also been reported in women of Mexican origin in the US, a phenomenon that cannot be explained by underreporting of live births among these women or their lower preterm birth rate.6 In Portugal,
mean birth weight of white babies was lower than that of term babies of foreign-born African mothers. These differences were attributable to a combination of biologic factors and smoking.8 The paradox of higher
LBW rates in more developed cities has also been previously described in Brazil. LBW rate was higher in Ribeirão Preto than in the less developed city of São Luís in the 1990s.20,21
The explanation for the LBW paradox in Brazil is that low SINASC coverage has been associated with higher underreporting of live births < 1000 g at the limit of viability in less developed regions.13 However, huge
differences in LBW rate between regions showing SINASC coverage rates higher than 90% persist despite increasing reporting over time as shown here. It suggests that underreporting of live births is not the single explanation for the epidemiologic paradox of LBW but other factors may be also involved. High maternal smoking rates, multiple birth rates and high use of assisted reproduction techniques in more devel-oped regions have also been linked to this paradox.20,21
A study conducted in a developed Brazilian region has reported that increased multiple birth rate have contributed to the rise in overall LBW rate.22
The increasing use of medical interventions in more developed settings has also been closely related to increasing LBW rates in Brazil3,17 and elsewhere.9
Possibly high rates of LBW seen in more developed regions not only refl ect high data reliability but also high quality of perinatal care. Improved medical care provided during pregnancy may be allowing the detec-tion of some condidetec-tions such as intrauterine growth restriction and early medical interventions may then take place, rescuing fetuses that otherwise would be born dead but at the same time increasing LBW rate.2,9,19
This fi nding is consistent with that found in our study: a high correlation between the number of neonatal intensive care beds available per 1,000 live births and LBW rate seen in Brazilian states. This phenomenon of decreasing IMRs and increasing LBW and preterm birth rates associated with medical interventions has also been reported in developed countries such as the US and Canada.4,9
Another factor that may explain high LBW rates in more developed Brazilian regions (South and Southeast) is high cesarean section rates. However, in the present study, no linear correlation was found between cesarean section and LBW rate. However, our data suggest that, when cesarean section rates were up to 30%, the higher the cesarean section rate the lower the LBW rate; but, when cesarean section rates were higher, LBW rate tended to increase with increasing cesarean section rates. More developed regions (South and Southeast) showed the highest rates of small preterm babies, esti-mated by the Wilcox-Russell method, the lowest mean birth weights and the lowest proportions of individuals aged 15 and plus with very low schooling. These regions also had the highest SINASC coverage rates. Moreover, states in these regions had the highest LBW rates and lowest IMRs. The correlation between LBW rate and IMR was negative, which is in contrast to what was expected. This ecologic dissociation between LBW rate and IMR may be refl ecting improved medical inter-ventions in more developed states. These interinter-ventions are associated with increased LBW rate and decreased IMR. Decreasing IMR in Brazil has been reported to be more related to a reduction in birth weight-specifi c mortality rates than to a decrease in LBW rate.3,7
The epidemiologic paradox of LBW being higher in more developed regions does not seem to refl ect an unfavorable health situation and to be related only to reporting or data collection artifacts associated with low SINASC coverage in less developed regions. Despite the socioeconomic growth seen in Brazil in the last two decades, LBW rate is increasing in some regions whereas IMR continues to decline. This ecological dissociation between LBW rate and IMR suggests that LBW rate can no longer be systematically considered an indicator of socioeconomic well-being. It seems that LBW rate is nowadays more associated with access to and availability of perinatal technologies than with underlying socioeconomic conditions. If this is the case, the high LBW rates seen in more developed regions do not constitute a paradox but do refl ect improved medical care as measured by decreasing IMRs.
The present study has some limitations. Since under-reporting of stillbirths is estimated to be as high as 20% in less developed Brazilian regions, data on stillbirths were not presented. The use of indirect methods to estimate IMR is another limitation. They are useful approaches but rely on assumptions that may not be always true.j Moreover, ecologic analysis is subject to
ecologic fallacy. Higher availability of neonatal inten-sive care beds per 1,000 live births was assumed to result in high LBW rates but the possibility of reverse causality – high LBW rates demanding higher avail-ability of neonatal intensive care units – cannot be
completely ruled out. SINASC coverage in the North and Northeast reached 80% only from 2001 onwards thus trend analysis for these two regions are subject to bias. It is possible that before when SINASC coverage was lower than 80%, underreporting of live births was higher than in recent years.1,13
The joinpoint analysis of LBW rate trends allows the user to “systematically” interpret changes over time and, more importantly, to determine whether these changes are statistically signifi cant. Joinpoint analysis allowed statistical testing of the direction and magnitude of LBW trends in Brazilian regions with the detection of some signifi cant changes. It can provide a much clear
picture of what is happening during a certain period of time in specifi c terms (by identifying the years when there were signifi cant changes in trends) than a single summary trend statistical analysis.
1. Andrade CLTd, Szwarcwald CL, Castilho EAd. Baixo peso ao nascer no Brasil de acordo com as informações sobre nascidos vivos do Ministério da Saúde, 2005. Cad Saude Publica. 2008;24(11):2564-72. DOI:10.1590/S0102-311X2008001100011
2. Aragao VM, Barbieri MA, Silva AA, Bettiol H, Ribeiro VS. Risk factors for intrauterine growth restriction: a comparison between two Brazilian cities. Pediatr Res. 2005;57(5 Pt 1):674-9.
3. Barros FC, Victora CG, Barros AJ, Santos IS, Albernaz E, Matijasevich A, et al. The challenge of reducing neonatal mortality in middle-income countries: fi ndings from three Brazilian birth cohorts in 1982, 1993, and 2004. Lancet. 2005;365(9462):847-54. DOI:10.1016/S0140-6736(05)71042-4
4. Centers for Disease Control and Prevention. Infant mortality and low birth weight among black and white infants-United States, 1980-2000. MMWR Morb Mortal Wkly Rep. 2002;51(27):589-92.
5. Cleveland WS. Robust Locally Weighted Regression and Smoothing Scatterplots. J Am Stat Assoc. 1979;74(368):829-36. DOI:10.2307/2286407
6. Fuentes-Affl ick E, Hessol NA, Perez-Stable EJ. Testing the epidemiologic paradox of low birth weight in Latinos. Arch Pediatr Adolesc Med. 1999;153(2):147-53.
7. Goldani MZ, Barbieri MA, Rona RJ, Da Silva AA, Bettiol H. Increasing pre-term and low-birth-weight rates over time and their impact on infant mortality in south-east Brazil. J Biosoc Sci. 2004;36(2):177-88. DOI:10.1017/S0021932003006175
8. Harding S, Santana P, Cruickshank JK, Boroujerdi M. Birth weights of black African babies of migrant and nonmigrant mothers compared with those of babies of European mothers in Portugal. Ann Epidemiol. 2006;16(7):572-9. DOI:10.1016/j. annepidem.2005.10.005
9. Joseph KS, Demissie K, Kramer MS. Obstetric intervention, stillbirth, and preterm birth. Semin Perinatol. 2002;26(4):250-9. DOI:10.1053/ sper.2002.34769
10. Kim HJ, Fay MP, Feuer EJ, Midthune DN. Permutation tests for joinpoint regression with applications to cancer rates. Stat Med. 2000;19(3):335-51. DOI:10.1002/(SICI)1097-0258(20000215)19:3<335::AID-SIM336>3.0.CO;2-Z
11. Lamy Filho F, Assuncao Jr AN, Silva AA, Lamy ZC, Barbieri MA, Bettiol H. Social inequality and perinatal health: comparison of three Brazilian cohorts. Braz J Med Biol Res. 2007;40(9):1177-86. DOI:S0100-879X2006005000154
12. Laurenti R. Resultados e ações apontadas pela Investigação Interamericana de Mortalidade na Infância no Brasil. Bol Of Sanit Panam. 1977;82(4):344-60.
13. Mello-Jorge MHP, Gotlieb SLD, Laurenti R. Análise por grupo de população. In: Mello-Jorge MHP, Gotlieb SLD, Laurenti R, editors. A saúde no Brasil: análise do período 1996 a 1999. Brasília: Parma; 2001. p. 63-9.
14. Nunes RM. Estudo e ações sobre reprodução humana e nutrição em Recife. Bol Of Sanit Panam. 1976;81(4):304-10.
15. Puffer RR, Serrano CV. Patterns of mortality in childhood: report of the Inter-American Investigation of Mortality in Childhood. Washington: Pan American Health Organization; 1973. (Scientifi c Publication, 262)
16. Puffer RR, Serrano CV. Patterns of birthweights. Washington, D.C.: Pan American Health Organization; 1987. (Scientifi c Publication, 504)
17. Silva AA, Barbieri MA, Gomes UA, Bettiol H. Trends in low birth weight: a comparison of two birth cohorts separated by a 15-year interval in Ribeirao Preto, Brazil. Bull World Health Organ. 1998;76(1):73-84.
18. Silva AA, Ribeiro VS, Borba Jr AF, Coimbra LC, Silva RA. Avaliação da qualidade dos dados do sistema de informações sobre nascidos vivos em 1997 - 1998. Rev Saude Publica. 2001;35(6):508-14. DOI:S0034-89102001000600003
19. Silva AA, Bettiol H, Barbieri MA, Ribeiro VS, Aragao VM, Brito LG, et al. Infant mortality and low birth weight in cities of Northeastern and Southeastern Brazil. Rev Saude Publica. 2003;37(6):693-8. DOI:10.1590/S0034-89102003000600002
20. Silva AA, Bettiol H, Barbieri MA, Pereira MM, Brito LG, Ribeiro VS, et al. Why are the low birthweight rates in Brazil higher in richer than in poorer municipalities? Exploring the epidemiological paradox of low birthweight. Paediatr Perinat Epidemiol. 2005;19(1):43-9. DOI:10.1111/j.1365-3016.2004.00624.x
21. Silva AA, Bettiol H, Barbieri MA, Brito LG, Pereira MM, Aragao VM, et al. Which factors could explain the low birth weight paradox? Rev Saude Publica. 2006;40(4):648-55. DOI:S0034-89102006000500014
22. Silva CH, Goldani MZ, Silva AA, Agranonik M, Bettiol H, Barbieri MA, et al. The rise of multiple births in Brazil. Acta Paediatr. 2008;97(8):1019-23. DOI:10.1111/j.1651-2227.2008.00791.x
23. Theme-Filha MM, Gama SGN, Cunha CB, Leal MC. Confi abilidade do Sistema de Informações sobre Nascidos Vivos Hospitalares no município do Rio de Janeiro, 1999-2001. Cad Saude Publica. 2004;20 (Suppl 1)S83-S91. DOI:10.1590/S0102-311X2004000700009
24. Wilcox AJ. On the importance-and the unimportance--of birthweight. Int J Epidemiol. 2001;30(6):1233-41. DOI:10.1093/ije/30.6.1233
REFERENCES
Research supported by Conselho Nacional de Desenvolvimento Científi co e Tecnológico (CNPq – Process N. 403151/2004-0).