Regina BernalI
Nilza Nunes da SilvaII
I Programa de Pós-Graduação em Saúde Pública. Faculdade de Saúde Pública. Universidade de São Paulo (FSP-USP). São Paulo, SP, Brasil
II Departamento de Epidemiologia. FSP-USP. São Paulo, SP, Brasil
Correspondence: Regina Tomie Ivata Bernal R. Geraldo Amorim, 257 05594-110 São Paulo, SP, Brasil E-mail: [email protected] Received: 04/20/2008 Revised: 08/22/2008 Approved: 09/23/2008
Home landline telephone
coverage and potential bias in
epidemiological surveys
ABSTRACT
OBJECTIVE: To estimate landline telephone coverage effects on potential information bias in epidemiological surveys.
METHODS: Databases of the Pesquisa Nacional por Amostra de Domicílios (PNAD – National Household Sample Survey), from 1998 to 2003, were used to estimate landline telephone coverage rates in the fi ve Brazilian geographic regions. Multiple regression analysis was used to identify factors associated with owning a landline telephone. Bias impact on 95% confi dence intervals was assessed, according to the accuracy achieved in each situation.
RESULTS: In the Southern and Central-west metropolitan regions, with 70% coverage or more, associated bias was considered insignifi cant. In the remaining regions, related bias was above the acceptable limit (0.4), indicating possible errors in inferences drawn with a 95% confi dence interval. Likelihood of access to a home landline telephone was greater among the white population with higher level of education.
CONCLUSIONS: Findings reveal that the use of residential telephone records is indicated to conduct epidemiological surveys in Brazilian states where coverage is above 70% exclusively. Specifi c methodologies to treat estimates obtained in regions with lower rates need to be analyzed and published.
DESCRIPTORS: Epidemiological Surveys. Coverage bias. Vigitel. Telephone Surveys.
INTRODUCTION
In Brazil, researchers have shown a growing interest in residential landline telephone use to perform epidemiological studies. Existing scientifi c produc-tion argues that defi ning the frame is one of the main issues associated with the sample design.2,3,4,a In general, population surveys use subscriber telephone directories to select samples of homes with home telephones. Among the proble-ms resulting from this practice is the lack of updated information, causing the need, in the majority of studies, to compensate this with a search for telephone lines via internet, available on the corresponding telephone company’s websi-te. However, the response rates obtained (over 60%) stimulate the use of this strategy to conduct more time and cost effi cient surveys, enabling a reduction in interview costs and deadlines.
In Brazil, the Ministry of Health Department of Health Surveillance (SVS/ MS) has been developing the Sistema de Vigilância de Fatores de Risco para
Doenças Crônicas por Inquérito Telefônico (VIGITEL – Surveillance of risk-factor for chronic diseases throu-gh telephone interviews) since 2003.5,a This survey is conducted annually, enabling changes in the Brazilian population’s habits and behavior to be followed. Ho-wever, it is necessary to analyze specifi c methodologies for questions such as: coverage, response rate and effi -ciency (related to post-stratifi cation weights to correct bias in the estimates of variables of interest).
The present study aimed to estimate the effect of home landline telephone coverage rates on potential informa-tion bias in epidemiological surveys.
METHODS
Databases from the Pesquisa Nacional por Amostra de Domicílios (PNAD – National Household Sample Survey) of the Instituto Brasileiro de Geografi a e Estatística (IBGE – Brazilian Institute of Geography and Statistics) were used between 1998-9 and 2001-3 to estimate home landline telephone coverage rates in Brazil.b This survey is conducted annually using a process of random selection of a probabilistic sample of homes on the national level, except for the Northern region’s rural area. The PNAD adopts the Plano Com-plexo de Amostragem (PCA – Complex Sampling Plan), which involves the geographic stratifi cation of conglo-merates with one, two or three selection stages.7
The Brazilian territory was divided into 36 strata, comprised as follows: 17 in the federation units (states of Rondônia, Acre, Amazonas, Roraima, Amapá, To-cantins, Maranhão, Piauí, Rio Grande do Norte, Pará, Alagoas, Sergipe, Espírito Santo, Santa Catarina, Mato Grosso, Mato Grosso do Sul and Goiás) and the capital and the Federal District comprise 18 independent strata; and the remaining federation units (states of Pará, Cea-rá, Pernambuco, Bahia, Minas Gerais, Rio de Janeiro, São Paulo, Paraná and Rio Grande do Sul) form two strata, one with the metropolitan regions (nine strata) and another with the remaining cities (nine strata), thus comprising the other 18 strata. The variables that defi ned the sampling plan design were considered in the analysis, known as stratum, primary sampling unit and sampling weight. Statistical analyses were performed with Stata software, version 8.0, where the SVY modu-le, suitable for obtaining unbiased estimates with data coming from complex sampling plans, was used.
Home landline telephone coverage rate for each year defined was estimated using the expression
a Ministério da Saúde. Vigitel Brasil 2006: Vigilância de fatores de risco e proteção de doenças crônicas por inquérito telefônico: estimativas sobre freqüência e distribuição sócio-demográfi ca de fatores de risco e proteção para doenças crônicas nas capitais dos 26 estados brasileiros e no Distrito Federal em 2006. Brasília; 2007.
b Instituto Brasileiro de Geografi a e Estatística. Microdados da Pesquisa Nacional por Amostra de Domicílios-1998 a 2003. Rio de Janeiro; 2003. c Paula GA. Modelos de Regressão com apoio computacional [tese de doutorado]. São Paulo: Instituto de Matemática e Estatística da USP; 2004. where yhαβ is the variable’s
obser-vable value (1 if owning a landline telephone, and 0 if not) of the β home, of the αprimary sampling unit; of the h stratum; xhαβ equals 1for all β homes observed in
the αprimary sampling unit, of the h stratum; ,
Each home’s weight is obtained from each h stratum’s inverted sampling fraction.
Confi dence intervals for coverage rates were estima-ted using the expression , where
As regards home landline telephone user profi le, in each geographic region, interviewees aged 18 or older were previously divided into two mutually exclusive groups, containing only those living in homes with or without a home landline telephone. By using the
multiple
lo-gistic regression analysis,c where π(x) is the home landline telephone access probability according to the (xi) variables, eight sociodemographic characteristics were defi ned (Table 1). Criteria for the fi nal inclusion of these variables in the model followed the stepwise technique, considering the 5% signifi cance level.
To estimate potential bias associated with lack of home landline telephone coverage, 2003 PNAD data, which brought health characteristics as an additional theme, were used to obtain prevalence estimates of chronic diseases in the population aged 40 years or older, living in the areas studied. Thus, interviewees were separa-ted into two strata: those who own a home landline telephone and those who do not own it. Individuals who had the diagnosis of at least one of the following conditions confi rmed by a doctor or health professional were considered to have chronic diseases: spine or back diseases, arthritis or rheumatism, diabetes, bronchitis or asthma, heart diseases or hypertension.
Potential bias due to low coverage rates was estimated
using the expression where
the numerator is the absolute value calculated for the
bias resulting from the difference
landline telephone who comprised the second stratum. Values above 0.40 for relative bias changed the 95% level initially established for confidence intervals (Cochran 1997),1 which may cause wrong inferences to be drawn.
RESULTS
Results obtained showed a 50% growth in the number of homes covered by landline telephones in Brazil, be-tween 1998 and 2003 (Figure 1). However, this change did not occur uniformly in the country. In the Northern, Northeast and Central-west regions, proportions of home landline telephones increased 26%, 36% and 22% respectively, whereas in the Southeast and Southern regions, they increased 58% and 56% respectively. Despite this growth, in 2003, the average rate of homes covered by landline telephones was 50.3%, showing that the Northern (41%) and Northeast regions (39%) were below average, unlike the Southeast (60%), Sou-thern (63%) and Central-west regions (55%).
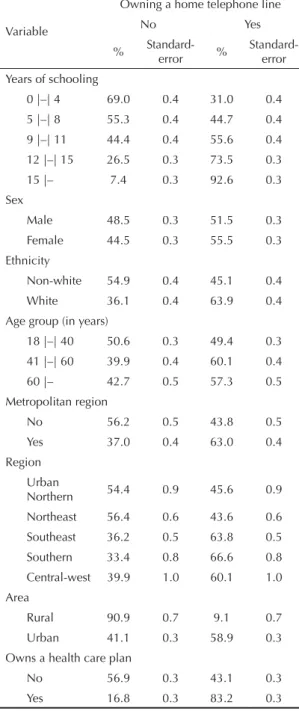
In addition, the proportion of adults living in homes without landline telephones was greater in rural areas and non-metropolitan regions (Table 1). Adults who reported not to be white showed greater proportion of lack of landline telephone access than self-reported white people. The number of adults without a home landline telephone was inversely proportional to the number of years of schooling.
Estimates obtained with the adjusted regression model pointed to associations among home landline telephone
access, sociodemographic characteristics and geogra-phic region (Table 2). The negative model constant meant low probability of an individual owning a home landline telephone. However, factors such as level of education, ethnicity, owning at least one health care plan, metropolitan region and home’s urban or rural area were positively associated with landline telephone
Source: Instituto Brasileiro de Geografi a e Estatística
(IBGE – Brazilian Institute of Geography and Statistics). Micro data from the Pesquisa Nacional por Amostra de Domicílios -1998 to 2003 (PNAD – National Household Sample Survey). City of Rio de Janeiro, 2003.
Figure 1. Progress of coverage of homes with telephone lines per region. Brazil, 1998-2003.
20 30 40 50 60 70
1998 1999 2001 2002 2003 %
Ano Northern
Northeast
Southeast Southern
Center-west
Brazil
Table 1. Sociodemographic characteristics of adults living in homes, according to ownership of a home telephone line. Brazil, 1998-2003.
Variable
Owning a home telephone line
No Yes
%
Standard-error %
Standard-error
Years of schooling
0 |–| 4 69.0 0.4 31.0 0.4
5 |–| 8 55.3 0.4 44.7 0.4
9 |–| 11 44.4 0.4 55.6 0.4
12 |–| 15 26.5 0.3 73.5 0.3
15 |– 7.4 0.3 92.6 0.3
Sex
Male 48.5 0.3 51.5 0.3
Female 44.5 0.3 55.5 0.3
Ethnicity
Non-white 54.9 0.4 45.1 0.4
White 36.1 0.4 63.9 0.4
Age group (in years)
18 |–| 40 50.6 0.3 49.4 0.3
41 |–| 60 39.9 0.4 60.1 0.4
60 |– 42.7 0.5 57.3 0.5
Metropolitan region
No 56.2 0.5 43.8 0.5
Yes 37.0 0.4 63.0 0.4
Region Urban
Northern 54.4 0.9 45.6 0.9
Northeast 56.4 0.6 43.6 0.6
Southeast 36.2 0.5 63.8 0.5
Southern 33.4 0.8 66.6 0.8
Central-west 39.9 1.0 60.1 1.0
Area
Rural 90.9 0.7 9.1 0.7
Urban 41.1 0.3 58.9 0.3
Owns a health care plan
No 56.9 0.3 43.1 0.3
Yes 16.8 0.3 83.2 0.3
Source: Instituto Brasileiro de Geografi a e Estatística (IBGE
access. Figure 2 shows the graphs with probabilities of owning a home landline telephone according to the ethnicity and level of education variables. The pro-bability of owning a home landline telephone among white adults with fewer than fi ve years of schooling was found to be below 50%, whereas self-reported non-white adults needed at least ten years of schooling to reach this same probability.
Estimates of prevalence of chronic diseases in in-dividuals aged 40 years or older showed signifi cant relative bias. Relative bias introduced by low coverage rates according to region were found to have different behavior, shown on Table 3. The Northern region and Central-west, Northeast and Southeast non-metropo-litan regions, with home landline telephone coverage rates below 60%, showed relative bias above 1, thus reducing the pre-established 95% confi dence level to 83%. In the Northeast metropolitan region, this chan-ge was found to reach about 90%. In the Southeast,
Southern and Central-west metropolitan regions, with coverage rates above 70%, associated bias was consi-dered insignifi cant.
DISCUSSION
During the period studied, growth in home landline te-lephone coverage rates was found in Brazil, with higher indices for the Southern and Southeast metropolitan regions, though reaching mean coverage below 60% in 2003. In this way, Brazil is far distant from the coverage rates found in developed countries that use home landli-ne telepholandli-nes to conduct epidemiological surveys.2,3
Since 1987, problems associated with the exclusion of homes without telephone line access have been an object of study for publications and international scientifi c meetings aimed at the area of statistical me-thodology. According to Groves et al2 (2001), errors
Table 2. Estimates of parameters associated with the logistic model per country region. Brazil, 1998-2003.
Region Variable Estimate Standard-error t P>|t|
Northern Constant -1.355 0.056 -24.250 0.000
Years of schooling 0.105 0.005 20.190 0.000
White skin color 0.316 0.041 7.640 0.000
Owns a health care plan 1.270 0.057 22.090 0.000
Northeastern Constant -4.106 0.147 -27.950 0.000
Years of schooling 0.139 0.003 44.290 0.000
White skin color 0.189 0.030 6.310 0.000
Owns a health care plan 1.430 0.041 34.800 0.000
Urban area 2.691 0.149 18.070 0.000
Southeast Constant -2.956 0.125 -23.580 0.000
Years of schooling 0.112 0.031 36.250 0.000
White skin color 0.391 0.029 13.620 0.000
Owns a health care plan 1.293 0.035 36.830 0.000
Metropolitan region 0.445 0.043 10.380 0.000
Urban area 2.061 0.127 16.280 0.000
Southern Constant -2.581 0.137 -18.520 0.000
Years of schooling 0.133 0.005 25.110 0.000
White skin color 0.383 0.051 7.510 0.000
Owns a health care plan 1.061 0.046 22.980 0.000
Metropolitan region 0.179 0.061 2.950 0.000
Urban area 1.824 0.127 14.410 0.000
Central-west Constant -3.189 0.199 -15.960 0.000
Years of schooling 0.109 0.005 21.560 0.000
White skin color 0.360 0.041 8.870 0.000
Owns a health care plan 1.153 0.061 18.810 0.000
Metropolitan region 0.730 0.087 8.350 0.000
Urban area 2.319 0.205 11.290 0.000
caused by the exclusion of homes without a telephone line or with a telephone number unavailable in the telephone company’s records are not insignifi cant. To compensate the exclusion of this population, adjusting the distribution of the sample with a telephone to the total population composition, according to characte-ristics associated to owning a telephone line and using weighting methods, has become a common practice. In this way, bias potentially associated with inferences drawn is expected to be reduced. In this study, after weighting the sample, it was observed that level of education, ethnicity and head of family owning a health care plan were associated with owning a telephone line in the urban Northern region. In the Northeast region, the same characteristics previously mentioned and the urban area variable were observed. In the Southeast, Southern and Central-west regions, all these characte-ristics were present, though differing in terms of the metropolitan region variable.
However, the Southern non-metropolitan region, with 60% of homes served by a telephone line, showed lower relative bias. Such result is caused by small differences between the prevalences of chronic diseases estimated for the strata with and without a home landline telepho-ne. Moreover, this result emphasizes the importance that specifi c methodologies to treat estimates obtained in locations with lower indices should be studied and published in Brazilian scientifi c journals preferably.
The existence of a subgroup of the population living in homes not served by a telephone line, as well as their sociodemographic characteristics and geographic loca-tion, is a source of error associated with the exclusion of such homes, which may change the pre-established confi dence level for the estimates to be obtained. Thus,
low home telephone line coverage rates can result in biased estimates not corresponding to the realities studied.
Results from this study indicate that the use of home te-lephone line records to conduct interviews in sampling surveys is only reliable for Brazilian regions with home landline telephone coverage rates above 70%.
Brazilian studies on alternative methodologies for the use of telephone surveys in areas with low home telephone line coverage should be the object of epide-miological research.
Table 3. Coverage rates and relative bias of prevalences estimated for chronic diseases in adults aged 40 years and older, according to region. Brazil, 1998-2003
Region Telephone line
coverage rate (%)
Relative bias
Central-west MR 85.2 0.2110
Southeast MR 77.6 0.0751
Southern MR 76.3 0.2363
Northeast MR 62.9 0.5598
Southern NMR 59.7 0.0172
Southeast NMR 59.7 1.6372
Central-west NMR 56.0 1.0456
Northern 47.7 1.0552
Northeast NMR 28.0 2.3365
MR: Metropolitan region NMR: Non-metropolitan region
Source: Instituto Brasileiro de Geografi a e Estatística (IBGE
– Brazilian Institute of Geography and Statistics). Micro data from the Pesquisa Nacional por Amostra de Domicílios-1998 to 2003 (PNAD – National Household Sample Survey). City of Rio de Janeiro, 2003.
Source: Instituto Brasileiro de Geografi a e Estatística (IBGE – Brazilian Institute of Geography and Statistics). Micro data from the Pesquisa Nacional por Amostra de Domicílios -1998 to 2003 (PNAD – National Household Sample Survey). City of Rio de Janeiro, 2003
Figure 2. Probability of owning a home telephone line, according to ethnicity and number of years of schooling. Brazil, 1998-2003.
Owns a telephone
Does not own a telephone
0
.25
.5
.75
0 5 10 15
Years of schooling
White individuals Non-white individuals
Owns a telephone
Does not own a telephone
0
.25
.5
.75
0 5 10 15
Years of schooling
1. Cochran WG. Sampling Techiques. 3. ed. New York: John Wiley & Sons; 1977. p.14.
2. Groves RM, Biemer PP, Lyberg LE, Massey JT, Nicholls II WL, Waksberg J. Telephone Survey Methodology. New York: John Wiley & Sons; 2001.
3. Kalton G. Introduction to Survey Sampling. Newbury Park: SAGE Publications Inc; 1987.
4. Kish L. Survey sampling. New York: John Wiley & Sons; 1965.
5. Monteiro CA, Moura EC, Jaime PC, Lucca A, Florindo AA, Figueiredo ICR, et al. Monitoramento de fatores de risco para doenças crônicas por entrevistas telefônicas.
Rev Saude Publica. 2005;39(1):47-57. DOI: 10.1590/ S0034-89102005000100007
6. Silva NN. Amostragem Probabilística. 2. ed. São Paulo: EDUSP; 2000.
7. Silva PLN, Pessoa DGC, Lila MF. Análise estatística de dados da PNAD: incorporando a estrutura do plano amostral. Cienc Saude Coletiva. 2002;7(4):639-70. DOI: 10.1590/S1413-81232002000400005
REFERENCES