Neuber José SegriI
Chester Luiz Galvão CesarI Marilisa Berti de Azevedo BarrosII
Maria Cecilia Goi Porto AlvesIII Luana CarandinaIV
Moisés GoldbaumV
I Departamento de Epidemiologia. Faculdade de Saúde Pública. Universidade de São Paulo (USP). São Paulo, SP, Brasil II Departamento de Medicina Preventiva e
Social. Faculdade de Ciências Médicas. Universidade Estadual de Campinas. Campinas, SP, Brasil
III Instituto de Saúde. Secretaria de Estado da Saúde. São Paulo, SP, Brasil
IV Departamento de Saúde Pública. Faculdade de Medicina de Botucatu. Universidade Estadual Paulista. Botucatu, SP, Brasil V Departamento de Medicina Preventiva.
Faculdade de Medicina. USP. São Paulo, SP, Brasil
Correspondence: Neuber José Segri
Av. Dr. Arnaldo, 715 – Cerqueira Cesar 01246-904 São Paulo, SP, Brasil E-mail: [email protected] Received: 4/22/2009 Approved: 12/4/2009
Article available from www.scielo.br/rsp
Health survey: comparison
of interviewees according to
ownership of a residential
telephone line
ABSTRACT
OBJECTIVE: To analyze differences in sociodemographic characteristics associated with health in individuals with and without a residential telephone line.
METHODS: Data from the ISA-Capital 2003 (2003 Health Survey), a study performed in the city of São Paulo, Southeastern Brazil, were analyzed. Residents who had a residential telephone line were compared to those who reported not having a telephone line, according to sociodemographic, lifestyle, health status and health service use variables. Bias associated with non-coverage of the population without a telephone line was estimated, decreasing after the use of post-stratifi cation adjustments.
RESULTS: Of all the 1,878 interviewees aged more than 18 years, 80.1% had a residential telephone line. By comparing groups, the main sociodemographic differences among individuals who did not have a residential telephone line were the following: younger age, greater proportion of black and mixed individuals, smaller proportion of married interviewees, and greater proportion of unemployed individuals with a lower level of education. Residents without a residential telephone line had fewer health tests performed and smoked and drank more. In addition, this group took less medication, considered themselves to be in worse health conditions and used the SUS (National Health System) more frequently. When excluding the population without a telephone line from the analysis, estimates of dental consultations, alcoholism, drug use and SUS use to have a Papanicolaou test performed were those showing the highest bias. After post-stratifi cation adjustment, there was a decrease in the bias of estimates for the variables associated with ownership of a residential telephone line.
CONCLUSIONS: The exclusion of residents without a telephone line was one of the main limitations to the studies performed in this way. However, the use of statistical techniques of post-stratifi cation adjustment enables a reduction in non-coverage bias.
DESCRIPTORS: Health Surveys. Morbidity Surveys. Data Collection. Telephone, supply & distribution. Selection Bias. Data Interpretation, Statistical. Sampling Studies.
INTRODUCTION
in the local health units and hospitals. Moreover, they enable the assessment of the equity existing in health care for the population’s health needs.6
Population-based surveys can be performed using face-to-face interviews with respondents or self-administered questionnaires, postal service (letters) or even web-based surveys (emails). Another form to obtain data for a survey is by applying a questionnaire to the individuals selected or their proxies, who answer questions by telephone in their own homes.
One of the main advantages of telephone interviews, when compared to home interviews, is the opportunity to monitor and control the quality of data as they are collected.13 Another great advantage is the capacity to generate fast results, due to the speed to obtain and process data.17
However, the main disadvantage of telephone surveys is the limited coverage of respondents, because only individuals with residential telephone lines can be contacted, thus restricting the target population, which may cause bias in the study results.
In 2003, in a telephone survey performed to monitor risk factors of chronic diseases in the city of São Paulo, Southeastern Brazil, (SIMTEL), Monteiro et al16 (2005) concluded that this method produced reliable estimates, proving to be adequate. However, the results obtained by the authors were associated with an estimated cove-rage rate of 84.9% and it was not possible to discuss the differences between the populations with and without a residential telephone line in the city of São Paulo.
From the moment telephone interviews began to be used more frequently, there has been a concern to compare results from household surveys with those of telephone surveys, especially to fi nd out the conse-quences that the exclusion of residents without a resi-dential telephone line could cause.9,11 However, such comparisons are an almost unexplored issue in Brazil, and very little is known about the differences between interviewees who have a residential telephone line and those who do not.
The objective of the present study was to analyze the differences in sociodemographic and health characte-ristics among individuals with and without a residential telephone line.
METHODS
Data from the Inquérito de Saúde no Município de São Paulo, SP (ISA-Capital 2003 – City of São Paulo
2003 Health Survey) were used, a cross-sectional study that aimed to analyze life and health conditions of the population and use of health services using face-to-face interviews, with a methodology and questionnaire that were similar to the ISA-SPa conducted in the previous year.
In the ISA-Capital 2003 survey, a total of 3,357 indi-viduals were interviewed in 2003, randomly selected by two-stage (census tract and household) cluster sampling. A minimum sample size of 420 individuals for each domain of age and sex (younger than one year; one to 11 years; 20 to 59 years, male and female; and 60 years or older, male or female), based on the estimate of prevalence of 50%, 95% confi dence level, sampling error of 0.06, and design effect of 1.5, in addition to possible losses.b
Information was obtained from a questionnaire, which was structured in sections, applied by qualifi ed inter-viewers and directly responded by selected residents.
Individuals aged 18 years or older were compared, according to ownership of a residential telephone line, according to the following variables:
• sociodemographic variables: sex, age, place of birth, ethnic group, religion, marital status, level of education of head of family, paid work, per capita income and characteristic of dwelling (defi ned as adequate, when the dwelling was a house or apart-ment with water supply and sewage system and it also had indoor sanitation and electric lighting);
• lifestyle variables: Body Mass Index (BMI), smoking and alcoholism, using the CAGE
classi-fi cation (positive or negative);14
• morbidity variables: presence of chronic diseases (hypertension and diabetes), presence of physical impairment, occurrence of accidents and/or violence in the 12 months prior to interview, morbi-dity reported in the 15 days prior to interview and self-rated health;
• use of services: search for health services in the absence of morbid events, hospitalization in the 15 days prior to interview, type of health service sought, Sistema Único de Saúde (SUS – National Health System) coverage for mammograms, Papanicolaou tests, prostate exams, dental consul-tations and use of medication three days prior to interview.
The existence of an association between variables of interest and ownership of a residential telephone line
a César CLG, Barros MBA, Alves MCGP, Carandina L, Goldbaum M. Saúde e condição de vida em São Paulo - Inquérito Multicêntrico de Saúde no Estado de São Paulo - ISA-SP. São Paulo: Faculdade de Saúde Pública da USP; 2005.
was analyzed to compare the two groups, with and without a telephone line, using Pearson’s chi-square test and considering statistically signifi cant associations with a p-value < 0.05.
In order to evaluate the effect non-coverage of homes without a telephone line would have on survey estimates, non-coverage bias and bias ratio were analyzed for the variables associated with ownership of telephone.1,3,7,12,18
Bias (b) is the result obtained by multiplying the propor-tion of the populapropor-tion without a residential telephone line by the difference between groups with and without a telephone line, according to the following equation:
For the “lifestyle“, “health status” and “use of health services” variables, associated with ownership of a telephone line, non-coverage bias was estimated according to the following equation, equivalent to the previous one:, b = pwith telefone – ptotal, where pwith telefone is the estimate of proportion of the population with a telephone line in the sample and ptotal is the estimate of the proportion of the total population (total sample with and without a telephone).
The bias ratio (br), which enables the measurement of potential changes in the level of confi dence intervals caused by the presence of bias, was estimated by the equation , where se = (pwith telefone) is the standard error, thus expressed:
In the present study, values higher than 0.40 for the bias ratio were considered to change the level of confi dence intervals.1,3,7
It was also verifi ed if bias decreased with the use of post-stratifi cation adjustments, according to socio-demographic variables.5 To achieve this, weights were calculated, whose application enables the socio-demographic composition of the sample of population with a residential telephone line to be equal to that of the total sample of the ISA-Capital 2003 survey.
The same variables used by the Sistema de Vigilância de Fatores de Risco e Proteção para Doenças Crônicas por Inquérito Telefônico (VIGITEL – Telephone-based Surveillance of Risk and Protective Factors for Chronic Diseases)c were considered for post-stratification adjustment: sex, age divided into six groups (18 to 24, 25 to 34, 35 to 44, 45 to 54, 55 to 64 and 65 years and older) and level of education on three levels (zero
to eight, nine to 11, and 12 and more years of study), totaling 36 sociodemographic strata.
After adjustments, both the proportions of interest for the population with a residential telephone line and non-coverage bias were estimated again. These new estimates and bias ratio were compared to the previous ones to evaluate the post-stratifi cation effect.
STATA 9.2 survey package was used to analyze data, considering the aspects of the complex sampling design.
RESULTS
Of a total of 3,357 individuals interviewed, 3,333 answered the same question about ownership of a residential telephone line in their home. Of these, 1,860 were 18 years of age or older and 80.1% (1,486) of them reported owning a telephone line in 2003 in their home.
According to Table 1, a statistically signifi cant diffe-rence was found in all variables analyzed, except for sex (p=0.898). In the population without a telephone line, there was a higher proportion of individuals who had been born in other states, were non-white and evange-lical, had a lower level of education, were unemployed and lived in “inadequate” homes when compared with respondents with a telephone line.
In terms of age, there was also a statistically
signi-fi cant difference between groups (p<0.001). In the group with a telephone line, mean age was higher (41.6 years against 35.6 years in the group without a telephone line).
Considering income in minimum wages, residents without a telephone line had the lowest incomes. Only 2.5% earned fi ve or more minimum wages and the mean of this group reached only one minimum wage. In contrast, among residents with a telephone line, the mean was signifi cantly higher (3.8 minimum wages) and the percentage of interviewees who earned fi ve or more minimum wages rose to 19.3% (p<0.001).
As regards types of behavior associated with health and the presence of morbidity (Table 2), there was a signifi cant difference between groups in terms of: smoking, alcohol dependence, hypertension and self-rated health.
In terms of the use of medication in the three days prior to the interview, there was also a statistically signifi cant association with the presence of a residential telephone line (p<0.001). Only 34.2% of interviewees who did not own a telephone reported having used a certain type of
medication, against 51.0% of the group who owned a residential telephone line.
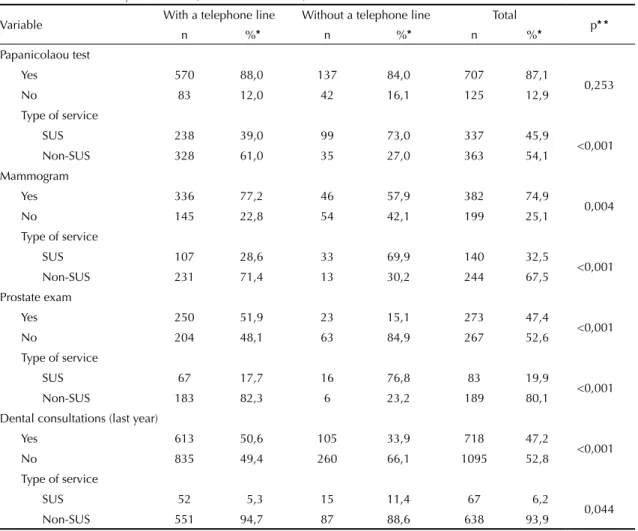
Statistically signifi cant associations were also found between ownership of a telephone line and having pros-tate exams and mammograms performed. In contrast, as regards Papanicolaou tests, there was no statistically signifi cant difference between these groups (Table 3).
Concerning the type of service sought, the three tests assessed (Papanicolaou test, mammogram, prostate exam) showed a statistically significant difference between the groups with and without a telephone line (p<0.001). SUS was responsible for the majority of visits and coverage of expenses of the group without a tele-phone line. Although also using the SUS, the group with a residential telephone line showed a lower percentage.
Table 1. Association between demographic and socioeconomic characteristics, according to the presence of residential telephone
line in the household. City of São Paulo, Southeastern Brazil, 2003.
Variable With a telephone line
Without a telephone
line Total p* *
n %* n %* n %*
Sex
Male 729 45.9 182 45.3 911 45.7
0.898
Female 757 54.1 192 54.7 949 54.3
Place of birth
State of São Paulo 833 62.4 166 46.2 999 59.2
0.001
Outside São Paulo 641 37.6 200 53.8 841 40.8
Ethnic group
White 998 71.1 190 50.5 1188 66.9
<0.001
Black 112 7.8 39 9.9 151 8.2
Mixed 303 19.1 134 39.5 437 23.3
Asian 31 1.9 1 0.0 32 1.5
Indigenous 1 0.1 2 0.1 3 0.1
Religion
Without religion 91 8.6 22 6.1 113 8.1
0.010
Catholic 986 65.8 225 60.7 1211 64.8
Evangelical 231 13.6 97 25.3 328 16.0
Spiritualist 49 5.5 8 2.8 57 4.9
Others 90 6.5 14 5.1 104 6.2
Marital status
Married 694 45.2 97 27.8 791 41.7
<0.001
Cohabitating 129 10.7 72 27.1 201 14.0
Single 360 30.3 91 30.0 451 30.2
Separated 90 6.7 34 7.7 124 6.9
Widowed 199 7.2 75 7.5 274 7.2
Level of education of head of family (years)
0 to 3 314 13.7 140 29.8 454 16.9
<0.001
4 to 7 490 28.6 132 39.9 622 30.9
8 to 11 414 31.5 93 29.5 507 31.1
12 and more 248 26.2 4 0.7 252 21.1
Paid work
Employed 691 61.6 175 62.8 866 61.8
0.014
Unemployed 88 7.7 45 13.7 133 8.9
Other 666 30.7 141 23.5 807 29.3
Characteristics of the household
Adequate 1320 89.1 277 73.7 1597 86.0
0.005
Not adequate 149 10.9 89 26.3 238 14.0
*Weighted sample percentage
Table 2. Association among lifestyle, health state and use of services, according to the presence of residential telephone line in the household. City of São Paulo, Southeastern Brazil, 2003.
Variable With a telephone line Without a telephone line Total p* *
n %* n %* n %*
Smoking
Yes 247 19.3 88 28.6 335 21.2
0.002
No 1192 80.7 274 71.4 1466 78.8
Alcoholism (CAGE)
Positive 52 6.4 34 17.8 86 8.6
0.002
Negative 634 93.6 123 82.3 757 91.4
Body Mass Index
Up to 25 726 57.6 192 62.9 918 58.6
0.157
More than 25 583 42.4 113 37.1 696 41.4
Reported morbidity (15 days)
Yes 373 26.6 127 33.0 500 27.9
0.080
No 1077 73.4 239 67.0 1316 72.1
Hypertension
Yes 399 17.4 83 11.0 482 16.1
0.013
No 1031 82.6 277 89.0 1308 83.9
Diabetes
Yes 136 4.6 33 5.1 169 4.7
0.692
No 1305 95.4 328 94.9 1633 95.3
Physical impairment
Yes 303 15.0 84 17.1 387 15.4
0.318
No 1145 85.0 282 82.9 1427 84.6
Accidents
Yes 97 6.0 31 7.0 128 6.2
0.607
No 1351 94.0 335 93.0 1686 93.8
Violence
Yes 45 4.1 15 4.8 60 4.3
0.664
No 1403 95.9 350 95.2 1753 95.7
Self-rated health
Excellent/ Very good 472 40.0 83 28.9 555 37.7
0.005
Good 822 52.8 223 57.5 1045 53.7
Poor/Very poor 152 7.3 59 13.6 211 8.6
Hospitalization
Yes 133 7.9 37 7.2 170 7.7
0.742
No 1315 92.1 329 92.8 1644 92.3
Use of health service (15 days – absence of morbidity)
Yes 237 14.0 46 9.7 283 13.1
0.096
No 1211 86.0 320 90.3 1531 86.9
Use of medication
Yes 833 51.0 153 34.2 986 47.6
<0.001
No 615 49.0 212 65.8 827 52.5
* Weighted sample percentage
In terms of dental consultations performed, the percen-tage of interviewees who did not have a residential telephone line and consulted a dentist in the year prior to the interview was only 33.9%. On the other hand, this percentage reached 50.6% (p=0.001) in the group with a telephone line.
Table 4 shows bias of estimates related to non-coverage of the population without a telephone line, before and after post-stratifi cation adjustment of variables asso-ciated with ownership of a telephone line. Before adjust-ment, none of the variables obtained a bias ratio below 0.40, a limit considered acceptable for this indicator.
For the estimates in which the bias ratio was higher than 1.0 (prevalence of hypertension, smoking, having a prostate exam performed, self-rated health, use of medication, positive CAGE, having dental consulta-tions performed and use of SUS for mammograms and Papanicolaou tests), levels of confi dence associated with confi dence intervals calculated were lower than 83%.7
After the post-stratification adjustment, however, reductions in the bias ratios were observed in all varia-bles analyzed. The greatest reductions were those in the estimates of use of SUS for dental consultations, Papanicolaou tests and prostate exams, prevalence of hypertension and prostate exams (reductions higher than 50%).
Approximately 25% of variables analyzed showed estimates of bias ratio below 0.40 after adjustment and only the estimate of one of them (prevalence of positive CAGE) remained higher than 1.0.
DISCUSSION
The main differences found among individuals with and without a residential telephone line concerned age (interviewees without a telephone line are younger), place of birth (more than 50% of residents without a telephone line have come from outside the state of São Paulo), ethnic group (almost half of the residents without
Table 3. Association between preventive tests and health services used, according to the presence of a residential telephone
line in the household. City of São Paulo, Southeastern Brazil, 2003.
Variable With a telephone line Without a telephone line Total p* *
n %* n %* n %*
Papanicolaou test
Yes 570 88,0 137 84,0 707 87,1
0,253
No 83 12,0 42 16,1 125 12,9
Type of service
SUS 238 39,0 99 73,0 337 45,9
<0,001
Non-SUS 328 61,0 35 27,0 363 54,1
Mammogram
Yes 336 77,2 46 57,9 382 74,9
0,004
No 145 22,8 54 42,1 199 25,1
Type of service
SUS 107 28,6 33 69,9 140 32,5
<0,001
Non-SUS 231 71,4 13 30,2 244 67,5
Prostate exam
Yes 250 51,9 23 15,1 273 47,4
<0,001
No 204 48,1 63 84,9 267 52,6
Type of service
SUS 67 17,7 16 76,8 83 19,9
<0,001
Non-SUS 183 82,3 6 23,2 189 80,1
Dental consultations (last year)
Yes 613 50,6 105 33,9 718 47,2
<0,001
No 835 49,4 260 66,1 1095 52,8
Type of service
SUS 52 5,3 15 11,4 67 6,2
0,044
Non-SUS 551 94,7 87 88,6 638 93,9
* Weighted sample percentage
a telephone line are black and mixed, whereas this percentage did not reach 30% in the group with a tele-phone line). In addition, as regards marital status, only 27.8% of interviewees without a residential telephone line are married, while a higher percentage (45.2%) was found in the group with a telephone line. In terms of paid work, approximately 13% of the group without a telephone line were unemployed and had a lower level of education (less than 1% in this group had 12 or more years of study), whereas, in the group with a telephone line, there were 7.7% of unemployment and higher level of education (26.2% had 12 or more years of study).
Residents without a telephone line have fewer health tests performed, smoke and drink more (28.6% against 19.3% and 17.8% against 6.4% respectively). In addi-tion, they use less medication (34.2% against 51.0% in the group with a telephone line), considered their own health to be in poorer conditions (13.6% against 7.3%) and use the SUS more frequently.
The results obtained showed that interviewees without a residential telephone line differed in terms of demo-graphic, socioeconomic and geographic aspects. In
particular, lack of a telephone line was more frequent among residents who have lower economic power and less opportunity of access to health services and who used the SUS in their majority.
Performing cross-sectional studies using health surveys is extremely important to public management, although they do not enable cause and effect relationships to be established. Interviews performed by telephone are used as a feasible alternative in terms of time and cost in cross-sectional studies. However, certain authors2,8,15 warn about some population sub-groups showing low residential telephone line coverage, suggesting the incorporation of other ways to collect data.
Bias associated with non-coverage of interviewees without a residential telephone line depends on two factors. One of them refers to the difference between interviewees with and without a telephone line and the other, to the proportion of the population without a telephone line. Thus, as expected,2,4,9 these two factors had an infl uence on bias estimates found in the present study.
Table 4. Estimates of prevalences among residents with a residential telephone line and bias estimates, before and after
post-stratifi cation adjustment. City of São Paulo, Southeastern Brazil, 2003.
Variável
ISA-Capital
result (%)*
With a telephone
line (%)*
(before adjustment)
Bias (before adjustment)
Bias Ratio (before adjustment)
With a telephone
line (%)*
(after adjustment)
Bias (after adjustment)
Bias Ratio (after adjustment)
Decrease in bias
ratio
Dental consultation – use of SUS
6.15 5.26 -0.89 0.70 5.99 -0.16 0.11 84.3%
Prostate exam –
use of SUS 19.87 17.69 -2.18 0.62 18.90 -0.97 0.25 59.1%
Prostate exam 47.40 51.87 4.47 1.22 48.77 1.37 0.37 69.4%
Hypertension 16.11 17.41 1.30 1.05 16.66 0.55 0.45 56.8%
Mammogram 74.86 77.23 2.37 0.76 76.38 1.52 0.48 37.9%
Use of health service - 15 days
13.11 13.98 0.87 0.61 13.79 0.68 0.48 21.5%
Mammogram –
use of SUS 32.53 28.63 -3.90 1.18 30.19 -2.34 0.69 41.3%
Self-assessment of health (poor/ very poor)
8.56 7.27 -1.28 1.17 7.68 -0.88 0.73 37.6%
Dental
consultations 47.21 50.59 3.38 1.43 49.33 2.12 0.93 34.7%
Smoking 21.19 19.33 -1.86 1.18 19.63 -1.56 1.03 12.7%
Use of
medication 47.58 50.97 3.39 1.55 49.74 2.16 1.04 33.3%
Papanicolaou test – Use of SUS
45.88 39.05 -6.83 2.59 42.95 -2.93 1.07 58.6%
Alcoholism
(CAGE +) 8.57 6.43 -2.14 1.50 6.66 -1.91 1.22 18.8%
In the city of São Paulo, the coverage rate of resi-dential telephone lines, which was about 77% at the time of this study (2003) according to the Pesquisa Nacional por Amostra de Domicílio (PNAD – National Household Sample Survey),d contributed to the diffe-rences between estimates for the total population and the group of residents with a telephone line found, thus introducing bias.
Similarly to the results found in the ISA-Capital 2003 in the city of São Paulo, Weeks et al20 (1983) and Ford9 (1998) also concluded that ownership of a residential telephone line increased with age and it was lower among residents with lower level of education and income in the United States. Other similar results, comparable to those of the American study,9 were observed as regards ethnic group, level of education, marital status, health status, prevalence of smoking and prevalence of diabetes. Ford9 (1998) also affi rmed that, when the coverage rate is relatively low (less than 50%), estimates obtained from telephone interviews could be seriously compromised.
Similar results to those obtained in the present study were also found by Marcus et al15 (1986), in the United States. Authors also observed that the group without a residential telephone line reported worse self-rated health and showed a lower average salary and smaller percentage of whites, when compared to the group who owned a telephone line. Another similarity between these studies concerned hospitalization, for which no statistically signifi cant difference between groups was found.
Bernal & Silva3 (2009) also found signifi cant diffe-rences between groups with and without a residential telephone line and their results were comparable to those in this study in terms of level of education, ethnic group, age, self-rated health and prevalence of diabetes.
VIGITEL showed a coverage rate (76.1%) similar to that of the ISA-Capital 2003 for homes served by tele-phone lines in the city of São Paulo and also applies post-stratifi cation adjustments with the purpose of minimizing bias introduced by lack of data from the population without a telephone line. In the United States, using similar procedures, the Behavioral Risk Factor Surveillance System applies post-stratifi cation to produce its results. The main difference is that the American surveillance system replaces level of educa-tion for ethnic group.5
Keeter10 (1995) suggests that certain residents, who own a residential telephone shortly before and who were included in the group without a telephone line in the recent past, could be the basis to characterize the population without a telephone line and even estimate non-coverage bias. This author compared these two groups of the population and detected important simi-larities in sociodemographic variables.
Frankel et al8 (2003) found that residents who recently had their telephone lines cut had a profi le comparable to those who had never had a telephone line at home. In this way, using the estimates of these residents to represent the part of the population without a tele-phone line was important to reduce non-coverage bias in telephone interviews. Reduction in bias was higher in the variables with greater association with ownership of a telephone, which was also analyzed in the present study.
The use of cell phones to perform surveys by telephone has been used in the United States (Blumberg et al4 2006). It is believed that, with the increase in the use of cell phones in recent years, certain residents will tend to replace their residential telephone line for a cell phone, mostly due to economic reasons.10
In Brazil, residents with a poorer socioeconomic profi le purchase a cell phone fi rst, because of its low cost and convenience. In this way, aiming to minimize non-coverage bias, these residents can be interviewed following the advances of research by cell phone or even in their own homes.
Results of the present study showed that the popula-tions with and without a telephone line are different in terms of several characteristics. Such differences, when combined to the coverage rate of residential telephone line in the city of São Paulo, introduced bias in the estimates obtained for the part of the population with a residential telephone line.
As previously stated, the exclusion of residents without a telephone line is one of the main limitations in telephone surveys. However, this obstacle should prevent their performance, once the use of statistical techniques, such as the application of post-stratifi cation adjustments, enables non-coverage bias to be reduced. Finally, it is necessary to consider the fact that surveys performed by telephone can be used not only to quickly identify the population’s heath status, but also to contribute to action planning guidance and new public health policies.
1. Alves MCGP, Silva NN. Métodos de estimação de variância em amostras provenientes de inquéritos domiciliares. Rev Saude Publica. 2007;41(6):938-46. DOI:10.1590/S0034-89102006005000051
2. Anderson JE, Nelson DE, Wilson RW. Telephone coverage and health risks indicators: Data from the National Health Interview Survey. Am J Publ Health.
1998;88(9):1392-95. DOI:10.2105/AJPH.88.9.1392
3. Bernal R, Silva NN. Cobertura de linhas telefônicas residenciais e vícios potenciais em estudos epidemiológicos. Rev Saude Publica.
2009;43(3):421-6. DOI:10.1590/S0034-89102009005000024
4. Blumberg SJ, Luke JV, Cynamon ML. Telephone coverage and health survey estimates: evaluating the need for concern about wireless substitution. Am J Publ Health. 2006;96(5):926-31. DOI:10.2105/ AJPH.2004.057885
5. Centers for Disease Control and Prevention. Behavioral Risk Factor Surveillance System – BRFSS. Operational and User’s Guide. Version 3.0. Atalanta; 2006.
6. Cesar CLG, Tanaka OY. Inquérito domiciliar como instrumento de avaliação de serviços de saúde: um estudo de caso na região sudoeste da área metropolitana de São Paulo, 1989-1990. Cad Saude Publica. 1996;12(Supl 2);59-70. DOI:10.1590/S0102-311X1996000600007
7. Cochran WG. Sample Techniques. New York: John Wills & Sons; 1977.
8. Frankel MR, Srinath KP, Hoaglin DC, Battaglia MP, Smith PJ, Wright RA, et al. Adjustments for non-telephone bias in random-digit-dialling surveys. Statist
Med. 2003;22(9):1661-26. DOI:10.1002/sim.1515
9. Ford ES. Characteristics of Survey Participants with and without a telephone: Findings from the Third National Health and Nutrition Examination Survey. J Clinic Epidemiol. 1998;51(1):55-60. DOI:10.1016/S0895-4356(97)00225-4
10. Keeter S. Estimating telephone noncoverage bias with a telephone survey. Public Opin Q. 1995;59(2);196-217. DOI:10.1086/269469
11. Kempf AM, Remington PL. New challenges for telephone survey research in the twenty-fi rst century. Annu Rev Public Health. 2007;28:113-26. DOI:10.1146/annurev.publhealth.28.021406.144059
12. Kish L. Survey sampling. New York: John Wiley; 1965.
13. Lavrakas PJ. Telephone survey methods. Sampling, selection and supervision. London: Sage Publications; 1990.
14. Mansur J, Capriglione MJ, Monteiro MG, Jorge MR. Detecção Precoce do Alcoolismo em Clínica Médica através do Questionário CAGE. J Bras Psiquiatr.1985;34(1):31-4.
15. Marcus AC, Crane LA. Telephone surveys in public health research. Med Care. 1986;24(2):97-112. DOI:10.1097/00005650-198602000-00002
16. Monteiro CA, Moura EC, Jaime PC, Lucca A, Bernal R, Silva NN, et al. Monitoramento de fatores de risco para doenças crônicas por entrevistas telefônicas.
Rev Saude Publica. 2005;39(1):47-57. DOI:10.1590/ S0034-89102005000100007
17. Rea LM, Parker RA. Designing and conducting survey research. A comprehensive guide. San Francisco: Jossey-Bass Publishers; 1997.
18. Silva NN. Amostragem probabilística: um curso introdutório. 2. ed. São Paulo: EDUSP; 2001.
19. Viacava F. Informações em saúde: a importância dos inquéritos populacionais. Cienc Saude Coletiva. 2002;7(4):607-18. DOI:10.1590/S1413-81232002000400001
20. Weeks MF, Kulka RA, Lessler JT, Whitmore RW. Personal versus telephone surveys for collecting household health data at the local level. Am J Public Health. 1983;73(12):1389-94. DOI:10.2105/ AJPH.73.12.1389
REFERENCES
Article based on the master’s dissertation by NJ Segri, presented to the Programa de Pós-Graduação em Saúde Pública da Faculdade de Saúde Pública, Universidade de São Paulo, in 2008