Alex Antonio FlorindoI Emanuel Péricles SalvadorII Rodrigo Siqueira ReisIII Vanessa Valente GuimarãesI
I Escola de Artes, Ciências e Humanidades. Universidade de São Paulo (USP). São Paulo, SP, Brasil
II Faculdade de Saúde Pública. USP. São Paulo, SP, Brasil
III Universidade Federal do Paraná (UFPR). Pontifícia Universidade Católica do Paraná. Curitiba, PR, Brasil
Correspondence: Alex Antonio Florindo
Escola de Artes, Ciências e Humanidades USP Leste
R. Arlindo Béttio, 1000 Ermelino Matarazzo
03828-000 São Paulo, SP, Brasil E-mail: afl [email protected] Received: 4/22/2010 Approved: 8/25/2010
Article available from: www.scielo.br/rsp
Perception of the environment
and practice of physical
activity by adults in a low
socioeconomic area
ABSTRACT
OBJECTIVE: To analyze the association between practice of physical activity and the perception of the community environment among adults.
METHODS: A cross-sectional study of 890 adults carried out in Ermelino Matarazzo district in São Paulo, Southeastern Brazil, 2007. The dependent variables were the practice of at least 150 minutes per week in leisure time physical activity and walking for commuting. Independent variables concerned the environment, and adjustment variables were sex, age, education and length of time living in the neighborhood.
RESULTS: Variables associated with leisure time physical activity were: invitation from friends/neighbors, the presence of facilities less than ten minutes walking from the house and the absence of bars within ten minutes walking distance of the house. Public safety was associated with walking for commuting.
CONCLUSIONS: To promote physical activity in areas of low socioeconomic status, it is fundamental to invest in public safety and facilities for physical activity, in addition to promoting social support networks.
DESCRIPTORS: Adult. Motor Activity. Leisure Activities. Socioeconomic Factors. Environment and Public Health. Cross-Sectional Studies.
INTRODUCTION
The physical environment greatly infl uences the life style of people and their agency to chose healthy habits. The ecological model proposed by Sallis et al20 showed that the practice of physical activity and the adoption of healthy
diets are complex behaviors and that behavior change also depends on the characteristics of the environment. The model proposes levels of infl uence and interaction between respective aspects, perceptions of the environment and broader aspects such as neighborhood facilities and public policies.
Two reviews found an association between various environmental factors and different types of physical activity.12,18 The positive association of access to
adequate facilities and practice of leisure physical activity was also confi rmed by studies that objectively analyzed the environment.9,15 In addition, adequate
access to recreational areas and open public spaces also increases the likelihood of walking at least 150 minutes per week.5,6,7,11 Yet, these studies were undertaken
The large social inequity in Brazil and other middle-income countries should be considered because it involves the existence of areas with greater vulner-ability that many times have few recreational areas, sidewalks or other community attributes that facilitate the practice of physical activity.
Currently, there is scarce evidence about the relation-ship between environment and physical activity among adult Brazilians, particularly for residents of low socio-economic areas. Therefore the goal of this study was to analyze the association between physical activity and self-reported community environment among adult residents of a low socioeconomic area.
METHODS
This cross-sectional population study was performed in a district of São Paulo municipality, Southeastern Brazil.
The study was carried out in 2007, in Ermelino Matarazzo district, located in the eastern zone, which is the municipality’s most populous region with more than 4 million residents and borders Guarulhos munici-pality. According to 2009 data from the State Data Analysis Foundation (Fundação SEADE), Ermelino Matarazzo has an area of 8.95 km², 143 census sectors and 115,571 residents, with a population density of
approximately 12,900 residents/km2.a According to
2000 Census data from the Instituto Brasileiro de Geografi a e Estatística (IBGE - Brazilian Institute of Geography and Statistics), only 2.3% of the population of Ermelino Matarazzo has a monthly per capita income greater than 10 minimum salaries, in contrast to 12.1% of the population in São Paulo municipality.b
The sample consisted of 890 people, aged 18 years or older, living at least six months in Ermelino Matarazzo. Sampling was performed through a three-stage cluster design: census sector selection (random selection of 35 sectors, distributed according to education of the household head), random selection of households from selected sectors and random selection of adults and older adults in the selected household.23 More details
on the sample design have been previously described.22
The long version of the International Physical Activity Questionnaire (IPAQ), validated in Brazil, was utilized to evaluate the practice of physical activity in leisure time and as a form of commuting. This instrument was used in epidemiological study with adult representative
sample of São Paulo municipality.3 Comprehensive
information about the validation studies and versions of the questionnaire are available on the internet.c
a Fundação Seade. Informações dos Distritos da Capital. [internet]. [cited 20 Dec 2010 ] Available: http://www.seade.gov.br/produtos/distritos/ imp.php?page=consulta&action=var_list&busca=Densidade+Demogr%E1fi ca
b Instituto Brasileiro de Geografi a e Estatística. Censo Demográfi co 2000. Rio de Janeiro; 2000.
c International Physical Activity Questionnaire. [internet] [cited 20 Dec 2010]. Available: http://www.ipaq.ki.se/ipaq.htm
To evaluate the environment we used an adapted version of the Neighborhood Environment Walkability Scale (NEWS -- Brazilian version), validated by Malavasi
et al.14 The scale was modifi ed to improve
under-standing by adult residents of Ermelino Matarazzo. The fi nal adapted version, consisting of 38 questions, was discussed with experts of the environment and physical activity in Brazil. The interclass correlation coeffi cient was ≥ 0.70 for all scores developed from the individual questions.
The dependent variable was the practice of at least 150 minutes per week of walking as commuting or of moderate to vigorous leisure time physical activity. The duration of vigorous physical activities in leisure time was multiplied by two and added to moderate physical activity. The independent variables were all the dichoto-mous and categorical variables and the self-reported environmental score. The control variables were sex, education, age and length of time residing in household.
Poisson and two regression models were used to evaluate the effect of the independent variables on the practice of physical activity.
Initially, the chi-square was calculated for all environ-mental variables compared to each dependent variable. Variables with p values < 0.20 underwent bivariate analysis.8 For the multiple models, variables with p <
0.05 were used. Only variables that maintained signifi -cance after adjustment for the control variables were included in the fi nal models. In case a dichotomous or categorical variable was included in the fi nal model (for example, feeling safe at night or feeling safe during the day or overall safety score), each of these variables was tested with other environmental variables together with the control variables. We opted for the variable that remained signifi cant after adjusting for the other environmental variables and the control variables.
For data analysis, the sample was weighted according to age group and the sample proportion from the census
sector, estimated from the 2000 Census by IBGE.b
Statistical analysis was performed with SPSS version 15.0 and Stata version 9.1.
The study was approved by the Research Ethics Committee of the Faculdade de Saúde Pública da Universidade de São Paulo (record number 1488 on 4/12/2006).
RESULTS
1). These characteristics approximate the population of São Paulo municipality.
In the sample, people were more active in commuting in comparison to leisure time physical activity (Table 2), which may be associated with the low socioeconomic level of the area.
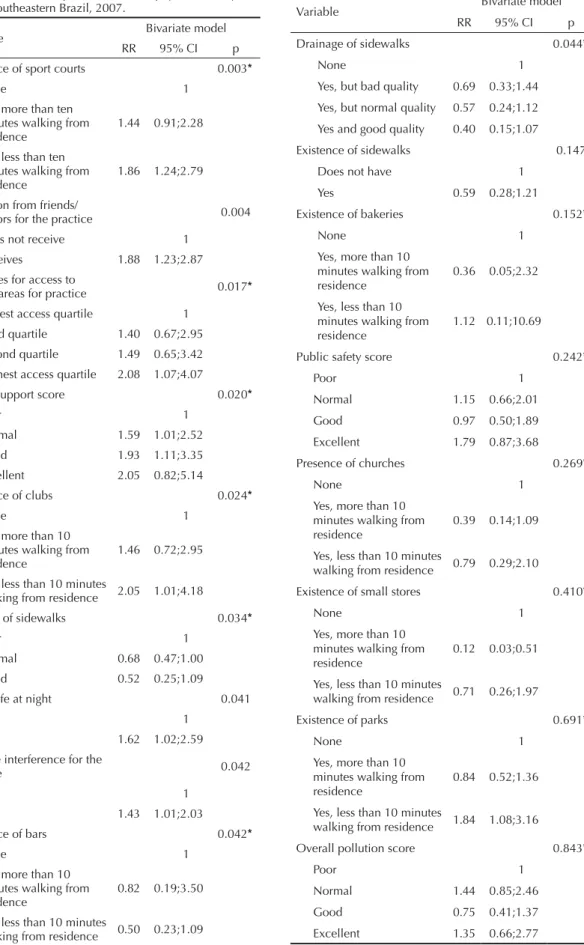
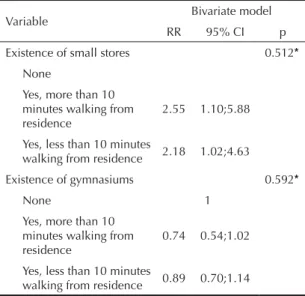
The variables that obtained p values < 0.20 for the prac-tice of at least 150 minutes of leisure physical activity were: amount of recreational areas, clubs, sport courts, social support through invitations from friends and good perception of public safety (Table 3). For walking as commuting, good perception of public safety and safety in commuting were important (Table 4).
After adjustment, the variables associated with leisure physical activity were: invitation from friends/neigh-bors, proximity of clubs near homes and long distance of bars from homes (Table 5).
In regards to walking as commuting, after adjustment, overall public safety was the only variable associated with this type of physical activity (Table 5).
DISCUSSION
This study found that people with a good perception of safety were more likely to be active in commuting. The score for this perception consisted of safety in walking, good street lighting at night of streets around the residence and bicycle riding or physical activity during the day or physical activity at night.
The results were similar to other studies performed in high-income countries.5,6,10 Giles-Corti & Donovan,6
in a study with 1,803 Australian adults found that the perception of safe places for walking was associated to the practice of at least 30 minutes per day of walking in commuting (OR = 1.49; 95%CI: 1.14;1.95) or of any type of walking (OR = 1.50; 95%CI: 1.08;2.09). Similar fi ndings were identifi ed in English female adults. Self-reported bad safety was associated with reduced likelihood of any type of walking (OR = 0.53; 95%CI: 0.31;0.88).5
A study with 861 adults in three cities of the United States found that after six months of follow up, women reporting low crime index in their neighborhood prac-ticed more minutes of physical activity per week in
comparison to other women.21
Good self-perception of safety may be associated with the improvement and maintenance of
neighbor-hood facilities. Wood et al24 argued that adequate
Table 1. Study sample, by sociodemographic characteristics.
São Paulo, Southeastern Brazil, 2007.
Variables n %*
Sex
Male 368 44.8
Female 522 55.2
Age (years)
18 to 39 302 52.0
40 to 59 203 35.4 60 or more 385 12.6
Marital status
Single 253 12.5
Separated, widowed, divorced 180 30.8
Married 457 56.8
Years of education
0 to 3 242 16.1
4 to 7 300 30.0
8 to 11 252 39.3
12 or more 96 14.6
Skin color
Not white 401 46.6
White 488 53.4
Length of time residing in household (years)
Until 1 64 9.4
From 1 to 5 135 18.0
From 5 to 10 years 148 19.3 10 or more years 543 53.2
From 10 to 20 years 134 21.8
Length of time residing in São Paulo (years)
Until 10 58 9.0
From 10 to 20 134 21.8
20 or more 698 69.2
Total 890 100
* estimated values
Table 2. Prevalence of physical activity by adults. São Paulo, Southeastern Brazil, 2007.
Practice of physica activity n %*
Leisure time physical activity
Does not practice 621 68.7
Practices between 10 and 149 minutes
per week 135 15.4
Practices 150 or more minutes per
week 134 16.0
Walking as commuting
Does not practice 130 14.3
Practices between 10 and 149 minutes
per week 438 50.3
Practices 150 or more minutes per
week 322 35.4
Total 890 100.0
Table 3. Bivariate regression analysis for the perception of the environment and practice of leisure physical activity. São Paulo, Southeastern Brazil, 2007.
Variable Bivariate model RR 95% CI p Existence of sport courts 0.003*
None 1
Yes, more than ten minutes walking from residence
1.44 0.91;2.28
Yes, less than ten minutes walking from residence
1.86 1.24;2.79
Invitation from friends/
neighbors for the practice 0.004 Does not receive 1
Receives 1.88 1.23;2.87 Quartiles for access to
leisure areas for practice 0.017* Lowest access quartile 1
Third quartile 1.40 0.67;2.95 Second quartile 1.49 0.65;3.42
Highest access quartile 2.08 1.07;4.07 Social support score 0.020*
Poor 1
Normal 1.59 1.01;2.52
Good 1.93 1.11;3.35 Excellent 2.05 0.82;5.14 Existence of clubs 0.024*
None 1
Yes, more than 10 minutes walking from residence
1.46 0.72;2.95
Yes, less than 10 minutes
walking from residence 2.05 1.01;4.18 Quality of sidewalks 0.034*
Poor 1
Normal 0.68 0.47;1.00 Good 0.52 0.25;1.09
Feels safe at night 0.041
No 1
Yes 1.62 1.02;2.59 Climate interference for the
practice 0.042
Yes 1
No 1.43 1.01;2.03 Existence of bars 0.042*
None 1
Yes, more than 10 minutes walking from residence
0.82 0.19;3.50
Yes, less than 10 minutes
walking from residence 0.50 0.23;1.09 To be continued
Table 3 continuation
Variable Bivariate model RR 95% CI p
Drainage of sidewalks 0.044*
None 1
Yes, but bad quality 0.69 0.33;1.44
Yes, but normal quality 0.57 0.24;1.12
Yes and good quality 0.40 0.15;1.07
Existence of sidewalks 0.147
Does not have 1
Yes 0.59 0.28;1.21
Existence of bakeries 0.152*
None 1
Yes, more than 10 minutes walking from residence
0.36 0.05;2.32
Yes, less than 10 minutes walking from residence
1.12 0.11;10.69
Public safety score 0.242*
Poor 1
Normal 1.15 0.66;2.01
Good 0.97 0.50;1.89
Excellent 1.79 0.87;3.68
Presence of churches 0.269*
None 1
Yes, more than 10 minutes walking from residence
0.39 0.14;1.09
Yes, less than 10 minutes
walking from residence 0.79 0.29;2.10
Existence of small stores 0.410*
None 1
Yes, more than 10 minutes walking from residence
0.12 0.03;0.51
Yes, less than 10 minutes
walking from residence 0.71 0.26;1.97
Existence of parks 0.691*
None 1
Yes, more than 10 minutes walking from residence
0.84 0.52;1.36
Yes, less than 10 minutes
walking from residence 1.84 1.08;3.16
Overall pollution score 0.843*
Poor 1
Normal 1.44 0.85;2.46
Good 0.75 0.41;1.37
Excellent 1.35 0.66;2.77
maintenance of neighborhoods allows for improved social networks and improved social control, contrib-uting to increased sense of safety among residents.
These results highlight that to promote physical activity it is important to invest in public safety and violence prevention.
The prevalence identifi ed in this study for active people in leisure time was similar to a recent national survey of adults in all the Brazilian capitals.4 Additionally,
the results of this study showed that people invited to practice physical activity are more likely to be active in leisure.
A similar fi nding was reported in a cross-sectional study of adults (n = 2,205) in the United States,7 where people
with a partner for practicing had increased likelihood of meeting physical activity recommendations (OR = 1.47; 95%CI: 1.15;1.89).
Giles-Corti & Donovan6 showed that the perception of
social support in the neighborhood for walking with a partner was associated with walking for leisure (OR = 1.80; 95%CI: 1.36;2.40) and with walking in general (OR = 1.52: 95%CI: 1.09;2.11). One of the fi rst cross-sectional surveys performed with European adults in Belgium, Finland, Germany, the Netherlands and Spain, found that people with low scores for social support were more likely to be inactive in leisure (OR = 2.15; 95%CI: 1.72;2.68).23
Evidence from high-income countries indicates that social support is very important for the practice of physical activity. The results from this study support the above hypothesis and reinforce the importance of investing in environments that stimulate people’s
Table 4. Bivariate regression analysis of the perception of
the environment and practice of walking as commuting. São Paulo, Southeastern Brazil, 2007.
Variable Bivariate model RR 95% CI p
Feels safe during the night 0.003
No 1
Yes 1.10 1.03;1.16
Public safety score 0.004*
Bad 1
Normal 1.10 0.96;1.25 Good 1.12 0.98;1.27
Excellent 1.18 1.07;1.31
Safety in commuting 0.023*
Bad 1
Normal 0.95 0.72;1.25
Good 0.54 0.38;0.79
Excellent 0.98 0.65;1.47
Existence of street markets 0.074*
None 1
Yes, more than 10 minutes walking from residence
3.91 1.39;10.95
Yes, less than 10 minutes
walking from residence 3.98 1.41;10.68
Sewage exposed to open air 0.111
Yes in the vacinity of the
residence 1
None in the vacinity of
the residence 1.01 0.92;1.08
Existence of pedestrian crosswalks 0.124
Yes in the vacinity of the
residence 1
Non in the vacinity of
the residence 0.93 0.85;1.02
Presence of public squares 0.134*
None 1
Yes, more than 10
minutes from residence 1.07 0.93;1.22
Yes, less than 10 minutes
from residence 1.09 0.97;1.23
Existence of football fi elds 0.159*
None 1
Yes, more than 10 minutes walking from residence
0.98 0.90;1.07
Yes, less than 10 minutes
walking from residence 1.04 0.98;1.12
Owns a dog 0.363
No 1
Yes 0.96 0.89;1.04
To be continued
Table 4 continuation
Variable Bivariate model RR 95% CI p
Existence of small stores 0.512*
None
Yes, more than 10 minutes walking from residence
2.55 1.10;5.88
Yes, less than 10 minutes
walking from residence 2.18 1.02;4.63
Existence of gymnasiums 0.592*
None 1
Yes, more than 10 minutes walking from residence
0.74 0.54;1.02
Yes, less than 10 minutes
walking from residence 0.89 0.70;1.14
surroundings to encourage the creation of social networks important to the practice of physical activity.
Proximity between clubs and the home was positively associated with leisure physical activity. Nonetheless, the presence of bars was inversely associated with practice. Other studies were not identifi ed to support the
fi nding that bars close to homes are inversely associated with the practice of leisure physical activity.
Although bars are important places for social interac-tion, patrons may have unhealthy habits such as exces-sive alcohol consumption, tobacco use and consump-tion of high energy density food with low nutriconsump-tional value. In addition, the chance of serious violence acts is higher in these locations, especially in the periphery of São Paulo city, and it is possible that proximity to these establishments is related to degraded environments.
In regards to clubs, it is well established in high-income countries that the presence of leisure and recreation facilities is positively associated with the practice of leisure physical activity.2,6,9,13,15,19 Clubs were the only
specifi c recreational facilities associated to leisure physical activity in this study. In Ermelino Matarazzo district there were eight facilities in 2007, all public.
This fi nding is even more relevant when considering
other issues such as the formation of social networks, in which clubs play an important role.
In Brazil, analysis of data from more than 54 thousand adults interviewed by the Vigitel System showed that the existence of adequate locations close to residences was associated with the practice of at least 150 minutes per week of leisure physical activity.4
Adequate access to recreational areas and open public spaces is not only associated with leisure physical activity but also increases the likelihood of walking at least 150 minutes.5,6,7,11
These data show the importance of leisure and recre-ational areas in urban planning, since these facilities contribute to leisure physical activity and also walking as commuting.
As limitation, cross-sectional studies are unable to establish causality. The evaluation of self-reported environment in relation to practice of physical activity may suffer from this problem, since without temporality it is not possible to establish if an adequate environ-ment is the cause of physical activity. In addition, the perception of environment relies on current knowledge of the neighborhood. This limitation may have been minimized since the analysis considered length of time living in the current home.
Another problem that may have infl uenced the results is related to the notion of proximity. It was defi ned as locations people could reach within ten minutes walking
Table 5. Final regression model for perception of the environment and practice of leisure physical activity or walking as
commuting. São Paulo, Southeastern Brazil, 2007.
Variable Final multivariate model
a
RR 95% CI p
Leisure physical activity
Existence of clubs 0.010*
None 1
Yes, more than 10 minutes from residence 1.26 0.63;2.51 Yes, less than 10 minutes from residence 2.26 1.33;3.85
Existence of bars 0.004*
None 1
Yes, more than 10 minutes walking from residence 1.21 0.30;4.85 Yes, less than 10 minutes walking from residence 0.48 0.26;0.91
Receiving invitation from friends/neighbors 0.023
No 1
Yes 1.59 1.07;2.38
Walking as commuting
Public safety score 0.003*
Bad 1
Normal 1.11 0.98;1.26
Good 1.13 0.99;1.28
Excellent 1.19 1.07;1.33
a Model adjusted for sex, age, education and length of residence in household
from their home, equal to approximately 800 meters. Distances from 400 meters to 1,500 meters (from fi ve to 15 minutes walking) are signifi cantly associated with the practice of walking for commuting.16 Nonetheless, it
is not known if the people interviewed share this notion of time and distance.
A modifi ed scale, based on the NEWS version
vali-dated in Brazil, was used to establish data validity and the true relationship with the contextual data of the environment.14 Although the contextual indicators are
associated and follow the same direction of relationship
as indicators previously found to be related to physical activity,17 a recent study found low agreement between
objectively measured data and self-reported data.1
Therefore, it is possible that the objective and perceived variables capture different aspects of the environment, which would explain the low agreement.
In summary, these results show that the practice of physical activity is a complex phenomenon, requiring interdisciplinary strategies for understanding and promotion, which can be found in the 2006 National Policy for Health Promotion.
1. Ball K, Jeffery RW, Crawford DA, Roberts RJ, Salmon J, Timperio AF. Mismatch between perceived and objective measures of physical activity environments. Prev Med. 2008;47(3):294-8. Doi:10.1016/j. ypmed.2008.05.001
2. Booth ML, Owen N, Bauman A, Clavisi O, Leslie E. Social-cognitive and perceived environment infl uences associated with physical activity in older Australians. Prev Med. 2000;31(1):15-22. DOI:10.1006/ pmed.2000.0661
3. Florindo AA, Guimarães VV, Cesar CL, Barros MB, Alves MC, Goldbaum M. Epidemiology of leisure, transportation, occupational, and household physical activity: prevalence and associated factors. J Phys Act Health. 2009;6(5):625-32.
4. Florindo AA, Hallal PC, de Moura EC, Malta DC. Practice of physical activities and associated factors in adults, Brazil, 2006. Rev Saude Publica. 2009;43 Suppl 2:65-73. DOI:10.1590/S0034-89102009000900009
5. Foster C, Hillsdon M, Thorogood M. Environmental perceptions and walking in English adults. J Epidemiol Community Health. 2004;58(11):924-8. DOI:10.1136/ jech.2003.014068
6. Giles-Corti B, Donovan RJ. Socioeconomic status differences in recreational physical activity levels and real and perceived access to a supportive physical environment. Prev Med. 2002 ;35(6):601-11. DOI:10.1006/pmed.2002.1115
7. Granner ML, Sharpe PA, Hutto B, Wilcox S, Addy CL. Perceived individual, social, and environmental factors for physical activity and walking. J Phys Act Health. 2007;4(3):278-93.
8. Hocking RR. The analysis and selection of variables in linear regression. Biometrics. 1976;32(1):1-49.
9. Hoehner CM, Brennan Ramirez LK, Elliott MB, Handy SL, Brownson RC. Perceived and objective environmental measures and physical activity among urban adults. Am J Prev Med. 2005;28(2 Suppl 2):105-16. DOI:10.1016/j.amepre.2004.10.023
10. Hooker SP, Wilson DK, Griffi n SF, Ainsworth BE. Perceptions of environmental supports for physical activity in African American and white adults in a rural county in South Carolina. Prev Chronic Dis. 2005;2(4):A11.
11. Humpel N, Owen N, Iverson D, Leslie E, Bauman A. Perceived environment attributes, residential location, and walking for particular purposes. Am J Prev Med. 2004;26(2):119-25. DOI:10.1016/j. amepre.2003.10.005
12. Humpel N, Owen N, Leslie E. Environmental factors associated with adults’ participation in physical activity: a review. Am J Prev Med. 2002;22(3):188-99.
13. Huston SL, Evenson KR, Bors P, Gizlice Z. Neighborhood environment, access to places for activity, and leisure-time physical activity in a diverse North Carolina population. Am J Health Promot. 2003;18(1):58-69.
14. Malavasi LM, Duarte MFS, Both J, Reis RS. Escala de mobilidade ativa no ambiente comunitário - News Brasil: retradução e reprodutibilidade. Rev Bras Cineantropom Desempenho Hum. 2007;9(4):339-50.
15. McCormack GR, Giles-Corti B, Bulsara M. Correlates of using neighborhood recreational destinations in physically active respondents. J Phys Act Health. 2007;4(1):39-53.
16. McCormack GR, Giles-Corti B, Bulsara M. The relationship between destination proximity, destination mix and physical activity behaviors. Prev Med. 2008;46(1):33-40. DOI:10.1016/j.ypmed.2007.01.013
17. McGinn AP, Evenson KR, Herring AH, Huston SL, Rodriguez DA. The association of perceived and objectively measured crime with physical activity: a cross-sectional analysis. J Phys Act Health. 2008;5(1):117-31.
18. Owen N, Humpel N, Leslie E, Bauman A, Sallis JF. Understanding environmental infl uences on walking; review and research agenda. Am J Prev Med. 2004;27(1):67-76. DOI:10.1016/j.amepre.2004.03.006
19. Rutten A, Abel T, Kannas L, von Lengerke T, Luschen G, Diaz JA, et al. Self reported physical activity, public health, and perceived environment: results from a comparative European study. J Epidemiol Community Health. 2001;55(2):139-46. DOI:10.1136/jech.55.2.139
20. Sallis JF, Cervero RB, Ascher W, Henderson KA, Kraft MK, Kerr J. An ecological approach to creating active living communities. Annu Rev Public Health. 2006;27:297-322. DOI:10.1146/annurev. publhealth.27.021405.102100
Article based on associate professor thesis of Florindo AA, presented to Escola de Artes, Ciências e Humanidades da Universidade de São Paulo, in 2009.
Research supported by Fundação de Amparo à Pesquisa do Estado de São Paulo (Process nº 2006/57810-0) and Conselho Nacional de Desenvolvimento Científi co e Tecnológico (Processo nº 402042/2005-0).
The authors declare that there are no confl icts of interest. 21. Sallis JF, King AC, Sirard JR, Albright CL. Perceived
environmental predictors of physical activity over 6 months in adults: activity counseling trial. Health Psychol. 2007;26(6):701-9. DOI:10.1037/0278-6133.26.6.701
22. Salvador EP, Florindo AA, Reis RS, Costa EF. Perception of the environment and leisure-time physical activity in the elderly. Rev Saude Publica. 2009;43(6):972-80. DOI:10.1590/S0034-89102009005000082
23. Stähl T, Rütten A, Nutbeam D, Bauman A, Kannas L,
Abel T, et al. The importance of the social environment for physically active lifestyle: results from an
international study. Soc Sci Med. 2001;52(1):1-10. DOI:10.1016/S0277-9536(00)00116-7