Validity of self-reported
weight and height: the
Goiânia study, Brazil
ABSTRACT
OBJECTIVE: To assess the validity of self-reported weight and height at the time of diagnosing obesity, and to identify the sociodemographic and individual characteristics that might be a source of information bias.
METHODS: This was a cross-sectional population-based study carried out in the city of Goiânia in 2001. Interviews were conducted with 1,023 individuals aged 20-64 years, in their homes, to collect sociodemographic and self-reported weight and height information. On the same occasion, weight and height measurements were made on these individuals. The mean differences and correlation coefficients between self-reported and measured data were calculated according to age, body mass index (BMI), schooling, income and height.
RESULTS: Both the men and women overestimated their heights (p<0.05), by 0.9 cm and 2.2 cm, respectively. There was no difference between self-reported and measured weights, either for the men (-0.44 kg; p=0.06) or for the women (-0.03 kg; p>0.05). The behavior of overestimating height was influenced by age, schooling, height and body mass index. Although this index obtained from the self-reported data was underestimated (p<0.05), by 0.27 kg/m2 and 0.67 kg/m2 for men and women respectively, the measured and self-reported data presented a high degree of agreement. Both the sensitivity and specificity of the self-reported body mass index were high, in relation to identifying the measured index.
CONCLUSIONS: In epidemiological studies for monitoring the prevalence of excess weight in populations, self-reported weights and heights constitute reliable data, which gives validity to the methodology utilized.
KEYW O RD S: O besity, diagnosis. Body mass index. Sensitivity and specificity.
M aria do Rosário Gondim PeixotoI
M aria H elena D ’Aquino BenícioII
Paulo César Brandão Veiga JardimIII
I Faculdade de Nutrição. Universidade
Federal de Goiás (UFG). Goiânia, GO, Brasil
I I Faculdade de Saúde Pública. Universidade
de São Paulo. São Paulo, SP, Brasil
I I IFaculdade de Medicina. UFG. Goiânia,
GO, Brasil
Correspondence:
Maria do Rosário Gondim Peixoto Faculdade de Nutrição
Rua 227 Quadra 68 Setor Leste Universitário 74605-080 Goiânia, GO, Brasil
E-mail: [email protected]
INTRODUCTION
The high prevalence of chronic non-transmittable diseases has increased the interest in studies in which information on signs and symptoms and associated risk factors is obtained from self-reporting by the population. The data can be gathered by means of face-to-face interviews, by sending out questionnaires through the post, or by telephone interviews. These procedures make it possible to assess and follow up representative samples from the population, over the course of time, at lower cost and with simplification of the fieldwork.
In these studies, among the variables reported are measurements of weight and height. These are uti-lized for calculating the body mass index (BMI), which is the anthropometric index most utilized in population studies. The results from various stud-ies4,7,8,12 have shown that self-reported weight and
height present high concordance with data obtained directly. These results are therefore an interesting al-ternative for measuring and monitoring the preva-lence of obesity.
However, evidence has shown that the error in the information is related to characteristics like obesity, age, social conditions, cultural factors and psycho-logical factors. In the case of anthropometric meas-urements, there is a tendency to want to attain a so-cially valued appearance for the body. In this respect, greater underestimation of weight has been observed among obese individuals and overestimation of height has particularly been seen among people of
short stature.3,4,8,13,14 Older individuals also tend to
overestimate their present height to a greater extent than do younger people, partly because of the gradual
loss of height that takes place with aging.4,8,12
Since the error is not random, high prevalence of indi-viduals who underestimate or overestimate their weight and/or height measurements leads to a biased BMI classification, with a reduction in the prevalence of individuals situated at the extremes of the classifica-tions (obesity and low weight). Therefore, before uti-lizing self-reported weight and height measurements for a given population, it is pertinent to conduct stud-ies that enable determination of the magnitude of the error associated with this information.
So far, few studies have been conducted in Brazil on the validity of self-reported weight and height
meas-urements.1,2,10,11 In a study conducted on the urban
population of Porto Alegre, Schmidt et al10 (1993)
observed that weight was overestimated by men and underestimated by women, but they concluded that the validity of self-reported weight was acceptable in obesity prevalence studies.
The objective of the present study was to assess the validity of self-reported weight and height for diag-nosing obesity, and to identify the sociodemographic and individual characteristics that could contain in-formation bias.
M ETH O D S
Data from a project entitled “Study on the prevalence and knowledge of arterial hypertension and some risk factors in a region of Brazil” were utilized.* This was a cross-sectional population-based study that was car-ried out in the state capitals and two other cities of the States of Goiás and Mato Grosso, Midwestern Brazil. In the present study, only the data relating to Goiânia were analyzed, which were gathered between June and December 2001.
The sample size for the municipality of Goiânia was calculated by taking into consideration a population of 1,004,098 inhabitants, 20% prevalence of arterial hypertension in Brazil among the adult population, confidence interval of 95% and estimation error of 10%. The sample obtained (n=1,534) was increased by 30% to cover for losses (N=1,994). The homes were selected by means of probabilistic sampling by clus-ters, in two stages. The first stage consisted of identify-ing the census tracts that were utilized in the National Home Sampling Survey (PNAD) of 1998, in the urban zone of the municipality of Goiânia. The second stage consisted of selecting homes in each census tract and the total size of the sample. From calculation of the sample size per census tract, the homes in each tract were drawn randomly and systematically.
In the homes selected, only one person living there was interviewed, drawn from among the residents aged over 18 years, in order to avoid problems of interde-pendence of information between interviewees. Preg-nant women and mothers with children aged less than six months were excluded from the draw, to avoid errors of data interpretation. Residents who were hos-pitalized were also excluded. Among the losses (N=540), 121 addresses were not located, or there was no home at that location, while in 419 cases the inter-view was not conducted because the residents refused to participate, the home was unoccupied, or there was no one at home (making a maximum of three visits on different days and at different times).
The sample consisted of 1,454 non-hospitalized in-dividuals living in the urban area (72.9% of the total sample and 95% of the sample needed). Of these, 1,252 individuals (433 men and 819 women) aged 20 to 64 years were eligible. Individuals who did not give in-formation regarding self-reported height (10 men and 113 women), self-reported weight (22 men and 39 women) or either of these (six men and 39 women) were excluded. Thus, 229 individuals (18.3%) were excluded: 38 men (8.8%) and 191 women (23.3%). The final sample was therefore composed of 1,023 individuals.
The data collection was carried out by trained inter-viewers, who filled out a standardized questionnaire containing questions on sociodemographic condi-tions and lifestyle (diet, physical activity, alcohol consumption and smoking) and measurements of ar-terial pressure, weight, height and waist circumfer-ence. Before making the anthropometric measure-ments, the individuals stated their current weight and height. The anthropometric measurements were ob-tained by utilizing the standardized procedures of
Lohman, Roche & Martorel.5
The individuals were weighed and measured with-out shoes on and wearing light clothing. To meas-ure weights, a Plenna electronic balance (Giant Lithium model) was utilized, with a capacity of 150 kg and precision of 100 g. To measure heights, a portable stadiometer (Seca) was utilized, with preci-sion of 0.1 cm.
The BMI was calculated by dividing the weight (kg) by the square of the height (m). To classify the BMI values, the recommendations from the World Health
Organization (WHO,16 1997) were utilized: <18.5 kg/
m2 (underweight); 18.5 to 24.99 kg/m2 (normal weight);
25 to 29.99 kg/m2 (overweight); and ≥30 kg/m2 (obese).
After reviewing the questionnaires, the data were typed in twice, to assess the typing quality. For this analysis, Stata 7.0 was utilized.
The errors in the information on height, weight and BMI were obtained as the difference between the self-reported and measured values. Negative values sig-nified underestimation of the self-reported values and positive values represented overestimation of the self-reported values.
The paired Student t-test was utilized to assess the differences between the means of the self-reported and measured values, for each sex. Analysis of vari-ance was utilized to evaluate the differences between the self-reported and measured values according to
age categories (20-24; 25-34; 35-44; 45-54; and
55-64), schooling (<9 years and ≥9 years); BMI (<18.5;
18.5-24; 25-29; and ≥30); family income (quartiles
of per capita income) and height (quartiles). To deter-mine which of these variables presented independ-ent associations with the error in the weight and height information, multiple linear regression analy-sis was performed.
To assess the concordance between the measured and self-reported weights and heights, the intraclass cor-relation coefficient was calculated. This coefficient was chosen because, as well as evaluating the corre-lation between groups of values, it is also a good measurement for concordance (reproducibility), since it takes into consideration the variability between individuals, i.e. the systematic tendency towards
un-derestimation or overestimation.15
The validity of the BMI obtained from the self-re-ported weights and heights was analyzed by means of the sensitivity and specificity for classifying the BMI correctly.
The statistical analyses were corrected according to the complex delineation of the sample, by means of the SVY set of commands in Stata, which consider the complex structure of the sample by using the weights associated with each sample cluster and the sampling design effect. The significance level was set at 5%.
The interviews were conducted after the individuals had signed a statement of consent. The study proto-col was approved by the Ethics Committee for Hu-man and Animal Medical Research of Hospital das Clínicas, Universidade Federal de Goiás.
RESU LTS
Interviews were conducted with 1,023 individuals, of whom 628 (61.4%) were women and 395 (38.6%) were men. There was no significant difference be-tween the men and women with regard to age, school-ing and per capita income, and these means were,
respectively: 37.8 years vs 37.6 years; 8.0 years vs
7.90 years; and 2.1 minimum wages vs 1.8 minimum
wages. Comparison between the excluded and stud-ied individuals did not show any difference in rela-tion to age and BMI categories (data not presented).
the third quartile of income and height. The differ-ence with the greatest magnitude observed among the men was for underweight men (BMI <18.5 kg/
m2), who overestimated their weight by a mean of
around 3 kg. On the other hand, obese men underesti-mated their weight by a mean of -1.4 kg (p<0.01). Analysis of variance showed that the differences be-tween self-reported and measured weight varied sig-nificantly with age (p=0.04), schooling (p=0.03) and BMI (p<0.01) (Table 1).
The women tended to underestimate their weight, but without statistical significance. Analysis of the dif-ferences, according to the categories of the variables studied, showed that the underestimation of weight was only significant for women aged 35 to 44 years, for those situated in the third quartile of income, and for obese women (p<0.01). Underweight and normal weight women overestimated their weight by a mean of 0.81 kg and 0.27 kg (p<0.01), respectively. The differences between self-reported and measured weight varied significantly with age (p<0.01) and BMI (p<0.01) (Table 2).
In the multiple linear regression, only the BMI pre-sented an independent association with the error in weight information, for both sexes. For each increase
of 1 kg/m2 in BMI, the difference between
self-re-ported and real weight decreased by 0.28 kg (95% CI: -0.40 to -0.16; p<0.001) for the men and by 0.1 kg (95% CI: -0.16 to -0.04; p<0.01) for the women. This
occurred because the underweight individuals had stated their weight with a greater differential than had the overweight individuals.
The intraclass correlation coefficients between the self-reported and measured weight were 0.96 and 0.97, for the men and women, respectively. A high degree of concordance was observed for all the categories of the variables analyzed, for both sexes (Tables 1 and 2).
The distribution of the differences between self-re-ported and measured weight showed that 95% of the weights reported by the men were between -7.9 kg and 8.0 kg and for the women between -5.7 kg and 5.4 kg.
The weight was stated with a difference ≥2 kg (≤-2 or
≥+2 kg) by 45% of the men and 31% of the women.
Only 10.5% of the women stated their weight with an
error ≥4 kg, while for the men this figure was 20.3%.
The men overestimated their height by a mean of 0.91 cm (p<0.01), and the biggest magnitudes were ob-served for men between 55 and 64 years old (1.57 cm) and for those of shortest stature (2.11 cm). The differences between reported and measured height varied significantly with BMI (p<0.01) and height (p<0.01) (Table 1).
For the women, height was overestimated by 2.2 cm (p<0.01). Height was significantly overestimated in all categories of the variables investigated (age group, schooling, income, BMI and height). The greatest
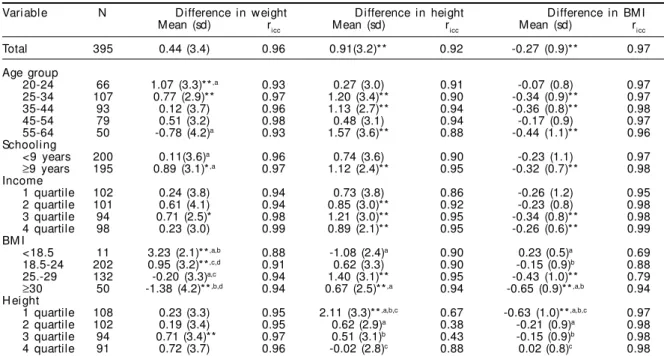
Table 1 - Difference* and intraclass correlation coefficient (ricc) between self-reported and measured weights, heights and BMI, for men according to age, socioeconomic variables and anthropometry. Goiânia, Midwestern Brazil, 2001.
Variable N Difference in weight Difference in height Difference in BM I
Mean (sd) ricc Mean (sd) ricc Mean (sd) ricc
Total 395 0.44 (3.4) 0.96 0.91(3.2)** 0.92 -0.27 (0.9)** 0.97
Age group
20-24 66 1.07 (3.3)**,a 0.93 0.27 (3.0) 0.91 -0.07 (0.8) 0.97
25-34 107 0.77 (2.9)** 0.97 1.20 (3.4)** 0.90 -0.34 (0.9)** 0.97
35-44 93 0.12 (3.7) 0.96 1.13 (2.7)** 0.94 -0.36 (0.8)** 0.98
45-54 79 0.51 (3.2) 0.98 0.48 (3.1) 0.94 -0.17 (0.9) 0.97
55-64 50 -0.78 (4.2)a 0.93 1.57 (3.6)** 0.88 -0.44 (1.1)** 0.96
Schooling
<9 years 200 0.11(3.6)a 0.96 0.74 (3.6) 0.90 -0.23 (1.1) 0.97
≥9 years 195 0.89 (3.1)*,a 0.97 1.12 (2.4)** 0.95 -0.32 (0.7)** 0.98 Income
1 quartile 102 0.24 (3.8) 0.94 0.73 (3.8) 0.86 -0.26 (1.2) 0.95
2 quartile 101 0.61 (4.1) 0.94 0.85 (3.0)** 0.92 -0.23 (0.8) 0.98
3 quartile 94 0.71 (2.5)* 0.98 1.21 (3.0)** 0.95 -0.34 (0.8)** 0.98
4 quartile 98 0.23 (3.0) 0.99 0.89 (2.1)** 0.95 -0.26 (0.6)** 0.99
BM I
<18.5 11 3.23 (2.1)**,a,b 0.88 -1.08 (2.4)a 0.90 0.23 (0.5)a 0.69 18.5-24 202 0.95 (3.2)**,c,d 0.91 0.62 (3.3) 0.90 -0.15 (0.9)b 0.88 25.-29 132 -0.20 (3.3)a,c 0.94 1.40 (3.1)** 0.95 -0.43 (1.0)** 0.79
≥30 50 -1.38 (4.2)**,b,d 0.94 0.67 (2.5)**,a 0.94 -0.65 (0.9)**,a,b 0.94 H ei ght
1 quartile 108 0.23 (3.3) 0.95 2.11 (3.3)**,a,b,c 0.67 -0.63 (1.0)**,a,b,c 0.97 2 quartile 102 0.19 (3.4) 0.95 0.62 (2.9)a 0.38 -0.21 (0.9)a 0.98 3 quartile 94 0.71 (3.4)** 0.97 0.51 (3.1)b 0.43 -0.15 (0.9)b 0.98
4 quartile 91 0.72 (3.7) 0.96 -0.02 (2.8)c 0.88 0.02 (0.8)c 0.98
*Difference = self-reported value minus measured value **Mean different from zero (p<0.05 in paired Student t test)
magnitudes were observed for the oldest women (3.33 cm), for those with least schooling (2.63 cm) and short-est stature (3.16 cm) and for those situated at the ex-tremes of the BMI classifications: underweight (3.66 cm) and obese (3.40 cm) (Table 2). The differences be-tween self-reported and measured height varied signifi-cantly with age, schooling, BMI and height (p<0.01).
For the men, an independent association with the er-ror in height information was observed for BMI and height. For the women, the error was independently associated with schooling and height. In the model
for the men, every 1 kg/m2 increased the difference in
the height information by 0.12 cm (95% CI: 0.05 to 0.20; p<0.01), and each centimeter reduced the dif-ference in height by 0.10 cm (95% CI: -0.16 to -0.03; p<0.01). In the model for the women, each year of schooling reduced the error in the height informa-tion by 0.05 cm (95% CI: -0.09 to -0.01; p=0.03) and each centimeter in height reduced the error by 0.09 cm (95% CI: -0.13 to -0.01; p=0.03).
The intraclass correlation coefficients between self-re-ported and measured height were 0.92 and 0.83, for men and women, respectively. These values were smaller than the coefficients observed for weight, thus indicating that self-reported height was less valid than weight, par-ticularly among the women (Tables 1 and 2).
The distribution of the differences between self-re-ported and measured height showed that 95% of the
values reported by the men were between -6.0 cm and 7.6 cm and for the women between -5.0 cm and 11.1 cm. Around 55% of the men and 57% of the women
stated their weight with a difference of ≥2 cm, and
9.3% of the men and 23.4% of the women overesti-mated their height by 5 cm or more.
The mean BMI obtained from the self-reported weights and heights was lower than the mean BMI calculated from the measured values (p<0.01), and in a more ac-centuated manner among the women. For both sexes, the greatest underestimates were observed for the old-est individuals, for obese individuals and for those of shorter stature. The differences between self-reported and measured BMI varied significantly with BMI and height for the men (p<0.01), and with age, schooling, BMI and height for the women (p<0.01). Despite these differences, a high correlation (0.97) was observed between self-reported and measured BMI, for the mean and the women (Tables 1 and 2).
Considering the measured BMI as the standard, it was observed that 25.1% of the men and 3.2% of the women who were underweight were classified as nor-mal using the self-reported BMI. At the other extreme, 10.2% of the obese men and 28.3% of the obese women were classified as overweight. Through this, it was observed that for the men, the sensitivities for identifying overweight and obesity were 82.0% and 89.8%, respectively, and were greater than for identi-fying underweight (74.9%). For the women, the
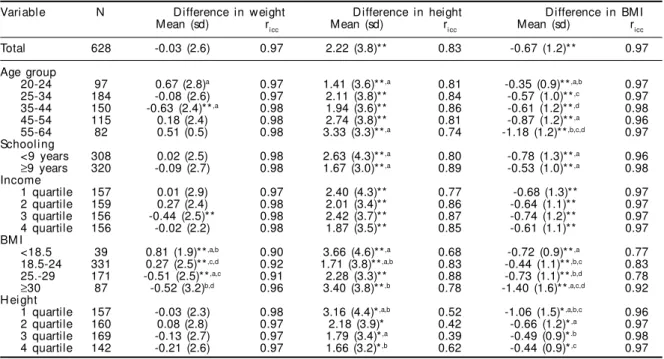
low-Table 2 - Difference* and intraclass correlation coefficient (ricc) between self-reported and measured weights, heights and BMI, for women according to age, socioeconomic variables and anthropometry. Goiânia, Midwestern Brazil, 2001. Variable N Difference in weight Difference in height Difference in BM I
Mean (sd) ricc Mean (sd) ricc Mean (sd) ricc
Total 628 -0.03 (2.6) 0.97 2.22 (3.8)** 0.83 -0.67 (1.2)** 0.97
Age group
20-24 97 0.67 (2.8)a 0.97 1.41 (3.6)**,a 0.81 -0.35 (0.9)**,a,b 0.97
25-34 184 -0.08 (2.6) 0.97 2.11 (3.8)** 0.84 -0.57 (1.0)**,c 0.97
35-44 150 -0.63 (2.4)**,a 0.98 1.94 (3.6)** 0.86 -0.61 (1.2)**,d 0.98
45-54 115 0.18 (2.4) 0.98 2.74 (3.8)** 0.81 -0.87 (1.2)**,a 0.96
55-64 82 0.51 (0.5) 0.98 3.33 (3.3)**,a 0.74 -1.18 (1.2)**,b,c,d 0.97 Schooling
<9 years 308 0.02 (2.5) 0.98 2.63 (4.3)**,a 0.80 -0.78 (1.3)**,a 0.96
≥9 years 320 -0.09 (2.7) 0.98 1.67 (3.0)**,a 0.89 -0.53 (1.0)**,a 0.98 Income
1 quartile 157 0.01 (2.9) 0.97 2.40 (4.3)** 0.77 -0.68 (1.3)** 0.97 2 quartile 159 0.27 (2.4) 0.98 2.01 (3.4)** 0.86 -0.64 (1.1)** 0.97 3 quartile 156 -0.44 (2.5)** 0.98 2.42 (3.7)** 0.87 -0.74 (1.2)** 0.97 4 quartile 156 -0.02 (2.2) 0.98 1.87 (3.5)** 0.85 -0.61 (1.1)** 0.97 BM I
<18.5 39 0.81 (1.9)**,a,b 0.90 3.66 (4.6)**,a 0.68 -0.72 (0.9)**,a 0.77 18.5-24 331 0.27 (2.5)**,c,d 0.92 1.71 (3.8)**,a,b 0.83 -0.44 (1.1)**,b,c 0.83 25.-29 171 -0.51 (2.5)**,a,c 0.91 2.28 (3.3)** 0.88 -0.73 (1.1)**,b,d 0.78
≥30 87 -0.52 (3.2)b,d 0.96 3.40 (3.8)**,b 0.78 -1.40 (1.6)**,a,c,d 0.92 H ei ght
1 quartile 157 -0.03 (2.3) 0.98 3.16 (4.4)*,a,b 0.52 -1.06 (1.5)*,a,b,c 0.96 2 quartile 160 0.08 (2.8) 0.97 2.18 (3.9)* 0.42 -0.66 (1.2)*,a 0.97 3 quartile 169 -0.13 (2.7) 0.97 1.79 (3.4)*,a 0.39 -0.49 (0.9)*.b 0.98 4 quartile 142 -0.21 (2.6) 0.97 1.66 (3.2)*,b 0.62 -0.44 (0.9)*,c 0.97 *Difference = self-reported value minus measured value
**Mean different from zero (p<0.05 in paired Student t-test)
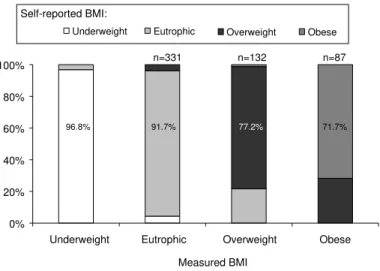
est sensitivities were observed for identifying over-weight and obesity: 77.2% and 71.7%, respectively (Figures 1 and 2). BMI obtained from self-reported weight and height was observed to present high specificity, for all categories of measured BMI, for both sexes. The lowest specificity was observed in the normal (eutrophic) category, which was 88.6% for the men and 84.5% for the women (data not pre-sented as a table).
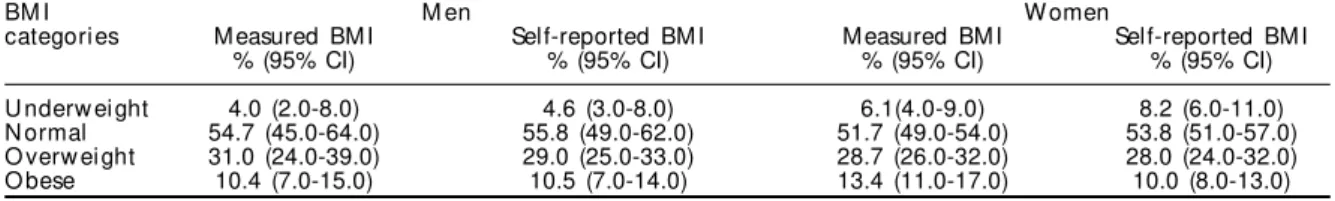
Table 3 shows a comparison between prevalences of self-reported and measured BMI categories (under-weight, normal, overweight and obese). Despite slight differences, the confidence intervals for self-reported and measured values overlap, thus indicating that they do not differ statistically.
D ISCU SSIO N
The present study showed high concordance between self-reported and measured weights and heights in a population-based survey in the city of
Goiânia. Although weights and heights were on average reported with small errors, some subgroups of individuals presented a greater tendency towards overestimating or underes-timating the anthropometric measurements.
The question asked in the interviews was “What is your present weight?”. To ensure quality control for the response, it might have been pertinent to ask beforehand when and where the individuals had weighed them-selves most recently, what type of balance had been used, and whether they had taken off their shoes and were only wearing light clothing on that occasion.
The differences between the self-reported
and measured weights could have been lower if people with a history of diseases that cause short-term weight variation (such as diabe-tes and infectious diseases) had been ex-cluded. Such diseases decrease the accuracy with which patients inform their current weight. Nonetheless, weight is frequently measured in health services, pharmacies and even in some homes. Thus, the failure to record these items had little interference in the self-reported weights, which showed a high intraclass correlation coefficient with measured weights.
Other factors that could have interfered in the accuracy of the self-reported measure-ments, and which were not assessed in the present study, are: the frequency with which indi-viduals weigh or measure themselves; body self-im-age perception; and the biotype that the individuals would like to have.
With regard to self-reported height, it was also not asked when this measurement had been made, by whom and whether the individuals had taken off their shoes on that occasion.
The fact that the individuals had been told that they would be weighted and measured may have inhib-ited the giving of incorrect information. Some peo-ple did not know or did not want to state their cur-rent weight and height. The percentage of men who did not report their weight and/or height was 8.8% in total. On the other hand, 14.8% of the women did not report their height, 3.4% did not report their weight and 4.4% did not report either of them. Con-trary to weight, height is rarely checked among adults. The smaller number of men who were unable
Figure 1 - Distribution of men according to categories for self-reported and measured BMI. Goiânia, Midwestern Brazil, 2001.
0% 20% 40% 60% 80% 100%
Underweight Eutrophic Overweight Obese Measured BMI
Underweight Eutrophic Overweight Obese
n=11 n=202 n=132 n=50
74.9% 92.2% 82.0% 89.8%
Self-reported BMI:
Figure 2 - Distribution of women according to categories for self-reported and measured BMI. Goiânia, Midwestern Brazil, 2001.
0% 20% 40% 60% 80% 100%
Underweight Eutrophic Overweight Obese Measured BMI
Underweight Eutrophic Overweight Obese
n=331 n=132 n=87
96.8% 91.7% 77.2% 71.7%
to report their height was partly due to the fact that they generally remember the height measured at the time of being called up for military service. Com-parison between the excluded and studied individu-als did not show any difference regarding the age and BMI categories.
Population-based studies with home interviews con-ducted by trained observers make it possible to ob-tain representative and standardized information. Obtaining self-reported and measured data on the same day is a positive point, since a gap between obtaining them would cause bias in interpreting the discrepancies between reported and measured val-ues. Moreover, the differences between the two types of data were evaluated by taking into consideration the characteristics of the population that could have an influence on the results, such as age, schooling, income, BMI and height.
The results observed are consistent with previous
studies4,12 in which a high correlation between
self-reported and measured weights and heights was ob-served. A tendency for overweight men and women to underestimate their weight, while underweight men tend to overestimate their weight, was also
found.4,6-8,10,12-14 However, contrary to these studies,
no overall underestimation of weight among women was observed in the present study.
Height was overestimated by the men (0.91 cm), with greatest magnitude among the men of shortest stature (2.11 cm), without any association with age. Contrary to what was observed in other population studies, the overestimation of height among men did not increase
significantly with age.12 For the women, height was
overestimated by 2.22 cm, and this overestimation was associated with age, schooling and income.
The overestimation of height by shorter and older individuals has also been observed in several
stud-ies, for both sexes.4,12 Increasing age has been
associ-ated with increasing error in the height information, partly due to the fact that people relate to the height they were when they were younger, and do not take into account the reduction that is observed during the aging process, which is estimated to be around 1
cm per decade after reaching 40 years old.8,16 On the
other hand, overestimation of height by shorter indi-viduals reinforces the premise of systematic error guided by cultural standards that value tallness as well as slimness.
In the present study, the combined effect of the vari-ations in self-reported weight and height in relation to measured values acted together such that the BMI was underestimated for both men and women, except for underweight individuals. The obese men were the group that was most erroneously classified. The old-est men and women also underold-estimated their BMI more than did the youngest individuals. Other stud-ies have indicated that the use of recalled informa-tion on weight and height for measuring associainforma-tions between diseases and increased BMI should be
inter-preted with care.9
The sensitivity for correctly classifying obesity in the present study was greater for men (89.8%) than for women (71.7%), mainly because of the greater error in height information from the women. The sen-sitivity values for classifying obesity have varied between different population studies, but greater sen-sitivity for classifying women than for men has
gen-erally been observed.7,10,12,14
The sensitivity of self-reported BMI for classifying obesity that was observed in the present study caused underestimation of the obesity prevalence by 0.1% for men and 3.4% for women, while the true preva-lence of obesity was 10.4% for men and 13.4% for women. In the study carried out in the urban area of Porto Alegre, it was observed that the prevalence of obesity was underestimated by 1% (for the whole
sam-ple).10 Roberts (1995)7 found 2% for both sexes and
Spencer et al12 (2002)observed underestimation of
5.2% for men and 3.4% for women. The true preva-lence of obesity in these studies was 10.0%, 8.0% and around 15.0%, respectively.
The prevalence of obesity based on self-reported weight and height was close to what was obtained for the measured values. This makes it possible to use self-reported weight and height in studies on the prevalence and monitoring of obesity.
Table 3 - Distribution (%) and confidence interval (95%) for the sample according to BMI categories from self-reported and measured weight and height. Goiânia, 2001.
BM I M en W omen
categori es M easured BM I Self-reported BM I M easured BM I Self-reported BM I
% (95% CI) % (95% CI) % (95% CI) % (95% CI)
REFEREN CES
1. Chor D, Coutinho ESF, Laurenti R. Confiabilidade da informação de peso e estatura em funcionários de banco estatal. Rev Saúde Pública. 1999;33(1):16-23. 2. Fonseca MJM, Faerstein E, Chor D, Lopes CS.
Validade de peso e estatura informados e índice de massa corporal: estudo pró-saúde. Rev Saúde Pública. 2004;38(13):392-8.
3. Jalkanen L, Tuomilehto J, Tanskanen P, Puska P. Accuracy of self-reported body weight compared to measured body weight: a population survey. Scand J Soc Med. 1987;15:191-8.
4. Kuczmarski MF, Kuczmarski RJ, Najjar M. Effects of age on validity of self-reported height weight, and body mass index: findings from of Third National Health and Nutrition Examination Survey, 1988-1994. J Am Diet Assoc. 2001;101(1):28-34.
5. Lohman TG, Roche AF, Martorel R, editors. Anthropometric standardization reference manual. Champaign (IL): Human Kinetics Books; 1988. 6. Pirie P, Jacobs D, Jeffrey R, Hannan P. Distorcion in
self-reported height and weight data. J Am Diet Assoc. 1981;78:601-6.
7. Roberts RJ. Can self-reported data accurately describe the prevalence of overweight? Public Health. 1995;109:275-84.
8. Rowland ML. Self-reported weight and height. Am J Clin Nutr. 1990;52:1125-33.
9. Santillan AA, Camargo Jr CA. Body mass index and asthma among Mexican adults: the effect of using self-reported vs measured weight and height. Int J Obes Relat Metab Disord. 2003;27:1430-3. 10. Schmidt MI, Duncan BB, Tavares M, Polanczyk CA,
Pellanda L, Zimmer PM. Validity of sef-reported weight: a study of urban brazilian adults. Rev Saúde Pública. 1993:27(4):271-6.
11. Silveira EA, Araújo CL, Gigante DP, Barros AJD, Lima MS. Validação do peso e altura referidos para o diagnóstico do estado nutricional em uma população de adultos no sul do Brasil. Cad Saúde Pública. 2005;21(1):235-45.
12. Spencer EA, Appleby PN, Davey GK, Key TJ. Validity of self-reported height and weight in 4808 EPIC-Oxford participants. Public Health Nutr. 2002;5(4):561-5.
13. Stevens J, Keil JE, Waid LR, Gazes PC. Accuracy of current, 4 year, and 28-year self-reported body weight in an elderly population. Am J Epidemiol. 1990;132:1156-63.
14. Stewart AW, Jackson RT, Ford MA, Beaglehole R. Understimation of relative weight by use self-reported height and weight. Am J Epidemiol. 1987;125:122-6. 15. Szklo M, Javier Nieto F. Epidemiology: beyond the
basics. Gaithersburg (MD): Aspen Publishers; 2000. Quality assurance and control; p. 343-401. 16. World Health Organization. Physical status: the use
and interpretation of antropometry. Geneva; 1995. (W HO-Technical Report Series, 854).
Article based on doctoral thesis by MRGPeixoto, presented to the Faculdade de Saúde Pública of Universidade de São Paulo, in 2004.