Growth curves in Down syndrome with congenital heart disease
CAROLINE D’AZEVEDO SICA1, CLAUDIA CICERI CESA2, LUCIA CAMPOS PELLANDA3*
1MSc in Health Sciences – Nutritionist at the Instituto de Cardiologia / Fundação Universitária de Cardiologia (IC/FUC), Porto Alegre, RS, Brazil 2PhD in Health Sciences – Professor of Physical Education at the IC/FUC, Porto Alegre, RS, Brazil
3PhD in Cardiovascular Sciences – Pediatric Cardiologist at the IC/FUC, Porto Alegre, RS, Brazil
S
UMMARYStudy conducted at the Instituto de Cardiologia/Fundação Universitária de Cardiologia (IC/FUC), Porto Alegre, RS, Brazil
Article received: 4/1/2015
Accepted for publication: 11/8/2015
*Correspondence:
Address: Av. Princesa Isabel, 370, Santana Porto Alegre, RS – Brazil Postal code: 90620-000 [email protected]
http://dx.doi.org/10.1590/1806-9282.62.05.414
Introduction: To assess dietary habits, nutritional status and food frequency
in children and adolescents with Down syndrome (DS) and congenital heart dis-ease (CHD). Additionally, we attempted to compare body mass index (BMI) clas-siications according to the World Health Organization (WHO) curves and curves developed for individuals with DS.
Method: Cross-sectional study including individuals with DS and CHD treat-ed at a referral center for cardiology, agtreat-ed 2 to 18 years. Weight, height, BMI, to-tal energy and food frequency were measured. Nutritional status was assessed using BMI for age and gender, using curves for evaluation of patients with DS and those set by the WHO.
Results: 68 subjects with DS and CHD were evaluated. Atrioventricular septal
defect (AVSD) was the most common heart disease (52.9%). There were differ-ences in BMI classiication between the curves proposed for patients with DS and those proposed by the WHO. There was an association between consump-tion of vitamin E and polyunsaturated fatty acids.
Conclusion: Results showed that individuals with DS are mostly considered normal weight for age, when evaluated using speciic curves for DS. Reviews on speciic curves for DS would be the recommended practice for health pro-fessionals so as to avoid precipitated diagnosis of overweight and/or obesity in this population.
Keywords: Down syndrome, assessment of nutritional status, anthropometry, body mass index.
I
NTRODUCTIONObesity, which in 2012 affected 43,000 worldwide, is an important cardiovascular risk factor.1 Approximately 30% of the children with Down syndrome (DS) are considered obese according to the World Health Organization (WHO).2,3 In 2002, growth curves for individuals with DS were proposed by Myrelid et al.4
Heart disease occurs in 40 to 50% of patients with DS and contributes signiicantly to morbidity and mortali-ty in these cases.5 However, little is known about the prev-alence of obesity in young people with DS associated with heart disease/congenital heart disease (CHD).6,7
If, on the one hand, heart diseases increase the risk of malnutrition before surgical correction, on the other hand, the overprotection of parents and physical inactiv-ity can aggravate obesinactiv-ity often presented by patients with DS after surgical correction.5,8
From the perspective of epidemiology in the course of life, risk factors that occur at different stages of de-velopment can have an impact on cardiovascular health throughout life. Malnutrition followed by overweight and obesity may represent an enhancement of risk to cardiovascular health compared to maintaining the same nutritional status over a period of time.7,9 Chil-dren with DS and CHD, due to the characteristics men-tioned above, can serve as a model for the study of this phenomenon.
Therefore, the aim of this study was to evaluate di-etary habits, nutritional status and food frequency in chil-dren and adolescents with DS and congenital heart dis-ease. Additionally, he sought to compare the BMI classiications according to the curves of the WHO11 and the curves developed for individuals with DS in this par-ticular group.4
M
ETHODCross-sectional study conducted from May 2011 to De-cember 2012, including children and adolescents aged from 2 to 18 years with Down syndrome and congenital heart disease seen at the Pediatric Cardiology Clinic, In-stituto de Cardiologia.
The project was approved by the ethics committee of Instituto de Cardiologia do Rio Grande Sul, under appli-cation no 4458/10. The participants’ parents and/or le-gal guardians signed prior authorization consenting to participate in the research.
A questionnaire with information about family his-tory was applied for analysis of non-communicable dis-eases, indicating the degree of kinship (father, mother, grandparents and siblings).
Weight and height were measured in a anthropomet-ric scale for adults (with 150 kg capacity and 100 g pre-cision) with coupled stadiometer (maximum length 2 me-ters and accuracy of 0.5 cm). Nutritional status was analyzed using BMI for age and gender, using the curves for evaluation of individuals with DS recommended by Myrelid et al.4 and the curves proposed by the WHO.11 The participants were classiied as underweight, normal weight, overweight and obesity.
The eating habits of the participants were assessed using a food frequency questionnaire used in other work with children.12 For diet assessment, we used a 24-hour record, referring to food intake the day before consulta-tion, and Nutwin software for the analysis of the records. Macro- and micronutrients were evaluated based on the 24-hour record and according to the Dietary Reference Intakes (DRI) recommendations.13
Diet composition was analyzed in terms of energy composition, carbohydrates, lipids, proteins, vitamins A, C, D and E, calcium, iron and fatty acids, according to the recommendations of the DRI by gender and age. The percentage distribution of macronutrients was evaluat-ed according to the amounts proposevaluat-ed by the Institute of Medicine.13
Considering a proportion of 50% of children with risk factors, with margin of error of 0.8 and a 95% conidence level, we estimated that it would be necessary to study 131
patients. Prevalence was described as percentages with their respective 95% conidence intervals. Continuous vari-ables were described as means and standard deviations. Macronutrient intake was compared between the groups using Student’s t-test. The analyses were performed with Statistical Package for the Social Sciences (SPSS) software, version 19.0 for Windows, and a p-value<0.05 was consid-ered signiicant.
R
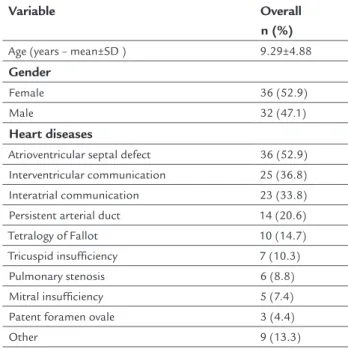
ESULTSOf the 70 children and adolescents with DS and congen-ital heart disease potentially eligible during the study pe-riod, there were two whose parents did not consent to participate. The inal sample thus included 68 partici-pants. The general characteristics of the participants are presented in Table 1.
TABLE 1 Description of the general characteristics and congenital heart diseases in the studied population (n=68).
Variable Overall
n (%)
Age (years – mean±SD ) 9.29±4.88
Gender
Female 36 (52.9)
Male 32 (47.1)
Heart diseases
Atrioventricular septal defect 36 (52.9) Interventricular communication 25 (36.8)
Interatrial communication 23 (33.8) Persistent arterial duct 14 (20.6) Tetralogy of Fallot 10 (14.7)
Tricuspid insufficiency 7 (10.3) Pulmonary stenosis 6 (8.8) Mitral insufficiency 5 (7.4)
Patent foramen ovale 3 (4.4)
Other 9 (13.3)
SD: standard deviation.
Atrioventricular septal defect (AVSD) was the most com-mon heart disease (52.9%), and 47.1% were male. There were differences in BMI classiication (underweight, nor-mal weight, overweight and obesity) between the curves proposed for people with DS and the curves proposed by the WHO (Table 2).
TABLE 2 Comparison of anthropometric assessment using BMI curves for normal individuals and for individuals with Down syndrome.
BMI for normal individuals Low weight
N=1 n (%)
Normal weight N=34
n (%)
Overweight N=17 n (%)
Obese N=16 n (%)
p<0.01
BMI for individuals with Down syndrome
Low weight N=6 n (%)
1 (100) 5 (14.7) 0 (-) 0 (-)
Normal weight N=44
n (%)
0 (-) 29 (85.3) 14 (82.4) 1 (6.3)
Overweight N=8 n (%)
0 (-) 0 (-) 3 (17.6) 5 (31.3)
Obese N=10 n (%)
0 (-) 0 (-) 0 (-) 10 (62.5)
BMI: body mass index.
TABLE 3 Intake of macro- and micronutrients in 24 hours record.
Nutrient Overall Mean±SD
Low weight (n=6) Mean±SD
Normal weight (n=44) Mean±SD
Overweight (n=8) Mean±SD
Obesity (n=10) Mean±SD
p-value
Macronutrients
TEV (kcal) 1882.82±495.16 1664.67±347.76 1878.43±443.82 2218.25±806.70 1764.10±407.13 0.143 Carbohydrates (%) 54.45±11.35 58.51±10.04 52.91±12.33 59.13±9.01 55.01±8.49 0.406
Protein (%) 17.50±4.48 16.92±2.86 17.13±4.36 19.39±4.26 17.92±5.99 0.600 Lipids (%) 27.17±8.93 24.56±9.14 28.58±8.60 21.47±9.50 27.05±8.99 0.182
Micronutrients
Fiber (g) 19.89±9.65 14.34±2.71 20.30±8.98 24.76±13.59 17.52±10.56 0.196 Calcium (mg) 1126.06±963.72 1101.40±628.86 1081.47±880.43 1672.80±1645.49 899.63±743.03 0.364 Iron (mg) 14.81±6.58 13.40±8.72 13.90±5.00 19.20±6.35 16.13±10.24 0.166
Sodium (mg) 1626.72±940.93 869.36±445.24 1651.08±917.06 1916.69±1024.22 1741.98±1082.61 0.185 Zinc (mg) 10.37±4.08 7.79±3.70 10.22±4.19 11.96±3.41 11.27±3.97 0.248 Vitamin A (RE) 749.90±1037.9 752.22±745.53 681.07±801.83 701.17±1008.49 1090.33±1921.80 0.741
Vitamin E (aTE) 5.12±2.38 3.51±1.98 5.44±2.02 3.50±1.97 5.97±3.49 0.034 Vitamin C (mg) 168.71±121.30 197.25±203.97 111.27±146.83 183.99±288.26 69.74±101.82 0.338 Vitamin B12 (mcg) 6.47±3.98 2.16±0.80 3.94±6.85 7.66±9.26 2.35±1.91 0.302
Saturated FA (g) 22.45±15.33 17.57±9.70 23.48±13.99 24.78±25.91 18.99±14.14 0.691 Monounsaturated
FA (g)
17.94±10.77 11.38±5.78 19.02±10.42 18.16±15.01 16.93±10.77 0.438
Polyunsaturated FA (g)
9.03±4.53 4.45±2.56 9.68±4.11 7.31±4.40 10.25±5.78 0.031
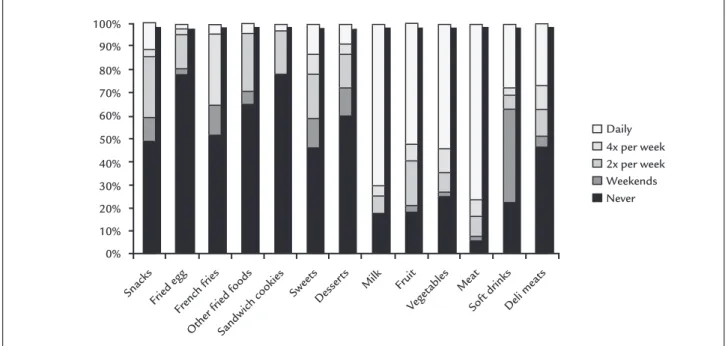
Food frequency is described in Figure 1, where it was observed that 48.5% (n=33) never consume snacks, 77.9% (n=53) never consume fried egg, 51.5% (n=35) never con-sume French fries, 64.75 (n=44) never concon-sume other fried foods, 77.9% (n=53) never consume sandwich cookies, 45.6% (n=31) never consume sweets, and 60.3% (n=41) never consume desserts. We also observed daily consump-tion of milk by 70.6% (n=48), of fruit by 52.9% (n=36), veg-etables by 54.4% (n=37), and of meat by 76.5% (n=52).
Figure 2 shows the nutritional status of the popu-lation studied according to the classiications by age,
so that normal weight was more frequent in all age groups.
D
ISCUSSIONIn this cross-sectional study, we observed that children and adolescents with DS have, in most cases, BMI suit-able for age, when evaluated by speciic curves for DS. With regard to eating habits, there was an adequate
in-take of nutrients according to the recommendations and association between BMI classiication and intake of poly-unsaturated fatty acids and vitamin E.
Daily 4x per week 2x per week Weekends Never
Snacks Fried egg
French fries Other fried f
oods
Sandwich cookies
SweetsDesser ts
Milk Fruit
Veget ables Meat
Soft drinksDeli meats
100%
90%
80%
70%
60%
50%
40%
30%
20%
10%
0%
FIGURE 1 Distribution of food frequency.
FIGURE 2 Nutritional status according to specific curves for DS. Pre-schoolers: 2 to 5 years; school-aged: 6 to 9 years; pre-adolescents: 10 to
14 years; adolescence: 15 to 17 years; late-adolescence: 18 to 19 years.
Obese
Overweight
Normal weight
Pre-schoolers (n=20)
School-aged (n=18)
Pre-adolescents (n=18)
Adolescence (n=8)
Late-adolescence (n=4)
Low weight 20%
50%
77.8%
27.8%
66.7%
25%
75%
50%
50%
30%
16.7%
5.5%
The prevalence of overweight and obesity was lower than expected in this study comparing the BMI curves
for age as recommended by the WHO11 and the curves
speciic for DS.4 We can raise some important aspects to understand these indings. First, the growth curves for DS take into account the smallest increase in weight and height and therefore the value of the BMI should be clas-siied differently than the growth curves for children with-out DS.4,6
Even though BMI for gender and age is the method of choice for assessing nutritional status as recommend-ed by the WHO, different studies14-16 only adopt weight/ age and height/age curves as proposed by Cronk et al.6 The prevalence of overweight in these studies varies be-tween 16 and 30%. In people with DS, the basal metabol-ic rate is signifmetabol-icantly lower than that of individuals matched by age and gender without the syndrome.17 This may explain in part why people with DS are classiied more often as overweight and/or obese.
For example, in our study, 85.3% of individuals clas-siied as normal weight according to the curve speciic for DS, would be 6.3% obese or 82.4% of overweight accord-ing to the WHO curves. In practice, in the absence of spe-ciic curves, or in the routine of professionals, when there are limitations to their use, it is important to monitor the growth and development of these children. If the curves used are those recommended by the WHO, it should be kept in mind that the interpretation will be different. At the Pediatric Cardiology Clinic of Instituto de Car-diologia, patients with DS are also treated by nutrition-ists in order to primarily prevent cardiovascular risk fac-tors. Therefore, these patients and caregivers can receive nutritional guidance to adopt eating habits healthier than those expected in the general population.18-20
Eating habits were adequate in this population. Nu-trition education occurs in childhood, so it is important to offer a healthy diet, with the introduction of varied foods, appropriate for the age and development of chil-dren and adolescents. Thus, nutritional management is critical for young people who have cardiovascular risk factors such as obesity. Children and adolescents with this genetic abnormality should have a healthy diet, adapt-ed to their clinical conditions. According to the data col-lected in our study based on a 24-hour record, most par-ticipants of both genders consume adequate amounts of carbohydrate, protein and lipids according to the Dietary Reference Intakes (DRI) recommendations.21
The prevalence of overweight and obesity in children with congenital heart disease was similar to that described in the literature for children with non-congenital disease.
In Brazil, the high prevalence of overweight in children and adolescents, in general, has been a cause for concern, because other risk factors for ischemic heart disease such as high blood pressure, glucose intolerance, dyslipidemia and sedentary lifestyle have emerged. These modiiable risk factors have been well discussed in the literature on children without heart disease.22
Vitamin E, which in this study was associated with the classiication of BMI, is a fat-soluble antioxidant that occurs naturally. This micronutrient has been proposed for the prevention and protection of cardiovascular events.23-26 But although studies have 15 or more years of follow up, vitamin E supplementation in the prima-ry and secondaprima-ry prevention of acute myocardial infarc-tion (AMI) and atherosclerosis has not yet demonstrat-ed statistical difference between groups.23-26
Some limitations of this study should be considered. Since this is a cross-sectional study, without monitoring over time, it was not possible to establish a temporal re-lationship between eating habits and the presence of overweight in individuals with DS. In our study, in par-ticular, the indings of healthy eating and normal mac-ronutrient distribution among children and adolescents with DS can be explained as the awareness of the prob-lem by families, with action taken towards habit chang-es. Rigorous clinical monitoring of this group of patients may have been an inluence, although that cannot be di-rectly stated based on the study. Thus, our data can con-tribute to the planning of new studies with follow-up over time or intervention.
Given the results of this study, the need for people with Down syndrome to receive unique attention from health teams is observed. Even though this study includes a small sample, we were able to demonstrate that chil-dren with this condition can present appropriate param-eters, receiving a nutritionally adequate and balanced diet in terms of macro- and micronutrients, and being phys-ically active. Encouraging health professionals to strength-en family members and/or legal guardians to seek prop-er monitoring of these children from birth, enabling adequate and healthy development, is essential for this to occur properly.
The almost complete lack of national data, the rele-vance of the topic, and indings consistent with other stud-ies show the importance of monitoring, thorough investi-gation and proper anthropometric assessment in patients with DS. Thus, the present indings can serve as a basis for planning studies of dietary intervention and/or physical activity, as well as planning of preventive measures.
C
ONCLUSIONThe results of this study showed that children and ado-lescents with DS are mostly considered as normal weight for age when evaluated using BMI curves speciic for DS, taking into account and highlighting the importance of a different interpretation for the growth and develop-ment of these individuals. With regard to eating habits, there was an adequate intake of nutrients according to the recommendations and association between BMI clas-siication and intake of polyunsaturated fatty acids and vitamin E.
A
CKNOWLEDGMENTSWe thank the IC-FUC/RS, for their support to the re-search project, our families, and the medical team at PREVINA (Pediatric Preventive Cardiology Clinic), with-out whom it would have been impossible to develop the study.
R
ESUMOCurvas de crescimento na síndrome de Down com car-diopatia congênita
Objetivo: avaliar hábitos alimentares, estado nutricional e frequência alimentar em crianças e adolescentes com síndrome de Down (SD) portadores de cardiopatia con-gênita (CC). Adicionalmente, procurou-se comparar clas-siicações de índice de massa corpórea (IMC) de acordo com curvas da Organização Mundial da Saúde (OMS) e curvas desenvolvidas para indivíduos com SD.
Método: estudo transversal com indivíduos portadores
de SD e CC atendidos em um centro de referência para cardiologia, com idade entre 2 e 18 anos. Foram aferidos peso, altura, IMC, valor energético total (VET) e frequên-cia alimentar. O estado nutricional foi analisado por meio de IMC para gênero e idade, utilizando-se curvas especí-icas para SD e curvas da OMS.
Resultados: foram avaliados 68 indivíduos portadores de SD com CC. O defeito do septo atrioventricular (DSAV) foi a cardiopatia mais frequente (52,9%). Houve
diferen-ça de classiicação do IMC entre as curvas propostas para portadores de SD e pela OMS. Houve associação entre consumo de vitamina E e ácidos graxos poli-insaturados.
Conclusão: resultados mostraram que indivíduos com
SD são, em sua maioria, considerados eutróicos para a idade quando avaliados pelas curvas especíicas para SD. Avaliá-los de acordo com as curvas especíicas para SD
se-ria o recomendado para a prática dos proissionais da saú-de, evitando-se diagnósticos precipitados de sobrepeso e/ ou obesidade nessa população.
Palavras-chave: síndrome de Down, avaliação
nutricio-nal, antropometria, índice de massa corporal.
R
EFERENCES1. De Onis M, Blössner M, Borghi E. Global prevalence and trends of overweight and obesity among preschool children. Am J Clin Nutr. 2010; 92(5):1257-64.
2. Luft VC, Mello ED. Síndrome de Down: supervisão em saúde, aspectos nutricionais e manejo. Revista Nutrição em Pauta. 2006; XIV(78):19-23. 3. Soares FA, Ávila e Lara M, Kowalski M. A longevidade na síndrome de Down.
FIEP Bulletin On-line. 2009; 79(1).
4. Myrelid A, Gustafsson J, Ollars B, Annerén G. Growth charts for Down’s syndrome from birth to 18 years of age. Arch Dis Child. 2002; 87(2):97-103. 5. Bravo-Valenzuela NJ, Passarelli ML, Coates MV, Nascimento LF. Weight and height recovery in children with Down syndrome and congenital heart disease. Rev Bras Cir Cardiovasc. 2011; 26(1):61-8.
6. Cronk C, Crocker AC, Pueschel SM, Shea AM, Zackai E, Pickens G, et al. Growth charts for children with Down syndrome: 1 month to 18 years of age. Pediatrics. 1988; 81(1):102-10.
7. Monteiro FPM. Estado nutricional de crianças portadoras de cardiopatias congênitas: avaliação de medidas antropométricas [dissertation]. Fortaleza: Universidade Federal do Ceará; 2009.
8. Cunha AMFV, Blascovi-Assis SM, Fiamenghi Jr GA. Impacto da notícia da síndrome de Down para os pais: histórias de vida. Ciênc saúde coletiva. 2010; 15(2):445-51.
9. Soar C. Índices antropométricos no diagnóstico de sobrepeso e obesidade de escolares de uma instituição pública de Florianópolis, SC [dissertation]. Florianópolis: Universidade Federal de Santa Catarina; 2003.
10. Roieski IM, Lima e Silva I, Cardoso FB, Beresford H. Avaliação do peril nutricional de adolescentes com síndrome de Down: pressuposto epistemológico para um aconselhamento nutricional com enfoque na ergomotricidade. Amazônia: Science & Health. 2014; 2(2):21-8. 11. Ministério da Saúde. Curvas de Crescimento da Organização Mundial da
Saúde - OMS. 2006/2007. Available from: http://dab.saude.gov.br/portaldab/ ape_vigilancia_alimentar.php?conteudo=curvas_de_crescimento. 12. Barbiero SM, Pellanda LC, Cesa CC, Campagnolo P, Beltrami F, Abrantes
CC. Overweight, obesity and other risk factors for IHD in Brazilian schoolchildren. Public Health Nutr. 2009; 12(5):710-5.
13. Trumbo P1, Schlicker S, Yates AA, Poos M; Food and Nutrition Board of the Institute of Medicine, The National Academies.. Dietary reference intakes for energy, carbohydrates, iber, fat, fatty acids, cholesterol, protein and amino acids. J Am Diet Assoc. 2002; 102(11):1621-30.
14. Lopes Tde S, Ferreira DM, Pereira RA, Veiga GV, Marins VM. Assessment of anthropometric indexes of children and adolescents with Down syndrome. J Pediatr (Rio J). 2008; 84(4):350-6.
15. Chumlea WC, Cronk CE. Overweight among children with trisomy 21. J Intellect Disabil Res.1981; 25(4):275-80.
16. Zini B, Ricalde SR. Características nutricionais das crianças e adolescentes portadoras de síndrome de Down da APAE de Caxias do Sul e São Marcos– RS. Pediatria. 2009; 31(4):252-9.
18. Akabas SR, Chouinard JD, Bernstein BR. Nutrition and physical activity in health promotion and disease prevention: potential role for the dental profession. Dent Clin North Am. 2012; 56(4):791-808.
19. Simões LRC. Avaliação nutricional e antropométrica de crianças de 06 e 36 meses, com síndrome de Down, e oferta de oicinas de culinária à suas famílias–Fundação Dom Bosco–BH. Sepex – Semana de Pesquisa e Extensão do Uni – BH 2007; IV; 30-7.
20. González-Agüero A, Vicente-Rodríguez G, Gómez-Cabello A, Ara I, Moreno LA, Casajús JA. A combined training intervention programme increases lean mass in youths with Down syndrome. Res Dev Disabil. 2011; 32(6):2383-8. 21. Shabayek MM. Assessment of the nutritional status of children with special needs in Alexandria: I. Nutrient intake and food consumption. J Egypt Public Health Assoc. 2004; 79(3-4):225-41.
22. Barbiero SM, D’Azevedo Sica C, Schuh DS, Cesa CC, de Oliveira Petkowicz R, Pellanda LC. Overweight and obesity in children with congenital heart disease: combination of risks for the future? BMC Pediatr. 2014; 14:271.
23. Vardi M, Levy NS, Levy AP. Vitamin E in the prevention of cardiovascular disease: the importance of proper patient selection. J Lipid Res. 2013; 54(9):2307-14.
24. Virtamo J, Rapola JM, Ripatti S, Heinonen OP, Taylor PR, Albanes D, et al. Effect of vitamin E and beta carotene on the incidence of primary nonfatal myocardial infarction and fatal coronary heart disease. Arch Intern Med. 1998; 158(6):668-75.
25. Sacco M, Pellegrini F, Roncaglioni MC, Avanzini F, Tognoni G, Nicolucci A; PPP Collaborative Group. Primary prevention of cardiovascular events with low-dose aspirin and vitamin E in type 2 diabetic patients: results of the Primary Prevention Project (PPP) trial. Diabetes Care. 2003; 26(12):3264-72.