Incorporating Canopy Cover for
Airborne-Derived Assessments of Forest Biomass in the
Tropical Forests of Cambodia
Minerva Singh1*, Damian Evans2, David A. Coomes1, Daniel A. Friess3, Boun Suy Tan4, Chan Samean Nin5
1Forest Ecology and Conservation Group, David Attenborough Building, Department of Plant Sciences,
Downing Street, University of Cambridge, Cambridge, CB2 3EA, United Kingdom,2École française
d’Extrême-Orient, Siem Reap, Cambodia,3Department of Geography, National University of Singapore, 1
Arts Link, 117570 Singapore, Singapore,4APSARA National Authority, Angkor International Research and
Documentation Centre, Siem Reap, Cambodia,5APSARA National Authority, Department of Forestry
Management, Cultural Landscape and Environment, Siem Reap, Cambodia
*ms2127@cam.ac.uk
Abstract
This research examines the role of canopy cover in influencing above ground biomass (AGB) dynamics of an open canopied forest and evaluates the efficacy of individual-based and plot-scale height metrics in predicting AGB variation in the tropical forests of Angkor Thom, Cambodia. The AGB was modeled by including canopy cover from aerial imagery alongside with the two different canopy vertical height metrics derived from LiDAR; the plot average of maximum tree height (Max_CH) of individual trees, and the top of the canopy height (TCH). Two different statistical approaches, log-log ordinary least squares (OLS) and support vector regression (SVR), were used to model AGB variation in the study area. Ten different AGB models were developed using different combinations of airborne predictor variables. It was discovered that the inclusion of canopy cover estimates considerably improved the performance of AGB models for our study area. The most robust model was log-log OLS model comprising of canopy cover only (r = 0.87; RMSE = 42.8 Mg/ha). Other models that approximated field AGB closely included both Max_CH and canopy cover (r = 0.86, RMSE = 44.2 Mg/ha for SVR; and, r = 0.84, RMSE = 47.7 Mg/ha for log-log OLS). Hence, canopy cover should be included when modeling the AGB of open-canopied tropical forests.
Introduction
Tropical forests sequestered 2.4 ± 0.4 pentagrams of carbon annually from 1990–2007, making them an important terrestrial carbon sink [1]. However, tropical land use changes, especially those leading to deforestation can contribute to carbon emissions from these carbon stocks [1]. From 2001–14, at 14.4%, Cambodia had the fastest acceleration in the annual forest rate per annum [2]. This potentially leaves behind a largely degraded landscape containing fragments a11111
OPEN ACCESS
Citation:Singh M, Evans D, Coomes DA, Friess DA, Suy Tan B, Samean Nin C (2016) Incorporating Canopy Cover for Airborne-Derived Assessments of Forest Biomass in the Tropical Forests of Cambodia. PLoS ONE 11(5): e0154307. doi:10.1371/journal. pone.0154307
Editor:Benjamin Poulter, Montana State University, UNITED STATES
Received:May 16, 2015
Accepted:April 12, 2016
Published:May 13, 2016
Copyright:© 2016 Singh et al. This is an open access article distributed under the terms of the
Creative Commons Attribution License, which permits unrestricted use, distribution, and reproduction in any medium, provided the original author and source are credited.
Data Availability Statement:All relevant data are within the paper and its Supporting Information files.
of forest that have lower aboveground biomass (AGB) storage [3]. The development of meth-ods to accurately quantify AGB is important in the context of carbon cycle studies and also for conservation policies that monetize the carbon held in the forests of developing tropical coun-tries [4]. Traditional field based approaches for estimating AGB have provided the core data for forest carbon monitoring, but are limited their spatial scale, so are increasingly comple-mented by remote sensing data to generate maps of AGB [5].
Light detection and ranging (LiDAR) is a powerful tool for mapping AGB in tropical regions [6]. LiDAR-estimated top of the canopy height (TCH) has been found to relate closely to field-estimated AGB in some tropical forests [7]. LiDAR data have been extensively used for AGB monitoring of different types of tropical forests at different temporal and spatial scales. LiDAR data have been employed for mapping AGB across forests that have undergone varying levels of degradation in Indonesia [8] and across selectively logged forests of Brazil [9]. These data have also been employed for mapping variation in AGB at different spatial scales across different time periods in a closed canopy forest in French Guiana [10]. In addition to lowland tropical forest ecosystems, LiDAR derived metrics have produced robust AGB estimates for tropical sub-montane forests [11], open canopied forests [12] and tropical peat swamp forests [13].
Increasingly, LiDAR and aerial data are being used in combination with an image segmenta-tion technique, Object Based Image Analysis (OBIA) to study forest structure variables and AGB in tropical forests [14]. A recent study used a combination of airborne LiDAR and aerial imagery for characterizing the horizontal structure of a tropical forest in the Comoros Islands using OBIA [15]. Canopy height and horizontal structure variables were employed for delin-eating the dominant vegetation classes in the study area and generating a vegetation structure based land cover map [15]. During the OBIA, image segmentation is achieved by defining indi-vidual, non-overlapping objects (tree crowns in this case) and extracting the relevant spatial and spectral attributes of these features [16]. OBIA predicted that the variables had a strong positive correlation with the field measured values of these attributes, in addition to producing tree crown polygons that closely resembled the real forest tree crowns [17]. However, OBIA based approaches have not been used extensively for the monitoring of forest biophysical parameters in the tropics, even though they can produce more robust AGB estimates, at least in temperate coniferous forests [18].
We hypothesize that horizontal canopy cover influences AGB stocks in human modified open-canopied forest ecosystems [19], in addition to TCH [7], which is a plot aggregate allom-etry only [20], LiDAR based tree height estimates scaled up from individual trees to plot scale will potentially provide more robust AGB estimates [21,22,23]. With this in mind, the research has made use of three predictor variables–percentage canopy cover, TCH, and Max_CH. The percentage canopy cover (derived from aerial imagery) is used to represent the horizontal structure of the canopy while the TCH represents the vertical structure of the canopy. Max_CH is a new metric that has been synthesized as a part of this research. This metric is based on maximum heights of individual trees derived by segmenting individual trees (from LiDAR using OBIA) and scaling up these maximum heights to the plot scale. Individual LiDAR tree heights have been employed for AGB estimation in the past [24].
The main aim of the research was to build an AGB estimation model for Angkor Thom using a combination of field to calibrate airborne LiDAR data. In particular, we highlight the role horizontal canopy cover plays in influencing AGB, alongside vertical canopy metrics. In addition to using the two different vertical canopy structure for AGB modeling, this study has compared field measured plot scale heights with the two LiDAR derived height metrics study design, data collection and analysis, decision to
publish, or preparation of the manuscript.
Materials and Methods
Study area
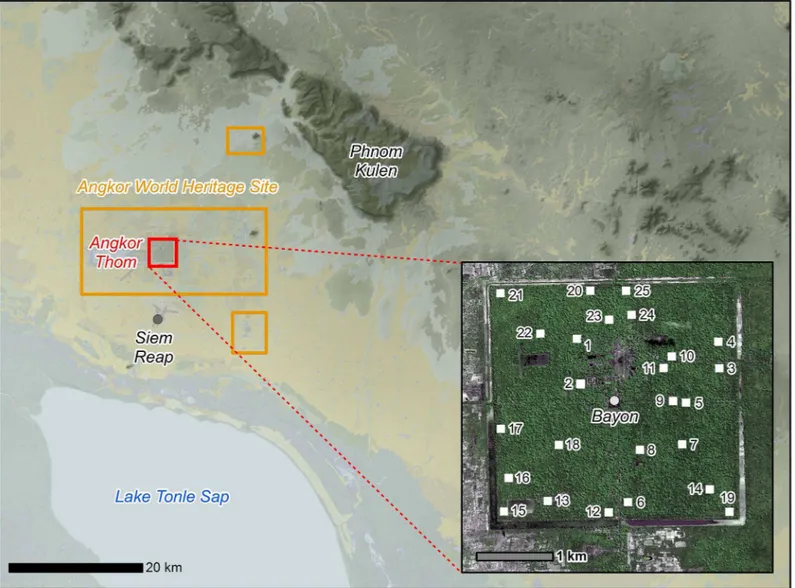
The Angkor Thom complex within the World Heritage Site of Angkor (Siem Reap Province, Cambodia) covers 9 km2(red box,Fig 1) and comprises of several important archaeological sites, including the iconic Bayon temple. Angkor Thom is an important heritage site, character-ized as a“living landscape”within which management to conserve biological diversity must be reconciled with supporting cultural/religious beliefs and livelihoods [25]. Angkor Thom is one of 33 tropical sites, covering 26 million hectares of land that have been designated as World Heritage Sites (WHSs) since 1999. The forests of Angkor Thom and the wider Angkor Archae-ological Park are moist tropical forests that experience strong seasonal variations in rainfall. These forests lie within the Central Indochina Dry Forest eco-region characterized by dry Dip-terocarp forests and are vital components of this ecological province [26], but have come under
Fig 1. Map of the study area.Location of the Angkor World Heritage Site/ Angkor Archaeological Park, background data courtesy of NASA-SRTM/ JICA-MPWT. Insert: Aerial view of the walled city of Angkor Thom showing the 25 one-hectare forest monitoring plots (IKONOS data courtesy of Space Imaging LLC).
pressure from increasing human population density, large-scale resource extraction, deforesta-tion and degradadeforesta-tion [27].
Field data
Twenty five one-hectare plots were established randomly within the forested portion of Angkor Thom (seeFig 1). A one-hectare plot size was selected because the RMSE of LiDAR-derived AGB estimates decreases exponentially with increasing plot size, and previous work suggests that uncertainty reaches acceptable level at this area [28,29,6]. Stratification was conducted based on the four forest quarters created by the north, south, east and west roads of Angkor Thom. The forested areas leading towards Angkor Thom have faced different levels of anthro-pogenic disturbance owing to their varying distances from human settlements. Plots were ran-domly located within each of the quadrants. A preliminary survey of the forests indicated significant anthropogenic disturbance.
Plots were sampled in December 2013 using the procedures of Marthews et al. [30]. Stem diameter at breast height (DBH, incm) was recorded for all trees where DBH10 cm (seeS1 Table). Total tree height (H, inm) of 150 randomly selected trees was measured using a cli-nometer [31], which can produce robust results even when the crown top is not visible [32], and log-log linear regression was used to derive the following relationship between DBH and H (Eq 1), as recommended by Feldpausch et al. [33], with R2= 0.75, p<0.01:
lnðHÞ ¼0:292lnðDBHÞ þ2:1 ð1Þ
This equation was then used to estimate the heights of all remaining trees in the plots, from their measured DBHs. The aboveground biomasses of all individual trees in the plot (AGBtree
in kg) were then calculated using the standard allometric equation (Eq 2) for moist forests of Chave et al. [34]:
AGB¼0:0673r ðDBH2HÞ0:976; ð2Þ
where,ρis specific wood density; a mean value of 0.57 Mg/m3was used as the value for individ-ual tree species in the study area [35].
Airborne imagery
LiDAR data were acquired in April 2013, when there was the least amount of leaf cover on the trees, using a helicopter-mounted Leica ALS60 laser system. A Honeywell CUS6 inertial mea-surement unit was used to register aircraft orientation at 200 Hz [36], and absolute positional information was acquired using a Novatel L1/L2 GPS antenna. A flying height of 800 m above ground level and an average speed of 80 km/h were chosen, with a field of view of 45° for the laser scanner and 46° for the camera equipped with a 60-mm lens. The pulse rate of the ALS60 was 120 kHz, with full waveform acquired across a swath width averaging 650 m. The aircraft flew adjacent flight lines in opposing directions with a significant overlap between swaths, resulting in about four returns/pulses and a point density of about 12 points m-2. The LiDAR
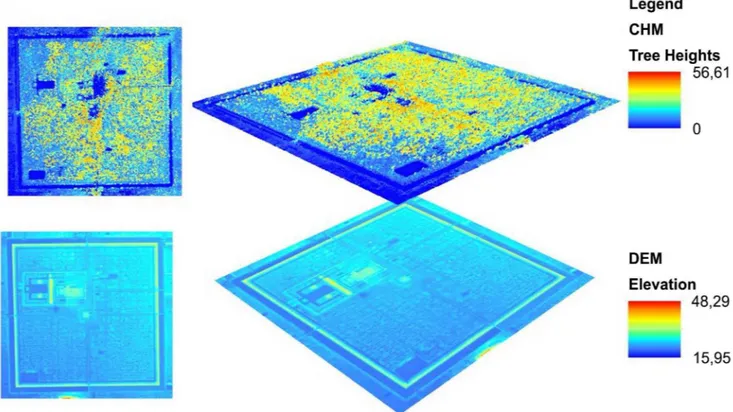
data were divided into ground and vegetation returns, using method [36]. Ground returns were used to derive a Digital Elevation Model (DEM) (Fig 2), while vegetation returns were used to generate a Canopy Height Model (CHM) giving the upper boundary of the canopy [37]. The CHM and DEM were generated using FUSION/LDV v.3.42 [38] at a resolution of 1m. TCH was obtained from the CHM clipped for each plot, as described by Mascaro et al. [7].
this information in conjunction with spatial context to categorize and collate individual seg-ments into discrete objects [14]. Multi-resolution segmentation was conducted using eCogni-tion software [14], where significant objects such as tree crowns were segmented one at a time, instead of attempting to segment the entire image simultaneously [17]. Individual tree crown-delineation of the entire LiDAR survey produced maximum tree heights of individual trees within each plot, which were averaged to give a plot-scale maximum canopy height estimate (henceforth referred to as Max_CH). This is more of an individual tree approach as compared to TCH which is a plot scale metric.
Aerial Imagery
Very High Resolution (VHR) imagery was acquired concurrently with the LiDAR data using a 40-megapixel Leica RCD105 medium-format camera. The imagery comprised of three bands (red, green and blue), with a spatial resolution of 8cm. Radiometric correction and orthorectifi-cation were conducted by the data provider.
Manual digitization was employed to estimate percentage canopy cover from the VHR imagery, which is suitable for the delineation of individual trees as solid objects providing com-plete cover [39]. The summed area of all the digitized tree crowns within a plot, divided by the area of the plot, gives fractional canopy cover [40]. This method allows us to extract trees cano-pies accurately and leave aside bushes, shrubs (small vegetation) and shadows. The canopy cover extracted from the VHR imagery was obtained by taking 20–25 densitometer readings at random locations within each plot [39] (SeeS2 Table).
Fig 2. The Digital Elevation Model and the Canopy Height Model of the study area.
Statistical Modeling
Multiple linear regression is the most common methods used to generate LiDAR-based bio-mass estimation equations. Arguably, however, relationships like these arise from fundamen-tally complex processes, with a number of interacting and intertwined drivers behind them. In contrast, machine learning methods are based on assumption that processes are unknown and likely to be complex. Support vector regression (SVR) is generally considered to produce robust results in the context of remote sensing. SVR deals with the inherent complexity and non-lin-earity of the data by using kernel functions to map the original input space into a new feature space with higher dimensions [41,42].
Previous work suggests the relationship between field-estimated AGB and LiDAR-estimated TCH is best described by a power law relationship [43]. In order to implement this, a log-log linear regression model was fitted, of the form [10]
lnðAGBÞ ¼aþb xLnðPredictor VariableÞ þe; ð3Þ
whereaandbare parameters and the residuals e are normally distributed and homogeneous. This relationship was extended by including additional variables such canopy cover and Max_CH in the linear model [10]. Alternative regression models were explored that included Max_CH instead of TCH;five log-log linear models were developed including different combi-nations of the three predictor variables. In all these cases, back-transformation was carried out using the Baskerville correction which produced the following model (Eq 4) [10] where RSE is the residual standard error.
AGB¼exp aþRSE
2
2 þbLn predictor variableð Þ
ð4Þ
In addition, SVR modeling was carried out (with radial bias function or RBF as the kernel) using thecaret packageof the R statistical framework [44]. In all,five SVR based models were developed which used different combinations of the three predictor variables under consider-ation. A total of ten models were compared—five utilizing OLS regression (log-log) andfive utilizing SVR.
variables. The former quantifies the % contribution of independent variables in explaining var-iance while the latter quantifies the relative contribution of predictor variables. Additionally, Random Forest (RF) was also used for identifying the % contribution of individual variables The research examined whether field measured tree height, Max_CH and TCH are signifi-cantly different using a Friedman test; a non-parametric test which is appropriate for paired data.
Results
Field measured tree heights (19.53±0.2m), TCH (18.84±1.17m) and Max_CH (20.2 ± 1.03m) were not statistically different from each other (Friedman test, p>0.05). The mean height of
trees delineated within the LiDAR imagery (i.e. Max_CH) and average field tree heights had a mean difference of 60 cm. The average difference between field-measured height and TCH was slightly greater, at 69 cm, which is to be expected because TCH was integrated over the entire canopy, not just the tree tops.
Performance of the AGB estimation models
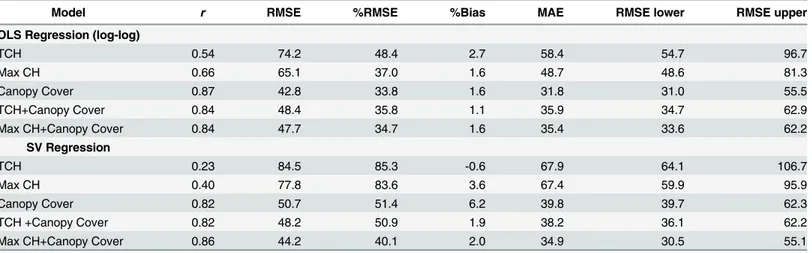
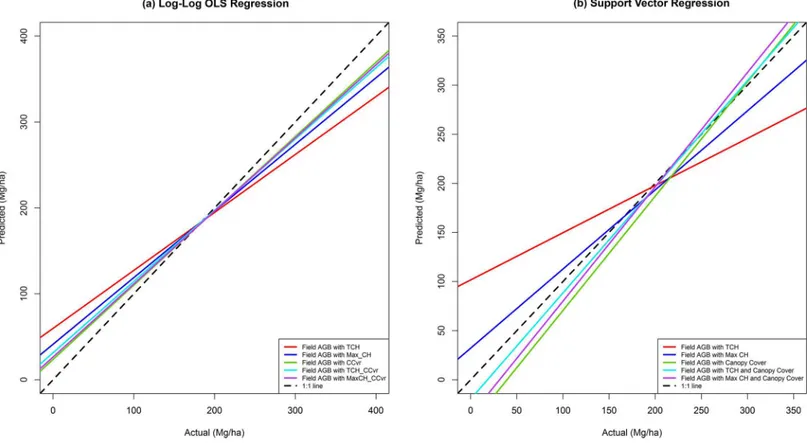
Aboveground biomass (dry mass) ranged between 49–346 Mg/ha over the 25 plots (seeS3 Table). Comparison of five least-square-regression models and five SVR models indicated that the best-supported model used log-log regression and had canopy cover as the only explana-tory variable, closely followed by the SVR model that included both Max_CH and canopy cover (Table 1,Fig 3). The coefficient estimates, p values and R2of the five log-log linear regres-sion models are provided inS4 Table.
Fig 3graphically compares the performance of the ten models, showing the regression lines for the field and LiDAR-predicted AGB using least squares regression (Fig 3A) and SVR (Fig 3B). The lines depict deviation of predicted AGB values from field AGB values. The lines were compared with the 1:1 relation (black dashed lines). From the ten models, the most parsimoni-ous model was log-log OLS model comprised of canopy cover only. This model approximated the field AGB values with highest accuracy. After the log-log OLS canopy cover only model, the SVR regression and log-log OLS regression with Max_CH and canopy cover gave the clos-est prediction of field AGB values. Further, the predictive model with canopy cover only had a
Table 1. Summary of statistical performance of the ten alternative models used to predict AGB from aerial remote sensing data.The statistics
include Pearson’s correlation coefficient (r) between 25 observed and predicted AGB values, Root Mean Square Error (RMSE), % RMSE percent bias, MAE, lower and upper RMSE.
Model r RMSE %RMSE %Bias MAE RMSE lower RMSE upper
OLS Regression (log-log)
TCH 0.54 74.2 48.4 2.7 58.4 54.7 96.7
Max CH 0.66 65.1 37.0 1.6 48.7 48.6 81.3
Canopy Cover 0.87 42.8 33.8 1.6 31.8 31.0 55.5
TCH+Canopy Cover 0.84 48.4 35.8 1.1 35.9 34.7 62.9
Max CH+Canopy Cover 0.84 47.7 34.7 1.6 35.4 33.6 62.2
SV Regression
TCH 0.23 84.5 85.3 -0.6 67.9 64.1 106.7
Max CH 0.40 77.8 83.6 3.6 67.4 59.9 95.9
Canopy Cover 0.82 50.7 51.4 6.2 39.8 39.7 62.3
TCH +Canopy Cover 0.82 48.2 50.9 1.9 38.2 36.1 62.2
Max CH+Canopy Cover 0.86 44.2 40.1 2.0 34.9 30.5 55.1
low value of percent bias (+1.6%), indicating small deviation from the expected AGB values. Variable importance analysis carried out using hier.part showed that in terms of % individual contribution canopy cover was more important than Max_CH and TCH (46.4, 24.8 and 13.1%, respectively) in explaining the variation in field AGB respectively. Canopy cover, Max_CH and TCH have a joint contribution of 29.7%, 29.8% and 21.6%. Random Forest (RF) % contribution of variable importance was 32.46%, 25.00% and 21.55% for aerial canopy cover, Max_CH and TCH respectively.
Discussion
AGB Modeling in Angkor Thom
The canopy cover–an index of horizontal variation in canopy structure–has the highest % inde-pendent contribution in explaining AGB variation. The best performing model was the log-log OLS model with canopy cover only. Additionally, the predictive models containing canopy cover have performed better than those with LiDAR height measures only. This research has established the importance of canopy cover for estimating AGB values in an open canopied forest. Recent works used combinations of vertical height and canopy cover metrics to improve AGB estimations such as in the works of Singh et al. [12] and Li et al. [50] and suggest the inclusion of horizontal canopy structure estimates (such as canopy cover) improves AGB pre-diction models for more open canopied ecosystems. These results may be explained on the basis of Drake et al. [19] according to which horizontal variables, such as canopy cover, play an important role in explaining AGB variation in open-canopied tropical forests. This maybe cor-roborated by research done by Coomes et al. which demonstrated that canopy cover and
Fig 3. LiDAR predicted AGB estimates compared with the field estimates for the ten models.
structure related variables (such as NDVI) are effective for modeling AGB in open shrub-lands [51]. The role of horizontal canopy structure in complementing LiDAR derived vertical struc-ture for landscape scale forest strucstruc-ture has been previously reported [19,15,50]. Horizontal variables are important in explaining variation in AGB stocks and their exclusion from AGB estimation models can reduce accuracy [52]. Future AGB modeling in moist tropical ecosys-tems would benefit by using horizontal variables such as canopy cover either alone or in con-junction with vertical structure variables to produce robust AGB models.
While the difference between the five top performing models is not very high, they do pres-ent interesting insights which maybe be used to inform future research. For both categories (log-log regression and SVR), models with Max_CH produced slightly better results than Asner’s TCH metric. Scaling up from individual tree level to plot scale is a more intuitive approach as it closely follows the process of plot scale field AGB estimation. The latter also involves calculating the AGB of individual trees and scaling up to plot scale. Research by Col-gan et al. [53] indicates that inclusion of OBIA derived maximum height metrics significantly reduces error in the AGB models as compared to an average height metric. Our research estab-lishes the utility of individual tree height metrics in approximating average field tree heights and producing robust AGB predictive models. Upper layers of the canopy intercept most of the laser shots, hence it is expected individual LiDAR trees heights will correspond more strongly with the field measured tree heights and AGB estimates [24]. These results are in agreement with a similar study based in the temperate forests of Canada, which also utilized OBIA derived parameters from aerial and LiDAR data to develop AGB models [54]. The said model was developed using LiDAR data that covered 8.8% of the study area to produce a landscape wide estimate of AGB and volume in Canada [54]. In this research, Max_CH has been synthesized using pre-existing algorithms (OBIA in this case), for future research it would be informative to examine different ways of extracting individual tree characteristics, such as 3D segmentation directly from LiDAR point clouds and relating them with field data [17]. The top 5 AGB mod-els predicted AGB values accurately with slight over estimation. However these values are well within range of AGB biases reported for other ecosystems [43].
It must be noted that the canopy metrics deployed here are not the only horizontal and ver-tical metrics that can be used for AGB modeling. Hansen et al. [11] discovered that variables representing lower parts of the canopy and canopy density predicted AGB density better than height metrics in a sub-montane tropical forest in Tanzania. Two vertical height metrics- first quartile heights and variance of heights above ground returns were used to model AGB varia-tion in a selectively logged forest in Brazil [9]. Caution is needed when interpreting these results as more data are needed before being scaled in order to identify the environmental and bio-physical factors which influence AGB stocks and which models are more appropriate for the wider ecological province of Central Indochina Dry Forests. For instance, while a canopy cover only model has produced robust AGB estimates for this ecosystem, it is important to test the ability of canopy cover based AGB models in predicting the AGB values of other forest types, including forest types with varying canopy covers and heights.
Limitations of AGB modeling
plots did not have a dense canopy cover and the plot locations were visually cross-checked with the locations of important monuments and other easily identifiable structure.
This study applied the general allometric equation recommended by Chave et al. [34]. How-ever, AGB estimates are often hindered by a lack of site- and species-specific equations. Although local allometric models can produce more accurate AGB estimates, the development of such allometry needs substantial field data [56].
Both field measured and LiDAR predicted tree heights have associated measurement errors, which in turn can affect the efficiency of the AGB prediction model [6,57]. For instance, the precision of individual tree height measurements can vary between 3%-20% which in turn translates into 5%-9% uncertainty in AGB estimates at 1ha scale [58]. This study has used cli-nometers for measuring tree heights in the field. A recent comparison of ground-based meth-ods found that clinometer based- trigonometric methmeth-ods resulted in no systematic bias (non-laser method), or resulted in a small underestimate of actual tree height (ground (non-laser-based methods) compared to heights measured from an observational tower [32]. Clinometer mea-sured tree heights essentially produces 1:1 correspondence with actual tree heights, but the height of taller trees can significantly be overestimated. This approach produces low systematic error but high random errors [32]. Including height (whether field measured or DBH-height equation derived) can significantly reduce uncertainty in field AGB measures [33]. These meta-scale findings are further corroborated by Rutishauser et al. who argue that while measur-ing tree heights in tropical ecosystems (such as Indonesia) is fraught with uncertainties, includ-ing them reduced uncertainty in the overall AGB model [59]. This certainly builds a case for developing site specific H-DBH relationships. In this research at a plot scale, field measured tree heights, Max_CH and TCH did not vary significantly. However, the impact of high ran-dom errors produced as a result of taller trees needs to be evaluated in detail, as forests of SE Asia on an average have trees taller than those found in other tropical regions [33].
Comparison to other LiDAR-based studies of tropical forest AGB and
structural dynamics
The present study area encompasses a wide range of AGB values. In spite of a ban on logging, illegal resource extraction persists in many parts of the study area which explains such a wide variation in AGB values. Previous findings in Borneo indicate that selective logging can lead to 55%–66% AGB loss [60]. The wide range of AGB values in the study area is similar to the range of AGB values for mixed evergreen and semi-evergreen forests identified in the national-scale assessments of AGB in Cambodia [61]. This study confirms that local spatial variation in forest cover and AGB is fraught with uncertainty, which in turn has implications for carbon conservation activities such as REDD+ [62]. Such wide variation of AGB in a relatively small area indicates the need to build high resolution AGB maps at a local scale (based on locally rel-evant predictor variables) and scaling these to landscape or regional scale.
Conclusions
This study develops an AGB-estimation method for the temple forests around Angkor Thom. Two distinct approaches are used for AGB modeling—log-log regression and the support vec-tor regression. The canopy cover-only AGB model and the models that included of canopy cover along with height produced robust estimates AGB in the open canopied tropical forests of Angkor Thom compared to height only models. Inclusion of the two height metrics (the plot scale TCH and individual tree height based Max_CH) in the different models confirm the role of the latter, an individual scale metric scaled up to plot level in predicting AGB variation with a higher level of accuracy compared to the plot scale TCH. It is expected that scaling these models will produce improved AGB estimates at landscape scales for ecosystems that suffer from high levels of anthropogenic disturbance. This study has provided valuable insights into the structural variation present in the said ecosystem and the ability of airborne data to predict this. Conservation instruments like the REDD+ require highly accurate quantification of parameters such as AGB and carbon, which can be obtained by using a combination of field and airborne data. Further works will extend airborne data-based approaches to open-cano-pied tropical forests
Supporting Information
S1 Table. Measured DBH and Tree Heights.
(DOCX)
S2 Table. Ground canopy cover and aerial canopy cover for each of the 25 plots.
(DOCX)
S3 Table. Field height measurements, top of the canopy height (TCH), maximum canopy height (Max_CH) measurements and field measured above ground biomass for each of the 25 plots.
(DOCX)
S4 Table. Coefficient Parameter Estimates and R2of Log-Log Linear Regression models.
(DOCX)
Acknowledgments
The APSARA National Authority granted permission to undertake a field research in the Ang-kor Thom area, and Bun Chamrouen and Ley Kimsy assist in the field. So Malay, Martin Polk-inghorne, Son Rothaphum and the Robert Christie Foundation contributed to logistical and administrative aspects of the field program. PT McElhanney Indonesia acquired LiDAR data and VHR imagery. Support and funding was provided by eight institutions of the Khmer Archaeology LiDAR Consortium: the APSARA Authority, the University of Sydney, the École française d'Extrême Orient, Société Concessionaire d’Aéroport, the Hungarian Southeast Asian Research Institute, Japan-APSARA Safeguarding Angkor, the Archaeology and Development Foundation, and the World Monuments Fund.
Author Contributions
Helped in improving idea expression and overall write up: DF. Editing and modification of arguments: DC. Field work logistics: BST CSN.
References
1. Pan Y, Birdsey R, Fang J, Houghton R, Kauppi PE, Kurz W, et al. A large and persistent carbon sink in
the world’s forests. Science. 2011; 333(6045): 988–993. doi:10.1126/science.1201609PMID: 21764754
2. Petersen R, Sizer N, Hansen M, Potapov P, Thau D. Satellites Uncover 5 Surprising Hotspots for Tree
Cover Loss. [Online].; 2015 [cited 2015 December 05. Available from: HYPERLINK "http://www.wri.org/ blog/2015/09/satellites-uncover-5-surprising-hotspots-tree-cover-loss"http://www.wri.org/blog/2015/ 09/satellites-uncover-5-surprising-hotspots-tree-cover-loss.
3. Singh M, Malhi Y, Bhagwat S. Aboveground biomass and tree diversity of riparian zones in an oil palm-dominated mixed landscape in Borneo. Journal of Tropical Forest Science. 2015; 27(2): 227–239.
4. Asner GP, Mascaro J, Muller-Landau HC, Vieilledent G, Vaudry R, Rasamoelina M, et al. A universal
airborne LiDAR approach for tropical forest carbon mapping. Oecologia. 2012; 168(4): 1147–1160. doi:10.1007/s00442-011-2165-zPMID:22033763
5. Lu D. The potential and challenges of remote sensing based biomass estimates. International Journal
of Remote Sensing. 2006; 27(7): 1297–1328.
6. Asner G, Mascaro J. Mapping tropical forest carbon: Calibrating plot estimates to a simple LiDAR met-ric. Remote Sensing of Environment. 2014; 140: 614–624.
7. Mascaro J, Detto M, Asner G, Muller-Landau H. A Tale of Two“Forests”: Random Forest Machine Learning Aids Tropical Forest Carbon Mapping. PloS one. 2014; 9(1): e85993. doi:10.1371/journal. pone.0085993PMID:24489686
8. Kronseder K, Ballhorn U, Böhm V, Siegert F. Above ground biomass estimation across forest types at different degradation levels in Central Kalimantan using LiDAR data. International Journal of Applied Earth Observation and Geoinformation. 2012; 18: 37–48.
9. d'Oliveira MV, Reutebuch SE, McGaughey RJ, Andersen HE. Estimating forest biomass and identifying low-intensity logging areas using airborne scanning lidar in Antimary State Forest, Acre State, Western Brazilian Amazon. Remote Sensing of Environment. 2012; 124: 479–491.
10. Réjou-Méchain M, Tymen B, Blanc L, Fauset S, Feldpausch TR, Monteagudo A, et al. Using repeated small-footprint LiDAR acquisitions to infer spatial and temporal variations of a high-biomass Neotropical forest. Remote Sensing of Environment. 2015; 169: 93–101.
11. Hansen EH, Gobakken T, Bollandsås OM, Zahabu E, Næsset E. Modeling aboveground biomass in dense tropical submontane rainforest using airborne laser scanner data. Remote Sensing. 2015; 7(1): 788–807.
12. Singh M, Evans D, Friess DA, Tan BS, Nin CS. Mapping Above-Ground Biomass in a Tropical Forest in Cambodia Using Canopy Textures Derived from Google Earth. Remote Sensing. 2015; 7: 5057–5076.
13. Englhart S, Jubanski J, Siegert F. Quantifying dynamics in tropical peat swamp forest biomass with multi-temporal LiDAR datasets. Remote Sensing. 2013; 5(5): 2368–2388.
14. Mbaabu P. AGB / Carbon mapping using airborne lidar data and geoeye satellite images in tropical
for-est of Chitwan-Nepal: A comparison of community and government managed forfor-ests. Enschede, The Netherlands:; 2012.
15. Dupuy S, Lainé G, Tassin J, Sarrailh JM. Characterization of the horizontal structure of the tropical
for-est canopy using object-based LiDAR and multispectral image analysis. International Journal of Applied Earth Observation and Geoinformation. 2013; 25: 76–86.
16. Ke Y, Quackenbush L, Im J. Synergistic use of QuickBird multispectral imagery and LIDAR data for
object-based forest species classification. Remote Sens Environ. 2010; 114(6): 1141–1154.
17. Jakubowski M, Li W, Q G, Kelly M. Delineating individual trees from LiDAR data: A comparison of vec-tor-and raster-based segmentation approaches. Remote Sensing. 2013; 5(9): 4163–4186.
18. Leboeuf A, Beaudoin A, Fournier RA, Guindon L, Luther JE, Lambert MC. A shadow fraction method for mapping biomass of northern boreal black spruce forests using QuickBird imagery. Remote Sensing of Environment. 2007; 110(4): 488–500.
19. Drake J, Knox R, Dubayah R, Clark D, Condit R, Blair J, et al. Above‐ground biomass estimation in closed canopy neotropical forests using lidar remote sensing: Factors affecting the generality of rela-tionships. Global Ecology and Biogeography. 2003; 12(2): 147–159.
21. Vaglio Laurin G, Chen Q, Lindsell J, Coomes D, Cazzolla-Gatti R, Grieco E, et al. Above ground bio-mass estimation from lidar and hyperspectral airbone data in West African moist forests. In EGU Gen-eral Assembly Conference Abstracts. 2013; 15: 6227.
22. Gonzalez P, Asner GP, Battles JJ, Lefsky MA, Waring KM, Palace M. Forest carbon densities and uncertainties from Lidar, QuickBird, and field measurements in California. Remote Sensing of Environ-ment. 2010; 114(7): 1561–1575.
23. Zhao F, Guo Q, Kelly M. Allometric equation choice impacts lidar-based forest biomass estimates: A case study from the Sierra National Forest, CA. Agricultural and forest meteorology. 2012; 165: 64–72.
24. Popescu SC, Wynne RH, Nelson RF. Estimating plot-level tree heights with lidar: local filtering with a canopy-height based variable window size. Computers and Electronics in Agriculture. 2002; 37(1): 71– 95.
25. Wales N. Combining remote sensing change detection and qualitative data to examine landscape change in the context of world heritage zoning. In Institute of Australian Geographers Conference–‘Ba-lancing Choices and Effects in a Dynamic World’; 2012; James Cook University Cairns, Australia: Uni-versity of Sydney.
26. McShea WJ, Davies SJ, Bhumpakphan N. The ecology and conservation of seasonally dry forests in Asia. Washington, D.C.: Smithsonian Institution Scholarly Press; 2011.
27. Davis KF, Yu K, Rulli MC, Pichdara L, D’Odorico P. Accelerated deforestation driven by large-scale land acquisitions in Cambodia. Nature Geoscience. 2015; 8(10): 772–775.
28. Meyer V, Saatchi S, Chave J, Dalling J, Bohlman S, Fricker G, et al. Detecting tropical forest biomass
dynamics from repeated airborne lidar measurements. Biogeosciences. 2013; 10(8): 5421–5438.
29. Zolkos SG, Goetz SJ, Dubayah R. A meta-analysis of terrestrial aboveground biomass estimation using lidar remote sensing. Remote Sensing of Environment. 2013; 128: 289–298.
30. Marthews TR, Metcalfe D, Malhi Y, Phillips O, Huasco WH, Riutta T, et al. Measuring tropical forest car-bon allocation and cycling.: Version 2.2. Oxford, UK: Glob. Ecosyst. Monit. Netw; 2012.
31. Rennie JC. Comparison of height measurement techniques in a dense loblolly pine plantations. South-ern Journal of Applied Forestry. 1978 Mar;: 146–148.
32. Larjavaara M, Muller‐Landau HC. Measuring tree height: a quantitative comparison of two common field methods in a moist tropical forest. Methods in Ecology and Evolution. 2013; 4(9): 793–801.
33. Feldpausch TR, Banin L, Phillips OL, Baker TR, Lewis SL, Quesada CA. Height-diameter allometry of tropical forest trees. Biogeosciences. 2011; 8: 1081–1106.
34. Chave J, Réjou‐Méchain M, Búrquez A, Chidumayo E, Colgan MS, Delitti WB, et al. Improved allome-tric models to estimate the aboveground biomass of tropical trees. Global change biology. 2014; 20 (10): 3177–3190. doi:10.1111/gcb.12629PMID:24817483
35. Brown S. Estimating Biomass and Biomass Change of Tropical Forests: A Primer. Rome: FAO; 1997.
36. Evans D, Fletcher R, Pottier C, Chevance J, Soutif D. Uncovering archaeological landscapes at Angkor
using LiDAR. Proceedings of the National Academy of Sciences. 2013; 110(31): 12595–12600.
37. Popescu SC, Zhao K. A voxel-based lidar method for assessing crown base height. Remote Sensing of Environment. 2008; 112(3): 767–781.
38. McGaughey R. Fusion/LDV: Software for LiDAR data analysis and visualization [Computer program]. Seattle, WA, USA, 123: Forest Service, Pacific Northwest Research Station, US Department of Agricul-ture; 2010.
39. Jennings SB, Brown ND, Sheil D. Assessing forest canopies and understorey illumination: Canopy clo-sure, canopy cover and other measures. Forestry. 1999; 72(1): 59–73.
40. Ansley RJ, Ben Wu X, Kramp BA. Observation: long-term increases in mesquite canopy cover in a north Texas savanna. Journal of Range Management. 2001; 54(2): 171–176.
41. Jachowski NR, Quak MS, Friess DA, Duangnamon D, Webb EL, Ziegler AD. Mangrove biomass
esti-mation in Southwest Thailand using machine learning. Applied Geography. 2013; 45: 311–321.
42. Gleason CJ, Im J. Forest biomass estimation from airborne LiDAR data using machine learning approaches. Remote Sensing of Environment. 2012; 125: 80–91.
43. Asner GP, Mascaro J, Anderson C, Knapp DE, Martin RE, Kennedy-Bowdoin T, et al. High-fidelity national carbon mapping for resource management and REDD+. Carbon balance and management. 2013; 8(7).
44. Kuhn M. Caret: Classification and Regression Training. [Online].; 2014. Available from: HYPERLINK "http://caret.r-forge.r-project.org/training"http://caret.r-forge.r-project.org/training.
46. Cawley GC, Talbot NLC. On over-fitting in model selection and subsequent selection bias in perfor-mance evaluation. Journal of Machine Learning Research. 2010; 11: 2079−2107.
47. Castillo-Santiago MA, Ricker M, de Jong BH. Estimation of tropical forest structure from SPOT-5 satel-lite images. International Journal of Remote Sensing. 2010; 31(10): 2767–2782.
48. Zambrano-Bigiarini M. hydroGOF: Goodness-of-fit functions for comparison of simulated and observed
hydrological time series. R package version 0.3–2. 2011.
49. Walsh C, Nally M. R: Package‘hier.part’. 2012.
50. Li W, Niu Z, Gao S, Huang N, Chen H. Correlating the horizontal and vertical distribution of lidar point clouds with components of biomass in a picea crassifolia forest. Forests. 2014; 5(8): 1910–1930.
51. Coomes DA, Allen RB, Scott NA, Goulding C, Beets P. Designing systems to monitor carbon stocks in
forests and shrublands. Forest Ecology and Management. 2002; 164: 89–108.
52. Bastin J, Barbier N, Couteron P, Adams B, Shapiro A, Bogaert J, et al. Aboveground biomass mapping of African forest mosaics using canopy texture analysis: towards a regional approach. Ecological Appli-cations. 2014; 24(8): 1984–2001.
53. Colgan MS, Asner GP, Swemmer T. Harvesting tree biomass at the stand level to assess the accuracy of field and airborne biomass estimation in savannas. Ecological Applications. 2013; 23(5): 1170– 1184. PMID:23967584
54. Chen G, Hay GJ, Zhou Y. Estimation of forest height, biomass and volume using support vector regres-sion and segmentation from lidar transects and Quickbird imagery. In Geoinformatics, 2010 18th Inter-national Conference on IEEE. 2010.
55. Chen Q, Laurin GV, Valentini R. Uncertainty of remotely sensed aboveground biomass over an African tropical forest: Propagating errors from trees to plots to pixels. Remote Sensing of Environment. 2015; 160: 134–143.
56. van Breugel M, Ransijn J, Craven D, Bongers F, Hall JS. Estimating carbon stock in secondary forests: decisions and uncertainties associated with allometric biomass models. Forest Ecology and Manage-ment. 2011; 262(8): 1648–1657.
57. Molto Q, Hérault B, Boreux JJ, Daullet M, Rousteau A, Rossi V. Predicting tree heights for biomass esti-mates in tropical forests. Biogeosciences Discussions. 2013; 10(5): 8611–8635.
58. Hunter M, Keller M, Vitoria D, Morton D. Tree height and tropical forest biomass estimation. Biogeos-ciences Discussions. 2013; 10(6): 10491–10529.
59. Rutishauser E, Noor’an F, Laumonier Y, Halperin J, Hergoualc’h K, Verchot L. Generic allometric mod-els including height best estimate forest biomass and carbon stocks in Indonesia. Forest Ecology and Management. 2013; 307: 219–225.
60. Saner P, Loh YY, Ong RC, Hector A. Carbon stocks and fluxes in tropical lowland Dipterocarp rainfor-ests in Sabah, Malaysian Borneo. Plos One. 2012; 7(1): e29642. doi:10.1371/journal.pone.0029642 PMID:22235319
61. Avtar R, Suzuki RTW, Sawada H. PALSAR 50m mosaic data based national level biomass estimation in Cambodia for implementation of REDD+ mechanism. PLoS One. 2013; 8(10): e74807. doi:10.1371/ journal.pone.0074807PMID:24116012
62. Mitchard ET, Saatchi SS, Baccini A, Asner GP, Goetz SJ, Harris N, et al. Uncertainty in the spatial distri-bution of tropical forest biomass: a comparison of pan-tropical maps. Carbon Balance and Manage-ment. 2013; 8(1).
63. Agus F, Henson IE, Sahardjo BH, Harris N, Noordwijk V, Killeen TJ. Review of emission factors for
assessment of CO2 emission from land use change to oil palm in Southeast Asia. In Killeen ITJ, Goon J, editors. Reports from the Technical Panels of the Second RSPO GHG Working Group, Roundtable for Sustainable Palm Oil. RSPO, Kuala Lumpur; 2013. 7–28.