www.atmos-chem-phys.net/7/3783/2007/ © Author(s) 2007. This work is licensed under a Creative Commons License.
Chemistry
and Physics
Vertical ozone measurements in the troposphere over the Eastern
Mediterranean and comparison with Central Europe
P. D. Kalabokas1, A. Volz-Thomas2, J. Brioude3, V. Thouret4, J.-P. Cammas4, and C. C. Repapis1
1Academy of Athens, Research Center for Atmospheric Physics and Climatology, Athens, Greece 2Institut fuer Chemie and Dynamik der Geosphaere, Forschungszentrum Juelich, Germany 3NOAA, Earth System Research Laboratory CSD, Boulder, Colorado, USA
4Laboratoire d’Aerologie, UMR 5560, Universite Paul Sabatier, Toulouse, France
Received: 12 December 2006 – Published in Atmos. Chem. Phys. Discuss.: 15 February 2007 Revised: 27 June 2007 – Accepted: 17 July 2007 – Published: 23 July 2007
Abstract. Vertical ozone profiles measured in the period 1996–2002 in the framework of the MOZAIC project (Mea-surement of Ozone and Water Vapor by Airbus in Service Aircraft) for flights connecting Central Europe to the East-ern Mediterranean basin (Heraklion, Rhodes, Antalya) were analysed in order to evaluate the high rural ozone levels recorded in the Mediterranean area during summertime. The 77 flights during summer (JJAS) showed substantially (10– 12 ppb, 20–40%) enhanced ozone mixing ratios in the lower troposphere over the Eastern Mediterranean frequently ex-ceeding the 60 ppb, 8-h EU air quality standard, whereas ozone between 700 hPa and 400 hPa was only slightly (3– 5 ppb, 5–10%) higher than over Central Europe. Analysis of composite weather maps for the high and low ozone cases, as well as back-trajectories and vertical profiles of carbon monoxide, suggest that the main factor leading to high tro-pospheric ozone values in the area is anticyclonic influence, in combination with a persistent northerly flow in the lower troposphere during summertime over the Aegean. On the other hand the lowest ozone levels are associated with low-pressure systems, especially the extension of the Middle East low over the Eastern Mediterranean area.
1 Introduction
Tropospheric ozone gained attention 2–3 decades ago, when it was realized that increasing surface ozone levels observed in urban areas and at rural sites were attributable to enhanced photochemical production in the troposphere (Volz and Kley, 1988; Staehelin et al., 1994). Subsequently, research pro-grams and extended monitoring networks provided a rea-sonably comprehensive picture of the spatial distribution of surface ozone in Northern and Central Europe, whereas a
Correspondence to:P. D. Kalabokas (kalabokas [email protected])
(a) 300 400 500 600 700 800 900 1000
0 10 20 30 40 50 60 70 80 90 100 110 120
Ozone mixing ratio (ppb)
A tm o s p h e ri c p re s s u re ( h P a ) 90th 75th 50th 25th 10th (b) 300 400 500 600 700 800 900 1000
0 10 20 30 40 50 60 70 80 90 100 110 120
Ozone mixing ratio (ppb)
A tm o s p h e ri c p re s s u re ( h P a ) 90th 75th 50th 25th 10th
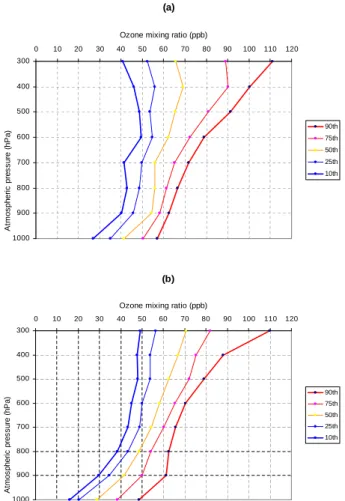
Fig. 1. Distribution statistics of summer (JJAS) vertical ozone
av-erages at the standard pressure levels: (a)in the Eastern
Mediter-ranean (77 profiles) and(b)in Central Europe (75 profiles).
2001; Lelieveld et al., 2002; Ziv et al., 2004).
The possibility for an influence of long range transport from the European continent, North America and Southeast Asia on ozone and its precursors over the Eastern Mediter-ranean has been discussed in several publications containing the results of two intensive measuring campaigns over the Aegean (MINOS and PAUR), which took place during re-cent years (e.g. Van Aalst et al., 1996; Lelieveld et al., 2002; Zerefos et al., 2002; Kourtidis et at., 2002; Kouvarakis et al., 2002; Gros et al., 2003; Roelofs et al., 2003; Sheeren et al., 2003; Traub et al., 2003; Volz-Thomas et al., 2003) The main results of the MINOS campaign (Lelieveld et al., 2002; Gros et al., 2003; Roelofs et al., 2003; Sheeren et al., 2003; Traub et al., 2003) regarding the primary and secondary trace gas concentrations of the lower and the middle troposphere of the Eastern Mediterranean were that in the boundary layer air quality standards regarding ozone are exceeded through-out the region, caused by West and East European pollution advected from the north. According to the main results of the PAUR campaign (Zerefos et al., 2002; Kourtidis et at.,
2002; Kouvarakis et al., 2002) concerning lower tropospheric ozone, long-range transport is the main factor contributing to enhanced ozone levels both at ground level and in the free troposphere and modelling results show that reductions of local emissions have little influence on ozone levels. In addition to the above observations, recent measurement and modelling studies suggest that polluted air masses exported from Switzerland towards the Mediterranean in summer ex-hibit high ozone production rates (Henne, 2005).
The aim of this work is to further investigate the high sum-mer rural ozone levels in the boundary layer around Athens and the Aegean Sea, using vertical ozone profiles collected over the Eastern Mediterranean within the MOZAIC project (Marenco et al., 1998; Thouret et al., 1998; Sauvage et al., 2005; Thouret et al., 2006) during flights connecting the Eastern Mediterranean and Central Europe. These MOZAIC profiles constitute the largest data-set of summer-time verti-cal ozone measurements in the area. A parallel examination of the Eastern Mediterranean profiles with the Central Eu-ropean profiles was undertaken in order to examine the pos-sible influence on the Eastern Mediterranean ozone concen-trations throughout the troposphere of the summer Eastern and Central European atmospheric outflow towards the East-ern Mediterranean area (long-range transport of ozone and its precursors in the area or the subsidence of ozone-rich upper tropospheric layers to the boundary layer). Finally, in order to assess the role of meteorology on the tropospheric ozone levels, attention was given on the analysis of the character-istic meteorological conditions, in both regions, of the days with the highest and the lowest ozone mixing ratios, respec-tively.
2 Results and discussion
Since 1994, within the framework of the MOZAIC pro-gram (Marenco et al., 1998) five commercial airliners have been equipped with instruments to measure ozone, water vapour, and carbon monoxide (since 2002). One aircraft carries an additional instrument to measure total odd nitro-gen (since 2001). Measurements are taken from take-off to landing. Based on the dual-beam UV absorption principle (Thermo-Electron, Model 49-103), the ozone measurement accuracy is estimated at ±[2 ppbv+2%] for a 4s response time (Thouret et al., 1998). Based on an infrared analyser, the carbon monoxide measurement accuracy is estimated at
8.5◦E). The flights cover the period 1996–2002 and took
place between June and September, almost exclusively dur-ing weekends. Both ascent and descent data have been used. Concerning the distribution of the profiles, most of them (28) took place in the year 1996, while in 1998 and in 2000 (years with severe forest fires in Greece) only two profiles were taken. For the remaining years (1997, 1999, 2001, 2002) 10-13 profiles were recorded for the June-September period. Finally, only one third of the profiles took place during the period 1998–2001, which was warmer than the years 1996, 1997 and 2002.
2.1 Average ozone profiles
For the following analysis the ozone profiles collected over the Mediterranean and the corresponding profiles over Vi-enna or Frankfurt were averaged over intervals of 100 hPa (50 hPa for the lowest and highest levels): 1000 (1000–950), 900 (950–850), 800 (850–750), 700 (750–650), 600 (650– 550), 500 (550–450), 400 (450–350) and 300 (350–300) hPa. The first step will be the determination of the average sum-mer ozone values throughout the troposphere for both re-gions. Figure 1 displays median, 75 and 90 percentiles of the frequency distributions of the average ozone values for each pressure level over the Eastern Mediterranean (Herak-lion, Rhodes and Antalya) and the corresponding values ob-tained over Central Europe (Vienna and Frankfurt) from the same flights. Table 1 summarises the differences between the average ozone profiles collected over Central Europe and the Eastern Mediterranean. In both regions the 90 percentiles exceed the 60 ppb threshold at the 900 and 800 hPa levels. In the Eastern Mediterranean, even the 75 percentiles are still around 60 ppb, about 10 ppb higher than over Central Europe. The median value over the Eastern Mediterranean is about 55 ppb between 900 and 700 hPa (Fig. 1a). Over Central Europe, the median at 700 hPa is similar (55 ppb) whereas significantly lower median values (42 ppb), are ob-served in the lower levels (Fig. 1b). Clearly, the differences in ozone mixing ratios between the two regions are more pro-nounced in the boundary layer (9-12 ppb higher ozone values in the Eastern Mediterranean, whereas only 3-5 ppb higher ozone mixing ratios are observed in the middle troposphere). The picture remains unchanged when the flights to Antalya are excluded from the analysis. Antalya is located outside the Aegean channel deep in a gulf surrounded by high moun-tains and was not expected to be influenced the same way by the predominant summer northern flow as the other two air-ports. The results in Fig. 1 and Table 1 suggest that boundary layer processes should be responsible for the enhanced sur-face ozone levels over the Mediterranean in comparison to Central Europe, which could be combined with results re-ported in the literature arguing that lower tropospheric ozone over the Eastern Mediterranean region is strongly influenced by precursor emissions from Eastern Europe, remaining in
Table 1.Average difference in ozone (in ppb) between Central Eu-rope (Vienna, Frankfurt) and the Eastern Mediterranean (Heraklion, Rhodes, Antalya) for summer (JJAS). Relative differences (in per-cent) are given in parenthesis.
Standard Pressure Eastern Mediterranean –
Levels hPa Central Europe (77 profiles)
ppb (%)
1000 12.2 (40.1)
900 9.4 (22.0)
800 5.9 (12.1)
700 3.6 (6.6)
600 5.3 (9.1)
500 4.9 (7.8)
400 4.1 (6.0)
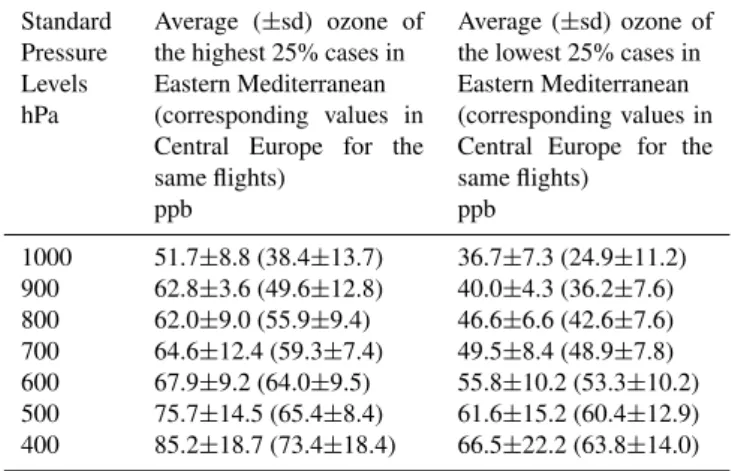
Table 2. Comparison of ozone averages between Central Eu-rope (Vienna, Frankfurt) and the Eastern Mediterranean (Heraklion, Rhodes, Antalya) for the highest and lowest 25% of ozone concen-trations at 900 hPa in the Eastern Mediterranean (19 profiles in each group).
Standard Pressure Levels hPa
Average (±sd) ozone of the highest 25% cases in Eastern Mediterranean (corresponding values in Central Europe for the same flights)
ppb
Average (±sd) ozone of the lowest 25% cases in Eastern Mediterranean (corresponding values in Central Europe for the same flights)
ppb
1000 51.7±8.8 (38.4±13.7) 36.7±7.3 (24.9±11.2) 900 62.8±3.6 (49.6±12.8) 40.0±4.3 (36.2±7.6) 800 62.0±9.0 (55.9±9.4) 46.6±6.6 (42.6±7.6) 700 64.6±12.4 (59.3±7.4) 49.5±8.4 (48.9±7.8) 600 67.9±9.2 (64.0±9.5) 55.8±10.2 (53.3±10.2) 500 75.7±14.5 (65.4±8.4) 61.6±15.2 (60.4±12.9) 400 85.2±18.7 (73.4±18.4) 66.5±22.2 (63.8±14.0)
the boundary layer, and from Western Europe in and directly above the boundary layer (Lelieveld et al., 2002).
400
500
600
700
800
900
1000
0 10 20 30 40 50 60 70 80 90 100 110 120
Ozone mixing ratio (blue, ppb) / Percentage (red, %)
A
tm
o
s
p
h
e
ri
c
p
re
s
s
u
re
(
h
P
a
)
Fig. 2. Average vertical ozone summer (JJAS) absolute (blue, in ppb) and relative (red, in %) ozone differences in the East-ern Mediterranean (Heraklion-Rhodes-Antalya) between the 25% of the days with the highest ozone values at 925 hPa and the 25% of the days with the lowest ozone values (19 profiles in each group).
In Figure 2 the absolute and relative increases of ozone (in %) at the various pressure levels between the low ozone and the high ozone days in the Eastern Mediterranean are plotted. Summarising from that figure, the MOZAIC profiles for the Eastern Mediterranean region show that significantly higher ozone levels persistently prevail throughout the entire tropospheric column for the “high ozone days” profiles. The most pronounced difference between the high and the low ozone days is observed at the 900 hPa level.
2.2 Composite weather maps
Figure 3 shows composite 925 hPa weather maps for each group of profiles (high and low ozone days in the East-ern Mediterranean). The composite weather maps (aver-age pressure fields of selected days) were constructed from the NCEP/NCAR reanalysis, based on grids of 2.5×2.5 de-grees, for the days of the flights in each group following the procedure of Kalnay et al., 1996. The composite weather map (Fig. 3a) for the highest quartile of ozone values in the Eastern Mediterranean (EMED) boundary layer shows weak anticyclonic systems over the Central Mediterranean and over the Balkans inducing stagnant conditions. A well-established northern current occurs in the boundary layer over the Aegean due to the combined influence of the Cen-tral Mediterranean and the Balkan highs with the Middle East low-pressure system. High surface air temperatures are also recorded in the area during this group of days. The average 900 hPa ozone value in Eastern Mediterranean is 63 ppb with little variability (Table 2, second column). The correspond-ing 900 hPa average value in Central Europe is about 50 ppb where a rather strong westerly airflow driven by the
Scandi-Fig. 3.Composite weather maps of geopotential heights at 925 hPa:
(a)for the group of the 25% cases with highest ozone values at
900 hPa (upper panel), and (lower panel,(b)for the group of the
25% cases with the lowest ozone values at 900 hPa in the Eastern Mediterranean (19 profiles in each group).
Table 3.Contribution of each atmospheric layer to the air arriving in Rhodes at 0–2 km on the high ozone days (4 cases) and on the low ozone days (5 cases) for 10-days and 5 days backward simulations.
10 days 10 days 5 days 5 days
High ozone Low ozone High ozone Low ozone
0–2 29.3% 38.6% 40.5% 52.4%
2–4 25.6% 33.6% 29.2% 38.8%
>4 45.1% 27.8% 30.3% 8.8%
Total 100% 100% 100% 100%
layer air. The anticyclone over the Central Mediterranean entrains air masses to the Eastern Mediterranean region by the established northerly flow on the eastern side of the an-ticyclone. During the transport these air masses can be en-riched with ozone precursors while passing over polluted ar-eas of the continent. Eventually, this can lead to an accumu-lation of ozone over the Eastern Mediterranean region. In the Aegean the frequent presence of the Central Mediterranean and the Balkan high pressure systems in combination with the Middle-East low results in a persistent northerly flow in the boundary layer, frequently quite strong and containing high ozone amounts, which is in agreement with the results of short-term campaigns in the area (Lelieveld et al., 2002; Zerefos et al., 2002).
2.3 Back-trajectories
From our data-set, four cases from the quartile of the high-est ozone values in the Eastern Mediterranean and five cases from the quartile of the lowest ones have been recorded dur-ing summer 2002. For that year some CO profiles from the MOZAIC project are also available. The meteorological con-ditions for the high and low ozone days in that particular year are similar to those of the entire data-set. Likewise, a significant difference of 20–25 ppb is observed in the aver-age ozone differences between high and low ozone days in the lower levels, which is maximized at 900 hPa inside the boundary layer (Fig. 4), indicating that the selected subgroup of profiles is quite representative as similar ozone differences between high and low ozone days are observed also for the entire data-set.
For the determination of the air mass origin, the La-grangian particle dispersion model FLEXPART (version 6.2; Stohl et al., 1998; Stohl et al., 2005) was used. FLEX-PART was driven by model-level data from the European Centre for Medium-Range Weather Forecasts (ECMWF), with a temporal resolution of 3 h (analyses at 00:00, 06:00, 12:00, 18:00 UTC; 3-h forecasts at 03:00, 09:00, 15:00, 21:00 UTC), and 60 vertical levels. Horizontal resolution was 1◦×1×globally. 20 000 particles were released from grid boxes (0.5×0.5◦, 100 m in height) centered on the
300
400
500
600
700
800
900
1000
0 10 20 30 40 50 60 70 80 90 100 110 120
Ozone mixing ratio (ppb)
A
tm
o
s
p
h
e
ri
c
p
re
s
s
u
re
(
h
P
a
)
Fig. 4. Vertical ozone averages over Rhodes during the highest ozone days (4 cases, red line) and the lowest ozone days (5 cases, blue line) in summer 2002.
MOZAIC profiles. The particles were advected backward in time over 10 days. Particles were transported both by the resolved winds and parameterized subgrid motions. FLEX-PART parameterizes turbulence in the boundary layer and in the free troposphere by solving Langevin equations (Stohl and Thomson, 1999). FLEXPART uses also a parameteriza-tion scheme for convecparameteriza-tion (Forster et al., 2007). The res-idence times of particles were output every 3 h as 3-h av-erages. They are available at a grid spacing of 1×1◦ in 3 layers between 0 and 2 km, 2 and 4 km, 4 and 20 km. Per-centage contribution of a geographical area to the chemical concentration of a box centered along a MOZAIC profile is calculated by dividing the total residence time of the 20 000 released particles found in the area by the total residence time in the whole output grid over 10 days.
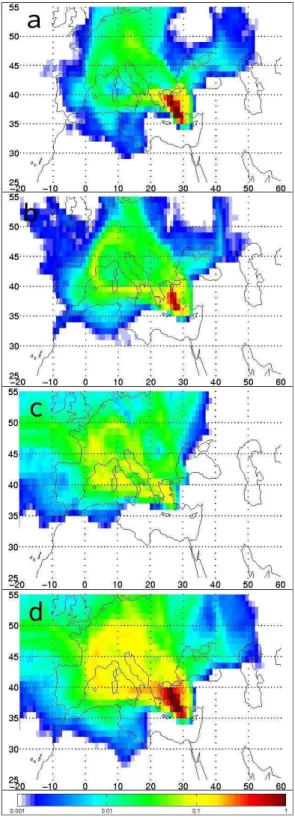
Fig. 5. Percentage contribution of geographical regions after 10-days FLEXPART backward simulation for the 4 high ozone cases
and for the 0–2 km air parcels arriving at Rhodes.(a)for the 0–2 km
layer,(b)for the 2–4 km layer,(c)for the>4 km layer and d) for
the total atmospheric column.
Fig. 6. Percentage contribution of geographical regions after 10-days FLEXPART backward simulation for the 5 low ozone cases
and for the 0–2 km air parcels arriving at Rhodes. (a)for the 0–
2 km layer,(b)for the 2–4 km layer,(c)for the>4 km layer and(d)
a small contribution from Central Europe (Fig. 5). In the 2–4 km layer the contribution of the Aegean area is still sig-nificant but also a substantial contribution from the Balkans, Italy and Central Europe is visible. The above-described sit-uation corresponding to high ozone days is quite frequent in the area and is also reported in the results of the MINOS and PAUR campaigns (Lelieveld et al., 2002; Zerefos et al., 2002).
The corresponding geographical contribution for the dif-ferent atmospheric layers during the low ozone days for the 10-days FLEXPART backward trajectory simulations is shown in the Fig. 6. Most of the contribution comes from the lower layers of the Central and Eastern Mediterranean, advecting rather clean air to the measuring site, as it was also suggested by the composite weather maps. Table 3 shows clearly that for the low ozone days the contribution of the lower atmospheric layers is more significant than during high ozone days.
2.4 Profiles of carbon monoxide
From the MOZAIC project (Nedelec et al., 2003) and for the examined period in this study, 6 CO profiles exist collected over Rhodes during summer 2002. The measured CO con-centrations on high ozone days are significantly higher than on the low ozone days, especially in the boundary layer ex-ceeding 150 ppb. This is in agreement with the results of the MINOS campaign, where CO levels higher than 150 ppb are reported originating mainly from fossil fuel use and long-range transport from Western and Eastern Europe (Lelieveld et al., 2002).
3 Conclusions
Based on 77 MOZAIC flights recording vertical ozone pro-files, the differences between Eastern Mediterranean and Central Europe showed significantly (10–12 ppb, 20–40%) enhanced ozone levels over the Eastern Mediterranean for the 1000 hPa to 900 hPa levels, whereas ozone between 700 hPa and 400 hPa was only slightly (3–5 ppb, 5–10%) higher than over Central Europe. The composite weather maps for the days with the highest ozone mixing ratios observed in the Mediterranean boundary layer suggest a strong influence of anticyclonic weather conditions. The lowest ozone levels are associated with a westward extension of the Middle East low and weak pressure gradients over the Eastern Mediter-ranean. Summer midlatitude anticyclones influence ozone in two ways: (i) downward transport from the upper tro-posphere and (ii) by creating stable conditions close to the surface, thereby hindering vertical dispersion of ozone pre-cursors and enabling them to travel over long distances hor-izontally thus leading to regional photochemical activity in the boundary layer. Especially in the Aegean area, north-ern airflow due to the combined influence of the Central
Mediterranean and the Balkans anticyclones with the Mid-dle East low predominates in the boundary layer, thus lead-ing to southward transport of polluted air from the Balkans and Eastern Europe. The above arguments are supported by the results of backward trajectory simulations for days with high and low ozone mixing ratios and by the few CO pro-files available for the Eastern Mediterranean. These findings come out from the analysis of the largest data set of summer vertical ozone profiles available for this area and confirm the results of short-term intensive campaigns in the region, re-ported in the literature.
Acknowledgements. This work was supported by the
Re-search Committee of the Academy of Athens. The composite
weather maps were provided by the NOAA/ESRL Physical Sciences Division, Boulder Colorado from their Web site at http://www.cdc.noaa.gov/. MOZAIC was funded by the European Commission.
Edited by: A. Stohl
References
Beck, J. and Grennfeld, P.: Distribution of ozone over Europe, in: the Proceedings of the EUROTRAC Symposium 92, edited by: Borell, P. M., Borell, P., Cvitas, T., and Seler, W., SPB Academic Publishing bv, 43-58, 1993
Forster, C., Stohl A., and Seibert P.: Parameterization of convective transport in a Lagrangian particle dispersion model and its evalu-ation, J. Appl. Met. Clim, 46, 403–422, doi:10.1175/JAM2470.1, 2007
Henne, S.: Characterisation of high Alpine pollution plumes, PhD Thesis, ETH Zurich (No 15949), 2005
Gros, V., Williams, J., van Aardenne, J. A., Salisbury, G., Hofmann, R., Lawrence, M. G., von Kuhlmann, R,. Lelieveld, J., Krohl, M., Berresheim, H., Lobert, J. M., and Atlas, E.: Origin of an-thropogenic hydrocarbons and halocarbons measured in the sum-mertime European outflow 10 (on Crete in 2001), Atmos. Chem. Phys., 3, 1223–1235, 2003
Kalabokas, P. D. and Bartzis, J. G.: Photochemical air pollution characteristics at the station of the NCSR-Demokritos, during the MEDCAPHOT-TRACE campaign, Greece (August 20th– September 20th, 1994), Atmosph. Environ., 32(12), 2123–2139, 1998.
Kalabokas, P. D., Viras L. G., Bartzis, J. G., and Repapis, C. C.: Mediterranean rural ozone characteristics around the urban area of Athens, Atmos. Environ., 34(29–30), 5199–5208, 2000 Kalabokas, P. D. and Repapis, C. C.: A climatological study of rural
surface ozone in Central Greece, Atmos. Chem. Phys., 4, 1139– 1147, 2004
Kourtidis, K., Zerefos, C., Rapsomanikis, S., Simeonov, V., Balis, D., Perros, P. E., Thomson, A. M., Witte, J., Calpini, B., Sharobiem, W. M., Papayannis, A., Mihalopoulos, N., and Drakou, R.: Regional levels of ozone in the troposphere over eastern Mediterranean, J. Geoph. Res., 107(D18), 8140, doi:10.1029/2000JD000140, 2002
Kouvarakis, G., Tsigaridis, K., Kanakidou, M., and Mihalopoulos, N.: Temporal variations of surface regional background ozone over Crete Island in the southeast Mediterranean, J. Geoph. Res., 105(D4), 4399–4407, 2000
Kouvarakis, G., Vrekoussis, M., Mihalopoulos, N., Kourtidis, K., Rappenglueck, B., Gerasopoulos E., and Zerefos, C.: Spatial and temporal variability of tropospheric ozone in the boundary layer above the Aegean Sea (eastern Mediterranean), J. Geoph. Res., 107(D18), 8137, doi:10.1029/2000JD000081, 2002
Lelieveld, J., Berresheim, H., Borman, S., et al.: Global air Pollu-tion crossroads over the Mediterranean, Science, 298, 794–799, 2002
Marenco, A., Thouret, V., Nedelec, P., Smit, H., Helten, M., Kley, D., Karcher, F., Simon, P., Law, K., Pyle, J., Poschmann, G., Von Wrede, R., Hume, C., and Cook, T.: Measurements of ozone and water vapor by Airbus in-service aircraft: The MOZAIC airborne program, An overview, J. Geophys. Res., 103, 25 631–25 642, 1998
Nedelec, P., Cammas, J.-P., Thouret, V., Athier, G., Cousin, J.-M., Legrand, C., Abonnel, C., Lecoeur, F., Cayez, G., and Marizy, C.: An improved infrared carbon monoxide analyser for routine measurements aboard commercial Airbus aircraft: technical val-idation and first scientific results of the MOZAIC III programme, Atmos. Chem. Phys., 3, 1551–1564, 2003
Repapis, C., Zerefos, C., and Tritakis, B.: On the Etesians over the Aegean. Proc. Acad. Athens, 52, 572–606, 1977.
Rodwell, M. J. and Hoskins, B. J.: Monsoons and the dynamics of deserts, Q. J. R. Meteorol. Soc., 122, 1385–1404, 1996 Rodwell, M. J. and Hoskins, B. J.: Subtropical anticyclones and
summer monsoons, J. Climate, 14, 3192–3211, 2001
Roelofs, G. J., Scheeren, H. A., Heland, J., Ziereis, H., and Lelieveld, J.: A model study of ozone in the eastern Mediter-ranean free troposphere during MINOS (August 2001), Atmos. Chem. Phys. 3, 1199–1210, 2003
Sauvage, B., Thouret, V., Cammas, J. -P., Gheusi, F., Athier, G., and Nedelec, P: Tropospheric ozone over Equatorial Africa: regional aspects from the MOZAIC data. Atmos. Chem. Phys. 5, 311– 335, 2005.
Scheel, H. E., Areskoug, H., Geiß, H., Gomiscek, B., Granby, K., Haszpra, H., Klasinc, L., Kley, D., Laurila, T., Lindskog, A., Roemer, M., Schmitt, R., Simmonds, P., Solberg, S., and Toupance, G.: On the spatial distribution and seasonal variation of lower-troposphere ozone over Europe, J. Atmos. Chem, 28, 11–28, 1997
Sheeren, H. A., Lelieveld, J., Roelofs, G. J., Williams, J., Fischer, H., de Reus, M., de Gouw, J. A., Warneke, C., Holzinger, R., Schlager, H., Kluepfel, T., Bolder, M., van der Veen, C., and Lawrence, M.: The impact of monsoon outflow from India and Southeast Asia in the upper troposphere over the eastern Mediter-ranean, Atmos. Chem. Phys., 3, 1589–1608, 2003,
http://www.atmos-chem-phys.net/3/1589/2003/.
Staehelin, J., Thudium, J., Buehler, R., Volz-Thomas, A., and Graber, W.: Trends in surface ozone concentrations at Arosa (Switzerland), Atmos. Environ., 28, 75–87, 1994
Stohl, A., Hittenberger, M., and Wotawa, G.: Validation of the Lagrangian particle dispersion model FLEXPART against large-scale tracer experiments, Atmos. Environ., 24, 4245–4264, 1998 Stohl, A. and Thomson, D. J.: A density correction for Lagrangian particle dispersion models, Bound.-Layer Meteorol., 90, 155– 167, 1999
Stohl, A., Forster, C., Frank, A., Seibert, P., and Wotawa, G.: Tech-nical note: The Lagrangian particle dispersion model FLEX-PART version 6.2, Atmos. Chem. Phys., 5, 2461–2474, 2005 Thouret, V., Marenco, A., Logan, J., Nedelec, P., and Grouhel,
C.: Comparisons of ozone measurements from the MOZAIC air-borne program and the ozone sounding network at eight loca-tions, J. Geophys. Res., 103, 25 695–25 720, 1998
Thouret, V., Cammas, J.-P., Sauvage, B., Athier, G., Zbinden, R., Nedelec, P., Simon, P., and Karcher ,F.: Tropopause referenced ozone climatology and inter-annual variability (1994–3003) from the MOZAIC programme, Atmos. Chem. Phys., 6, 1033–1051, 2006
Traub, M., Fisher, H., de Reus, M., Kormann, R., Heland, J., Ziereis, H., Schlager, H., Holzinger, R., Williams, J., Warnecke, C., de Gouw, J., and Lelieveld, J.: Chemical characteristics as-signed to trajectory clusters during the MINOS campaign, At-mos. Chem. Phys. 3, 459–468, 2003
Van Aalst, R., Fowler, D., Megie, G., Moussiopoulos, N., Warneck, P., Volz-Thomas, A., Wayne, R.: in: “Photooxidants, Acidifi-cation and Tools; Policy AppliAcidifi-cations of EUROTRAC results” (Volume 10), edited by: Borrell, P., Hov, O., Grennfelt, P., and Builtjes, P., pp. 41–69, Springer Verlag, Berlin, Heidelberg, New York, 1996.
Varotsos, C., Kalabokas, P., and Chronopoulos, G.: Atmospheric ozone concentration at Athens, Greece. Part II: Vertical ozone distribution in the troposphere, Atmos. Res., 30, 151–155, 1993 Volz, A. and Kley, D.: Evaluation of the Montsouris series of ozone
measurements made in the nineteenth century, Nature, 332, 240– 242, 1988.
Volz-Thomas, A., Beekmann, M., Derwent, D., et al.: Tropospheric ozone and its control, in: EUROTRAC-2 Final report, edited by: Midgley et al., Part 1, Margraf Verlag, Weikersheim, 2003. Zerefos, C. S., Kourtidis, K. A., Melas, D., Balis, D., Zanis, P.,
Katsaros, L., Mantis, H. T., Repapis, C., Isaksen, I., Sundet, J., Herman, J,. Bhartia, P. K., and Calpini, B.: Photochemical Activ-ity and Solar Ultraviolet Radiation (PAUR) Modulation factors: An overview of the project, J. Geophys. Res., 107(D18), 8134, doi:10.1029/2000JD00134, 2002