ACPD
11, 22719–22770, 2011Stratospheric impact on tropospheric ozone variability and
trends
P. G. Hess and R. Zbinden
Title Page
Abstract Introduction
Conclusions References
Tables Figures
◭ ◮
◭ ◮
Back Close
Full Screen / Esc
Printer-friendly Version Interactive Discussion
Discussion
P
a
per
|
Dis
cussion
P
a
per
|
Discussion
P
a
per
|
Discussio
n
P
a
per
Atmos. Chem. Phys. Discuss., 11, 22719–22770, 2011 www.atmos-chem-phys-discuss.net/11/22719/2011/ doi:10.5194/acpd-11-22719-2011
© Author(s) 2011. CC Attribution 3.0 License.
Atmospheric Chemistry and Physics Discussions
This discussion paper is/has been under review for the journal Atmospheric Chemistry and Physics (ACP). Please refer to the corresponding final paper in ACP if available.
Stratospheric impact on tropospheric
ozone variability and trends: 1990–2009
P. G. Hess1and R. Zbinden2
1
Cornell University, Department of Biological and Environmental Engineering, Ithaca, NY, USA
2
Laboratoire d’A ´erologie, UMR5560, CNRS et Universit ´e de Toulouse, Toulouse, France Received: 22 June 2011 – Accepted: 7 July 2011 – Published: 11 August 2011
Correspondence to: P. G. Hess ([email protected])
ACPD
11, 22719–22770, 2011Stratospheric impact on tropospheric ozone variability and
trends
P. G. Hess and R. Zbinden
Title Page
Abstract Introduction
Conclusions References
Tables Figures
◭ ◮
◭ ◮
Back Close
Full Screen / Esc
Printer-friendly Version Interactive Discussion
Discussion
P
a
per
|
Dis
cussion
P
a
per
|
Discussion
P
a
per
|
Discussio
n
P
a
per
|
Abstract
We evaluate the influence of stratospheric ozone on the interannual variability and
trends in tropospheric ozone from 30–90◦N between 1990 and 2009 using ozone
measurements and a global chemical transport model (the Community Atmospheric Model with chemistry) with input meteorology from the National Center for
Environ-5
mental Prediction. The model simulation uses constant interannual emissions. Both the model and measurements indicate that on large spatial scales stratospheric in-terannual ozone variability drives significant tropospheric variability and contributes to long-term tropospheric ozone trends. To diagnose the measured variability we utilized measurements from ozonesondes and the Measurements of OZone and water vapour
10
by in-service Airbus airCraft programme (MOZAIC) north of 30◦N. We identify a
region-ally robust 150 hPa ozone signal from measurements over Canadian, Northern Euro-pean and Central EuroEuro-pean regions and at 500 hPa over Canadian, Northern EuroEuro-pean and Eastern US regions. Averaged over these regions, the 150 hPa interannual ozone variability explains 69 % of the interannual variability at 500 hPa. The simulated
strato-15
spheric signal explains 81 % of the simulated variability over these same regions. Sim-ulated and measured ozone are significantly correlated over these regions and the sim-ulation suggests that the ozone record over these regions is representative of the
over-all hemispheric 500 hPa ozone record from 30–90◦N. The measured 500 hPa trends
averaged over these three regions between 1990 and 2000 and 1990 and 2009 are
20
0.73 (±0.51) ppbv yr−1and 0.27 (±0.19) ppbv yr−1, respectively. The simulated trends
in 1990–2000 and 1990–2009 are 0.29±0.10 ppbv yr−1 and 0.13±0.05 ppbv yr−1,
re-spectively; however, these trends are substantially larger when the model is sampled for missing data exactly as the measurements are. Simulated stratospheric ozone ac-counts for 79 % of the simulated 500 hPa trend between 1990 and 2000 and 100 % of
25
the simulated trend between 1990 and 2009. Due to the importance of local
meteorol-ogy and emissions at the surface it is difficult to isolate the stratospheric component of
simu-ACPD
11, 22719–22770, 2011Stratospheric impact on tropospheric ozone variability and
trends
P. G. Hess and R. Zbinden
Title Page
Abstract Introduction
Conclusions References
Tables Figures
◭ ◮
◭ ◮
Back Close
Full Screen / Esc
Printer-friendly Version Interactive Discussion
Discussion
P
a
per
|
Dis
cussion
P
a
per
|
Discussion
P
a
per
|
Discussio
n
P
a
per
lated surface interannual ozone trends are 0.18 ppbv yr−1and 0.07 ppbv yr−1 between
1990 and 1999, and between 1990 and 2009, respectively. We have identified a num-ber of surface sites where the measured interannual ozone variability is correlated with the 150 hPa ozone signal. Most notably these sites include the high mountain sites over Europe and Macehead, Ireland. Over Macehead the measured 150 hPa ozone
5
signal explains 40 % of the interannual variability of the unfiltered measured ozone record. The simulated and measured ozone are highly correlated over Macehead. The Macehead measured and simulated unfiltered ozone trends between 1990 and 2000
are 0.28 (±0.33) and 0.17 (±0.13) ppbv yr−1respectively; between 1990 and 2009 the
measured and simulated trends are 0.18 (±0.11) and 0.08 (±0.06) ppbv yr−1,
respec-10
tively. Increases in the simulated stratospheric ozone component accounts for 53 % and 75 % of the overall modeled trend for the two periods at Macehead.
1 Introduction
Tropospheric ozone is photochemically produced in situ from ozone precursor emis-sions or transported from the stratosphere. Tropospheric ozone impacts air
qual-15
ity and human health (Bell et al., 2004), atmospheric radiative forcing (Forster and Shine, 1997), and ecosystem productivity (UNEP, 2006) with resulting impacts on food (Chameides et al., 1994) and climate (Sitch et al., 2007). It also modifies the “oxidizing capacity” of the troposphere, impacting the lifetime and radiative forcing of methane (Fiore et al., 2002). Using conservative ozone-mortality epidemiologic relationships
20
(Bell et al., 2004), even one ppbv of ozone, approximately 20 % of the surface ozone attributed to Stratosphere-Troposphere Exchange (STE) in the Northern Hemisphere (NH) mid- and high latitudes (Hess and Lamarque, 2007) may have relatively large consequences on human health (West et al., 2007).
Early semi-quantitative ozone measurements at the end of the 19th century (Volz
25
ACPD
11, 22719–22770, 2011Stratospheric impact on tropospheric ozone variability and
trends
P. G. Hess and R. Zbinden
Title Page
Abstract Introduction
Conclusions References
Tables Figures
◭ ◮
◭ ◮
Back Close
Full Screen / Esc
Printer-friendly Version Interactive Discussion
Discussion
P
a
per
|
Dis
cussion
P
a
per
|
Discussion
P
a
per
|
Discussio
n
P
a
per
|
some details, have been able to qualitatively capture much of this remarkable ozone increase, an increase driven by the increased emissions of ozone precursors associ-ated with industrialization. However, an explanation for the interannual trends in tropo-spheric ozone over the last few decades has proven more elusive despite the regulatory need to establish clear links between how changes in ozone precursor emissions and
5
changes in climate result in changes in tropospheric ozone. The difficulty is in part
due to the fact that the ozone variability results from complex and mutually dependent interactions between meteorology, ozone photochemistry, and STE. Here we examine interannual tropospheric ozone variability in the NH midlatitudes between 1990 and 2009 using analyzed ozone measurements from the stratosphere and troposphere in
10
conjunction with a model simulation. We show that in recent years changes in the transport of ozone from the stratosphere to the troposphere can explain a considerable fraction of the interannual variability in tropospheric ozone; furthermore we show that in many locations this increased transport results in a positive trend in tropospheric ozone.
15
In the last two decades positive ozone trends have been found in locations both rep-resentative of the free troposphere (Tarasick et al., 2005; Zbinden et al., 2006; Thouret et al., 2006; Ordonez et al., 2007; Cooper et al., 2010) and also at surface locations
with implications for air quality (Jaffe et al., 2003; Simmonds et al., 2004; Parrish et al.,
2004; Carslaw, 2005; Derwent et al., 2007; Jaffe and Ray, 2007; Parrish et al., 2009);
20
however, the trend is not positive at all locations (Oltmans et al., 2006; Lelieveld et al., 2004). Over the west coast of the US the trends have been qualitatively associ-ated with increased Asian emissions of ozone precursors (Cooper et al., 2010). More puzzling, however, are ozone trends at sites further removed from the rapid growth in ozone precursor emissions over Asia. At Macehead Ireland between 1987 and 2003
25
baseline ozone trends are 0.49+/−0.19ppbv yr−1 (Simmonds et al., 2004), although
ozone appears to have leveled offin recent years (Derwent et al., 2007) yielding a
20-yr trend of 0.31+/−0.12 ppbv yr−1 between 1987 and 2007. Zbinden et al. (2006) and
ACPD
11, 22719–22770, 2011Stratospheric impact on tropospheric ozone variability and
trends
P. G. Hess and R. Zbinden
Title Page
Abstract Introduction
Conclusions References
Tables Figures
◭ ◮
◭ ◮
Back Close
Full Screen / Esc
Printer-friendly Version Interactive Discussion
Discussion
P
a
per
|
Dis
cussion
P
a
per
|
Discussion
P
a
per
|
Discussio
n
P
a
per
upper tropospheric/lower stratospheric ozone of approximately 1 % year from MOZAIC measurements during the late 20th and early 21st century. These trends extend over three continents suggesting a common source of variance. An analysis of high alpine European sites (Ordonez et al., 2007) and of ozonesonde measurements over Canada (Tarasick et al., 2005) suggests similar tropospheric trends during the same
approxi-5
mate time period. These positive ozone trends have not been quantitatively explained or simulated; calculations (Lamarque et al., 2010; Fiore et al., 2009) suggest emission
trends are not sufficient to explain the measured trends in many locations.
In a comparison of future ozone predictions in 26 chemistry climate models (Steven-son et al., 2006) the net ozone response is determined by the balance between
in-10
creases in water vapor decreasing the concentration of ozone and the increase in stratospheric-tropospheric exchange increasing the concentration of ozone. Climate models almost universally predict an increase in the exchange of mass from the strato-sphere to tropostrato-sphere associated with climate warming (Butchart et al., 2006) with commensurate, although highly uncertain increases in the exchange of ozone between
15
the stratosphere and troposphere (Stevenson et al., 2006; Zeng and Pyle, 2003; Collins et al., 2003; Shindell et al., 2006; Hegglin and Shepherd, 2009). Historic transient simulations have also indicated the stratospheric mass flux into the troposphere has
increased during latter part of the 20th century (Butchart et al., 2006) suggesting
in-creased STE should already be occurring. Hegglin and Shepherd (2009) suggests that
20
the stratospheric flux of ozone has been increasing at a nearly constant rate in the NH of approximately 2 %/decade since 1970. By 2100, Hegglin and Shepherd (2009) pre-dicts this alone will have increased ozone throughout much of the troposphere by 30 % compared to 1970.
On local and regional scales previous work has found vertical correlations between
25
ACPD
11, 22719–22770, 2011Stratospheric impact on tropospheric ozone variability and
trends
P. G. Hess and R. Zbinden
Title Page
Abstract Introduction
Conclusions References
Tables Figures
◭ ◮
◭ ◮
Back Close
Full Screen / Esc
Printer-friendly Version Interactive Discussion
Discussion
P
a
per
|
Dis
cussion
P
a
per
|
Discussion
P
a
per
|
Discussio
n
P
a
per
|
network; Terao et al. (2008) found regionally specific vertical stratosphere-troposphere correlations both in measured ozonesonde data and in a model simulation; Thouret et al. (2006) found correlated anomalies in the lower stratosphere and upper tropo-sphere from MOZAIC data; Ordonez et al. (2007) found high correlations between ozone measured at high alpine sites over Europe and lower stratospheric ozone at
5
nearby ozonesonde stations. A number of modeling studies have also noted corre-lations between stratosphere-troposphere exchange and El Nino Southern Oscillation (Zeng and Pyle, 2005; Voulgarakis et al., 2011) and the Arctic Oscillation (Hess and Lamarque, 2007). From 2001–2005, Hsu and Prather (2009) find that the root mean square variability in ozone due to STE is 8 % and 13 % of the net ozone flux in the NH
10
and Southern Hemisphere (SH), respectively.
Here we show the importance of STE in driving tropospheric ozone variability and trends on large scales using both measurements and model simulations. Between 1990 and 2009 increased STE has contributed to the positive ozone trends found in many locations. We show that this has had large impacts on the Macehead Ireland
15
ozone record, a site frequently used to argue that baseline ozone is increasing. Sec-tion 2 describes our methodology and includes a descripSec-tion of the measurements and model utilized in this study. Section 3 gives an overview of simulated results. The data analysis of ozone trends and variability from the lower stratosphere to the sur-face is given in Sect. 4. Section 5 evaluates the model simulation against the available
20
data. Here we also investigate the components of the large 1998–1999 ozone anomaly measured at many NH locations. Discussion and conclusions are given in Sect. 6.
2 Methodology
Measurements and model simulations of ozone are analyzed from 1990 through 2009
north of 30◦N to examine the importance of the stratosphere on the tropospheric ozone
25
ACPD
11, 22719–22770, 2011Stratospheric impact on tropospheric ozone variability and
trends
P. G. Hess and R. Zbinden
Title Page
Abstract Introduction
Conclusions References
Tables Figures
◭ ◮
◭ ◮
Back Close
Full Screen / Esc
Printer-friendly Version Interactive Discussion
Discussion
P
a
per
|
Dis
cussion
P
a
per
|
Discussion
P
a
per
|
Discussio
n
P
a
per
2.1 Data utilized
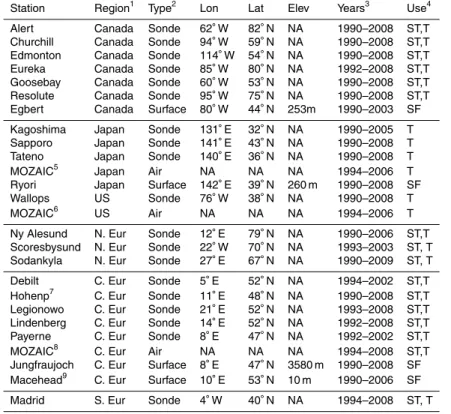
Several different types of measurements are used to quantify the trend and variability
in ozone (Table 1) including measurements from ozonesondes and from the Measure-ments of OZone and water vapour by in-service Airbus airCraft programme (MOZAIC) (Marenco et al., 1998). A limited number of surface measurements are also analyzed,
5
although surface measurements are not emphasized in this paper. Only measurement platforms with relatively frequent, consistent and long-term measurements were se-lected for analysis. In addition we required that most of the base period from 1995 through 2005 be regularly sampled.
The ozonesonde data was obtained from the Ozone and Ultraviolet Data Center
En-10
vironment Canada. Two types of ozonesonde are used: the electrochemical concen-tration cell (ECC) and the Brewer Mast (BM) bubbler. Our analysis relies on only one of the techniques at each site. Thus, while the Payerne ozonesondes switched from BM to ECC in 2002, we only analyze the record prior to 2002. The ozone record at Uccle is not included as the ozonesonde switched type in 1997, within the middle of the
15
base period and immediately prior to the large changes in analyzed ozone (e.g., see Fig. 3). Most ozonesonde profiles are modified by a correction factor (CF) to account for discrepancies between the ozonesonde measurements and measured total ozone. However, the use of a correction factor is controversial within the troposphere (SPARC, 1988). As in Logan (1994, 1999) the CF for each sonde profile is used to provide a filter
20
for the quality of the data. Sampling frequency for the ozonesondes was never more than 16 per month over any particular site. Detailed discussion on the ozonesonde measurements is given in SPARC (1988). The ozonesonde measurements were ana-lyzed at 150 hPa and 500 hPa. Eighteen ozonesonde sites were selected for our data analysis (Table 1).
25
In addition to the ozonesonde measurements we have utilized three regional clusters
of vertical ozone profiles from take-offand landing measured during the MOZAIC
ACPD
11, 22719–22770, 2011Stratospheric impact on tropospheric ozone variability and
trends
P. G. Hess and R. Zbinden
Title Page
Abstract Introduction
Conclusions References
Tables Figures
◭ ◮
◭ ◮
Back Close
Full Screen / Esc
Printer-friendly Version Interactive Discussion
Discussion
P
a
per
|
Dis
cussion
P
a
per
|
Discussion
P
a
per
|
Discussio
n
P
a
per
|
to have wide longitudinal coverage. Here the clusters combine the time-sorted ozone profiles over Frankfurt and Munich for the European region (14 326 profiles from August 1994 to December 2007 with between 20 and 164 profiles/month); the Tokyo, Osaka and Nagoya profiles for the Asian region (3094 profiles from October 1994 to October 2006 with up to 53 profiles/month) and the New York, Boston and Washington profiles
5
for the North American region (5052 profiles from August 1994 to August 2007 with up to 78 profiles/month) (Table 1). Clustering of MOZAIC airports, necessary to provide a continuous time-series and robust sampling frequency, is validated by the similarities in the seasonal cycle and concentrations between the overall cluster and the profiles over the individual airports. MOZAIC measurements were analyzed at 500 hPa. At the
10
surface we utilize measurements at four sites on three different continents (Table 1).
The ozone record at these sites is taken from the WMO Global Atmospheric Watch World Data Center for Greenhouse Gases and is based on hourly data.
To analyze the data we use the following procedure. (i) First, at each station the ozone deviation from a monthly mean is calculated, where the monthly mean ozone
15
is calculated over the eleven-year period from 1995– 2005. This period provides an
approximate five-year buffer on each side of the large measured ozone increases
dur-ing 1998–1999. It also coincides with our record of ozone data from the MOZAIC programme. (ii) A 12-month running mean of the monthly deviations is taken to give the ozone annual average monthly deviations, or the ozone AAMD (ppbv) at each
sta-20
tion. (iii) In some analysis we normalize the ozone AAMD by the standard deviation of the ozone time series, to give the normalized AAMD at each station. Note that the normalized AAMD is unitless. (iv) The ozone timeseries at each site are averaged to
produce a regional signal for six different regions; Canada, Japan, the US, and
North-ern, Central and Southern Europe (see Table 1). We combine the stations regionally
25
to: isolate the larger-scale interannual variability over a larger geographical region and to increase the sampling frequency. The sampling frequency at any one station may be
too infrequent to detect ozone trends (Jaffe and Ray, 2007). The simulations discussed
ACPD
11, 22719–22770, 2011Stratospheric impact on tropospheric ozone variability and
trends
P. G. Hess and R. Zbinden
Title Page
Abstract Introduction
Conclusions References
Tables Figures
◭ ◮
◭ ◮
Back Close
Full Screen / Esc
Printer-friendly Version Interactive Discussion
Discussion
P
a
per
|
Dis
cussion
P
a
per
|
Discussion
P
a
per
|
Discussio
n
P
a
per
the impact of the stratosphere than the signal at any individual measurement site. The regions are selected based on the geographic location of the measurement sites,
co-herency of the measurements between the different measurement sites and number of
measurements. (v) For some analysis the individual regional signals are averaged to
give our best representation of the overall ozone signal from 30–90◦N
5
The individual sites within a region are averaged using either the ozone AAMD or the normalized ozone AAMD. Averaging using the normalized AAMD allows us to construct a regional signal where the variability at each station is given equal weight. Simply averaging the ozone deviations themselves is likely to weight the overall regional record towards those stations with more ozone. Each measurement location has its own mean
10
ozone concentration, bias and standard deviation.
We consider the ozone record to be regionally robust within those regions that (i) have at least two independent measurement sites and (ii) the measurements at the
different sites within each region have a high degree of correlation. Even within the
regions that satisfy these general criteria we consider the ozone signal to be robust
15
only for those years for which we can determine the annually averaged concentration
at two or more measurement sites. We consider the annual signal to be sufficiently
determined if ozone concentrations are reported for 10 out of 12 months.
2.2 Chemical transport model
The three-dimension chemistry transport model used in these simulations is the
Com-20
munity Atmosphere Model with chemistry (CAM-chem), in which chemistry from the Model of Ozone and Related Tracers version 4 (MOZART-4) (Emmons et al., 2010a) has been imported into the Community Atmosphere Model (Collins et al., 2006). In these simulations CAM-chem is driven by the meteorology from the National Center for Environmental Prediction/National Center for Atmospheric Research (NCEP/NCAR)
25
ACPD
11, 22719–22770, 2011Stratospheric impact on tropospheric ozone variability and
trends
P. G. Hess and R. Zbinden
Title Page
Abstract Introduction
Conclusions References
Tables Figures
◭ ◮
◭ ◮
Back Close
Full Screen / Esc
Printer-friendly Version Interactive Discussion
Discussion
P
a
per
|
Dis
cussion
P
a
per
|
Discussion
P
a
per
|
Discussio
n
P
a
per
|
same algorithm has been incorporated into the MOZART-4 model. As the transport algorithms in CAM-chem are similar those that have been incorporated into
MOZART-4, simulating chemistry within the offline version of CAM-chem represents a rather
modest extension to that which has been used for years within MOZART. Recently, the MOZART model has been evaluated both globally and locally (Emmons et al.,
5
2010a; Emmons et al., 2010b). Results from CAM-chem driven by offline meteorology
have been used and evaluated in an international assessment of source sink relation-ships for the Hemispheric Transport of Air Pollution (HTAP) assessment study (Fiore et al., 2009; UNCEC, 2007; Sanderson et al., 2008; Shindell et al., 2008; Anenberg et al., 2009; Reidmiller et al., 2009). In particular Jonson et al. (2010) compared
sim-10
ulated ozone in CAM-chem against ozonesonde measurements. CAM-chem, driven by NCEP/NCAR reanalysis meteorology, has also been shown to simulate the interan-nual ozone variability associated with the Arctic Oscillation, which in many locations is driven by the interannual variability in STE (Hess and Lamarque, 2007). Tropospheric emissions are interannually constant allowing no interannual variability in ozone
pre-15
cursor emissions. Emissions are largely based on the POET emission inventory and are reported in Fiore et al. (2009). The model simulations has two years of spinup prior to 1990.
A unique tagging methodology is used to calculate the portion of tropospheric ozone that can be attributed to transport from the stratosphere. In this methodology emitted
20
odd nitrogen is labeled and subsequently tracked as the nitrogen is physically trans-ported and chemically modified (Hess and Lamarque, 2007). In these simulations we tag all sources of tropospheric odd nitrogen emissions including both natural and anthropogenic emissions. Tropospheric photochemical ozone is defined as that por-tion of ozone produced through the tropospheric photochemical reacpor-tions involving the
25
tagged nitrogen species. Tropospheric photochemical ozone is also destroyed through the simulated photochemistry. By tagging tropospheric photochemical ozone we ex-plicitly quantify the portion of ozone in the troposphere that originates from the
ACPD
11, 22719–22770, 2011Stratospheric impact on tropospheric ozone variability and
trends
P. G. Hess and R. Zbinden
Title Page
Abstract Introduction
Conclusions References
Tables Figures
◭ ◮
◭ ◮
Back Close
Full Screen / Esc
Printer-friendly Version Interactive Discussion
Discussion
P
a
per
|
Dis
cussion
P
a
per
|
Discussion
P
a
per
|
Discussio
n
P
a
per
photochemical ozone. Within dilute biomass burning plumes far from local emission sources, this method of tagging ozone concentrations is equivalent to that estimated
from turning offthe NOxemissions in the first place (Pfister et al., 2006).
Stratospheric ozone is parameterized using a methodology based on that used in McLinden et al. (2000). In the original methodology the production (Tg/yr) of a
syn-5
thetic ozone (Synoz) tracer is specified within the equatorial stratosphere to equal the estimated cross-tropopause stratospheric flux of ozone to the troposphere (McLinden et al., 2000). Within the troposphere Synoz is destroyed. Tropospheric ozone is simply set to the concentration of Synoz at the tropopause. Here, instead of specifying the stratospheric production of Synoz, we specify the concentration of Synoz within the
10
stratospheric source region. The concentrations are obtained from a previous equili-brated simulation where the production of synoz was specified. In a test year, either specifying the concentration of Synoz or specifying the production of Synoz resulted in the same distributions of both ozone and Synoz. However, specifying the concen-tration of Synoz allows the interannual variability due to variations in the atmospheric
15
circulation to be simulated: by specifying the concentration there is no constraint on the amount of Synoz that can be transported from the stratosphere to the troposphere. In the current configuration CAM-chem does not does capture the variability due inter-annual variability in stratospheric chemistry.
3 Simulation overview: average ozone variability north of 30◦N
20
Tropospheric ozone, its component produced through NOx catalyzed tropospheric
chemistry, and its component transported from the stratosphere, are calculated in CAM-chem between 1990 and 2009. Figure 1 gives the time evolution of the ozone AAMD for these various ozone components. The components are calculated north
30◦N for the ozone column below 300 hPa, the 500 hPa ozone concentration
concen-25
tration and ozone column integrated over the first 100 hPa above the surface.
ACPD
11, 22719–22770, 2011Stratospheric impact on tropospheric ozone variability and
trends
P. G. Hess and R. Zbinden
Title Page
Abstract Introduction
Conclusions References
Tables Figures
◭ ◮
◭ ◮
Back Close
Full Screen / Esc
Printer-friendly Version Interactive Discussion
Discussion
P
a
per
|
Dis
cussion
P
a
per
|
Discussion
P
a
per
|
Discussio
n
P
a
per
|
the level it is calculated on. The stratospheric component of ozone increases through-out the record; however, after approximately 1999 the increase is compensated by a decrease in the tropospheric photochemical component of ozone. As a result tropo-spheric ozone increases rather rapidly between 1990 and 1999, reaches a peak in
1999 and then levels off. An analysis of these results allows us to reach the
follow-5
ing conclusions. (i) There is a remarkable degree of vertical homogeneity through-out the troposphere for ozone variations calculated on large spatial scales and long timescales. This suggests these variations are communicated throughout the ozone
column. (ii) The simulated interannual variability of NH ozone north 30◦N is largely
explained by its stratospheric component. The latter explains over 81 % of the variance
10
of the area-averaged ozone at 500 hPa and 77 % of the area-averaged variance in the surface layer. (iii) Much less variability is explained by the stratospheric contribution when sampled at the particular measurement sites given in Table 1. On average the stratosphere explains only 50 % of the variance when evaluated at any particular site at 500 hPa and 25 % of the variance at any particular site at the surface. The simulation
15
suggests that averaging over many sites isolates the common source of variability due to the stratosphere. An explanation of the variability at any single site must invoke more complex mechanisms. (iv) Ozone averaged over all the selected 500 hPa and surface sites in Table 1 gives a good representation of the overall variations in ozone north of
30◦N. The correlation between simulated ozone averaged over all the surface sites in
20
Table 1 and surface ozone averaged north of 30◦N is 0.78; the respective correlation
for the 500 hPa sites is 0.97. Thus averaging ozone over all these sites should be a good proxy for the overall hemispheric ozone variability. (v) Ozone averaged regionally over the individual sites within a region (see Table 1) also gives a good
representa-tion of the overall variarepresenta-tions in ozone north of 30◦N at 500 hPa with the exception of
25
Japan. The 500 hPa simulated ozone variability averaged north of 30◦N explains only
variabil-ACPD
11, 22719–22770, 2011Stratospheric impact on tropospheric ozone variability and
trends
P. G. Hess and R. Zbinden
Title Page
Abstract Introduction
Conclusions References
Tables Figures
◭ ◮
◭ ◮
Back Close
Full Screen / Esc
Printer-friendly Version Interactive Discussion
Discussion
P
a
per
|
Dis
cussion
P
a
per
|
Discussion
P
a
per
|
Discussio
n
P
a
per
ity is strongly impacted by the summer monsoon (Zbinden et al., 2006) especially at the southern sites. We conclude the variability over Japan is not representative of the
large-scale variability. (vi) The simulated ozone trends north of 30◦N are 0.25 ppbv yr−1
at 500 hPa between 1990 and 2000, and 0.11 ppbv yr−1between 1990 and 2009. The
corresponding trends at the surface are 0.18 ppbv yr−1
and 0.07 ppbv yr−1
, respectively.
5
We were initially concerned that the increase in the stratospheric portion of ozone throughout the record (Fig. 1) could be attributed to a poor initialization of Synoz. That is, if the initial simulated concentrations of Synoz were not in equilibrium, then an in-crease in the stratospheric portion of ozone could not necessarily be ascribed circula-tion changes. It might be simply due to an adjustment of Synoz towards equilibrium.
10
To test this hypothesis we ran a number of sensitivity tests. In these sensitivity tests we ran a number of additional simulations of three periods: (A) 1988–1989, (B) 1989– 1990 and (C) 2003–2004. These periods were chosen as representative years towards the beginning of the simulation period when one might expect the simulation to be the most out of equilibrium. In these sensitivity tests we repeated the meteorology from
15
the original simulation year, but allowed the chemistry to evolve; thus, the initial chem-ical condition for each successive simulation were taken as the final condition from the previous simulation of that period. We iterated this process four times over period (A), 3 times over period (B) and 2 times over period (C). While Fig. 2 suggests the simulation rapidly reaches equilibrium after only one iteration, it was instructive to use
20
multiple iterations for selected periods. If the stratospheric portion of the ozone were increasing because Synoz was out of equilibrium then we would expect that Synoz and the stratospheric portion of ozone would continue to increase even if the meteorology were interannually constant. However, the sensitivity tests suggest this is not the case (Fig. 2). Generally we found the portion of stratospheric ozone in the troposphere to
25
ACPD
11, 22719–22770, 2011Stratospheric impact on tropospheric ozone variability and
trends
P. G. Hess and R. Zbinden
Title Page
Abstract Introduction
Conclusions References
Tables Figures
◭ ◮
◭ ◮
Back Close
Full Screen / Esc
Printer-friendly Version Interactive Discussion
Discussion
P
a
per
|
Dis
cussion
P
a
per
|
Discussion
P
a
per
|
Discussio
n
P
a
per
|
the initial conditions (within the range of initial conditions examined). This is particularly striking for the 1988–1989 period when the stratospheric ozone concentration is clearly out of balance during the initial simulation. However, within a year (i.e., 31 December 1988), the stratospheric portion of ozone rapidly equilibrates to a value that appears relatively insensitive to the initial chemical conditions.
5
4 Ozone variability – the observational record
In this section we examine the observation record of ozone variability from the lower stratosphere to the surface for the selected measurement sites (see Table 1) north of
30◦N, between 1990 and 2009.
4.1 Stratospheric regional ozone record
10
We find the six sites in Canada, the five sites within Central Europe, and the three sites within Northern Europe to have regionally robust ozone records and include them in our analysis of the large-scale ozone changes at 150 hPa. Over the Eastern US and over Southern Europe only one ozonesonde measurement is available, precluding us from being able to make a regionally robust assessment of ozone variations in those
15
regions. The correlation amongst the three Japanese sites at 150 hPa is small and in-significant (see Supplement, Table S1). We were concerned that these sites were not correlated because of a tendency for some of the sites to occasionally sample tropo-spheric airmasses at 150 hPa, especially the more southern sites and during the sum-mer months. However, increasing the altitude of the sampling, or examining the
cor-20
relation only during the winter months did not increase the correlations between these sites. Therefore, we conclude that it is unlikely that these sites are not correlated due to tropospheric contamination. The fact that these sites are at a generally low latitude
range (32◦–43◦N) and span a wide latitude range may be a contributing factor to their
low correlations. In summary, we could not isolate a robust regionally coherent signal
ACPD
11, 22719–22770, 2011Stratospheric impact on tropospheric ozone variability and
trends
P. G. Hess and R. Zbinden
Title Page
Abstract Introduction
Conclusions References
Tables Figures
◭ ◮
◭ ◮
Back Close
Full Screen / Esc
Printer-friendly Version Interactive Discussion
Discussion
P
a
per
|
Dis
cussion
P
a
per
|
Discussion
P
a
per
|
Discussio
n
P
a
per
in the lower stratosphere over Japan. The six sites in Canada are positively correlated, with most of the correlations significant at the 95 % level; within the Central European and Northern European regions most of the sites are also highly correlated with each other (see Supplement, Table S1). This suggests combining the measurements within each of these regions gives a regional representation of the ozone variability. We also
5
note that the ozone records are positively correlated at sites across these regions, in many cases with a high degree of significance (see Supplement, Table S1).
The overall stratospheric signal is taken as the average of the normalized ozone AAMD at 150 hPa from the three regionally robust signals: Canada, Northern Europe and Central Europe (Fig. 3a). The correlation between the regional ozone records for
10
the Canadian, Northern European and Central European sites are highly significant (greater than 99 % using a 2-sided Student’s T test). All regions, even those without robust signals have an ozone maximum in 1998–1999 timeframe and a pronounced dip in 2000 (Fig. 3a). An analysis of MOZAIC upper tropospheric and lower stratospheric measurements over Iceland, the Eastern US and Europe also clearly indicates a
pro-15
nounced lower stratospheric ozone anomaly during 1998–1999 timeframe (Thouret et al., 2006). With the exception of Japan the long timescale variability in all regions is also similar: the ozone levels from 2001–2009 are uniformly higher than those prior to 1997, with generally increasing ozone from the early 1990s through most of the first decade of the 21st century. The regional signal from Canada and Northern Europe
20
shows a very high degree of correlation from year to year. The signal from central Europe, while showing the same the large amplitude variability as the Canadian and Northern European signals deviates somewhat in the smaller amplitude variability. This is particularly evident after 1999. The interannual variability in the lower stratospheric ozone record can be attributed to the interplay between stratospheric dynamics and
25
photochemistry (Shepherd, 2008).The lower stratospheric ozone minimum at 150 hPa
ACPD
11, 22719–22770, 2011Stratospheric impact on tropospheric ozone variability and
trends
P. G. Hess and R. Zbinden
Title Page
Abstract Introduction
Conclusions References
Tables Figures
◭ ◮
◭ ◮
Back Close
Full Screen / Esc
Printer-friendly Version Interactive Discussion
Discussion
P
a
per
|
Dis
cussion
P
a
per
|
Discussion
P
a
per
|
Discussio
n
P
a
per
|
4.2 Tropospheric regional ozone record
The normalized measured ozone AAMD for various regions at 500 hPa (see Table 1) are given in Figs. 4 and 5. The correlation between the interannual ozone variations at the 18 ozonesonde sites and at the 3 MOZAIC clusters is given in the Supplement (Ta-ble S2). Of the six regions we use only Northern Europe, the Eastern US, and Canada
5
to construct an overall record of the 500 hPa ozone variation north of 30◦N (Fig. 3b).
We exclude the following regions from our overall analysis: Southern Europe because this region contains only one ozonesonde site; Central Europe because we could not isolate a regionally representative robust signal over this region; and Japan, because both the simulation and the measurements suggest the ozone variations over Japan
10
are not well correlated with either the other measurement sites or with the hemispheric averaged ozone variations (see Fig. 4). Further discussion of the regional records is given below.
All regions show a pronounced ozone peak in 1998–1999, and a minimum in 2000 and 1997, although the minimum over Japan is rather broad (see Fig. 3b; Fig. 4 for
15
selected regional records). Using MOZAIC-derived measurements of tropospheric ozone column Zbinden et al. (2006) also noted the 1998–1999 ozone anomaly ex-tended to three continents. The measurements over Northern Europe and Canada show a pronounced ozone dip between 1991 and 1995; Japan does not show this dip and the ozonesonde record over the Eastern US only extends back to 1995. Oltmans
20
et al. (1998) relates this ozone minimum at high latitudes to the impact of Pinatubo. Within each region the individual measurement sites over the Eastern US, Northern Europe and Canada are highly correlated within their regions (see Fig. 4 and the Sup-plement, Table S2). This is particularly noteworthy for the Canadian sites, as these
encompass a broad range of latitudes and longitudes (Table 1), from 60◦–114◦W and
25
54◦–80◦N. The correlation between the ozone record for the individual Canadian
ACPD
11, 22719–22770, 2011Stratospheric impact on tropospheric ozone variability and
trends
P. G. Hess and R. Zbinden
Title Page
Abstract Introduction
Conclusions References
Tables Figures
◭ ◮
◭ ◮
Back Close
Full Screen / Esc
Printer-friendly Version Interactive Discussion
Discussion
P
a
per
|
Dis
cussion
P
a
per
|
Discussion
P
a
per
|
Discussio
n
P
a
per
The analysis over Central Europe bears somewhat more discussion as the measure-ment network over Europe is particularly dense, and it is frequently used to evaluate model simulations (see Fig. 5). The ozonesonde sites within this region are
gener-ally positively correlated, but not significantly so, with comparatively large differences
in the ozone record between the different sites (see Supplement, Table S2).
Particu-5
larly striking is the fact that the correlation between the European ozonesonde sites and the MOZAIC cluster is generally low and frequently negative. A thorough
dis-cussion of differences in the MOZAIC and ozonesonde measurement can be found
in Schnadt Poberaj et al. (2009), but the MOZAIC record should give more accurate measurements. The central European ozonesonde sites and MOZAIC are all
geo-10
graphically close: the spatial differences between the measurement sites are unlikely
to explain their differences (Schnadt Poberaj et al., 2009). The number of profiles
(14 326, or 88/month on average) in the European MOZAIC cluster during the 1994– 2007 measurement period is much larger than the number of ozonesondes profiles at any particular site. For example at Hohenpeissenberg, the ozonesonde location with
15
the most frequent measurements, 1663 profiles (10/month on average) were taken over
the same period. However, the difference in measurement frequency does not seem to
explain the discrepancy between the ozonesonde and the MOZAIC measurements. To show this we have constructed a record of the MOZAIC measurements taken within a one-day interval of the ozonesonde measurements at Hohenpeissenberg (not shown).
20
Subsampling the MOZAIC record at the frequency of the ozonesonde measurements does not substantially alter the MOZAIC record (not shown) nor does it bring the two sets of measurements into better agreement. We have included one surface station, the Jungfraujoch, as a comparison in Fig. 5. While the Jungfraujoch site (3580 m) is somewhat lower than 500 hPa, the measurements at Jungfraujoch are highly
cor-25
related with the 500 hPa MOZAIC measurements over Europe (R=0.72). They also
corre-ACPD
11, 22719–22770, 2011Stratospheric impact on tropospheric ozone variability and
trends
P. G. Hess and R. Zbinden
Title Page
Abstract Introduction
Conclusions References
Tables Figures
◭ ◮
◭ ◮
Back Close
Full Screen / Esc
Printer-friendly Version Interactive Discussion
Discussion
P
a
per
|
Dis
cussion
P
a
per
|
Discussion
P
a
per
|
Discussio
n
P
a
per
|
lated with any of the European ozonesonde measurement stations during the period 1990–2009.
Nevertheless, we can find the average regional ozone change over Central Europe by simply averaging all the individual ozonesonde profiles and the MOZAIC cluster (Fig. 5). This regionally averaged record is generally consistent with that found in
5
other regions: there is an ozone minimum near 1993, 1997 and 2000, with an ozone maximum in 1999 and a broad maximum in 2003–2005. An ozone maximum from 1994 into 1996 seems to be reflected in most of the station records during this period. However, while the MOZAIC and JungfrauJoch measurements suggest the amplitude of this maximum is less than that of the 1998–1999 maximum, many of the ozonesonde
10
sites suggest this earlier peak is the stronger of the two (i.e., Payerne, Lindenberg, Hohenpeissenberg, Debilt).
4.3 Surface ozone record
As discussed above in Sect. 3, simulated ozone suggests that the variability of surface ozone is sensitive to stratospheric input. Rapid mixing along poleward and upward
15
sloping isentropic surfaces (see Bowman and Carrie, 2002) connects surface ozone changes with upper and middle tropospheric changes thousands of kilometers to the north. In addition, Tang et al. (2011) suggests convection may transport stratospheric ozone to the surface during NH summer. Nevertheless, at the surface local sources of ozone precursor emissions are likely to exert a profound local control on the
variabil-20
ity, linking the variability to local-to regional emission sources and local meteorological variability. Furthermore the surface concentration of ozone transported from the strato-sphere is considerably less than at 500 hPa (see Table 2). Thus any stratospheric
signal at the surface will likely be difficult to detect. This is consistent with our analysis
in Sect. 3 suggesting that the stratosphere has a rather small role in determining the
25
variability of ozone at any particular surface site.
ACPD
11, 22719–22770, 2011Stratospheric impact on tropospheric ozone variability and
trends
P. G. Hess and R. Zbinden
Title Page
Abstract Introduction
Conclusions References
Tables Figures
◭ ◮
◭ ◮
Back Close
Full Screen / Esc
Printer-friendly Version Interactive Discussion
Discussion
P
a
per
|
Dis
cussion
P
a
per
|
Discussion
P
a
per
|
Discussio
n
P
a
per
surface sites that clearly show the 1998–1999 ozone anomaly (see Fig. 6). Many sur-face sites do not show this major ozone anomaly, in particular the many sursur-face sites
over the interior western US analyzed by Jaffe and Ray (2007). A list of the particular
surface sites analyzed here is given in Table 1. These sites have diverse geographic locations and altitudes between sea level and 3580 m. With the exception of the Egbert
5
site over Southeastern Canada, the correlation amongst these surface sites tends to be highly significant and great than 0.45 (see Supplement, Table S3). We show only one elevated site over Central Europe, the Jungfraujoch; however, the interannual cor-relation of ozone measured at all the elevated surface sites we examined in Central Europe (Jungfraujoch, Payerne, Rigi and Sonnblich) is highly significant (not shown).
10
The correlation between each of these sites and Macehead (at sea level) is also highly significant, suggesting a common cause of variance with incoming air over the Atlantic. We discuss the Macehead site measurements in more detail in Sect. 5.1. Ryori, the Japanese surface site is significantly correlated with the European sites examined (see Supplement, Table S3). The Canadian site (Egbert) is positively correlated with all the
15
other sites, although only significantly at Jungfraujoch. The ozone evolution at these sites has many of the characteristics noted previously at 500 and 150 hPa: ozone min-ima near 1993, ozone maxmin-ima in 1999 and generally elevated ozone levels after 1999. It is important to emphasize that we have not completed a comprehensive analysis of all surface sites, we have merely selected a few with a common signal.
20
4.4 Summary: the impact of the stratosphere on the troposphere
The record of normalized ozone AAMD at 500 hPa for the various examined regions is given in Fig. 3b. In addition this figure shows the oveall signal averaged over those regions with a robust and representative signal (Canada, the Eastern US and Northern Europe). The similarity between ozone averaged over those regions with a robust
25
ACPD
11, 22719–22770, 2011Stratospheric impact on tropospheric ozone variability and
trends
P. G. Hess and R. Zbinden
Title Page
Abstract Introduction
Conclusions References
Tables Figures
◭ ◮
◭ ◮
Back Close
Full Screen / Esc
Printer-friendly Version Interactive Discussion
Discussion
P
a
per
|
Dis
cussion
P
a
per
|
Discussion
P
a
per
|
Discussio
n
P
a
per
|
tropospheric record, while the 500 hPa peak in overall tropospheric ozone record in 2003 is evident in the Central European stratospheric record, but not in the Canadian or Northern European records. The common variability between the stratosphere and troposphere appears to be largely due to the impact of large-scale events: the relatively small ozone concentrations in 1993, the high concentrations in 1998–1999, and the
5
overall increase of ozone from the 1990s to the first decade of the 21st century. The average measured overall stratospheric signal (averaged over the Canadian, Northern European and Central European regions) explains 69 % of the averaged mea-sured overall tropospheric variability at 500 hPa (averaged over the Canadian, Northern European and Eastern US regions); when examined over each of these tropospheric
10
regions individually the overall averaged stratospheric signal explains less of the vari-ability, between 42 and 56 % (although still significant at the 99 % level).. By averaging the 500 hPa ozone signal over distinct regions we increase the common variance and minimize the regional impacts. This acts to isolate the long-timescale, large spatial scale processes.
15
The measurements only sample the stratosphere and troposphere over a few dis-tinct regions. To what extent are these regions and their correlation indicative of the
simulated hemispheric-wide correlation (i.e., 30–90◦N) between tropospheric ozone
and its stratospheric component? Without additional data it is impossible to say defini-tively. In the stratosphere, the analyzed data come from a geographically wide range
20
of measurements, spanning from Edmonton at 114◦W and 54◦N to Sodankyla at 27◦E
and 67◦N. The correlation between the Edmonton and Sodankyla timeseries is 0.76
(Supplement, Table S2) and the correlation between the different stratospheric regions
with robust data is always greater than 0.70. With the high correlation between dis-tinct regional signals, the vertical stability of the stratosphere, and the relatively high
25
ACPD
11, 22719–22770, 2011Stratospheric impact on tropospheric ozone variability and
trends
P. G. Hess and R. Zbinden
Title Page
Abstract Introduction
Conclusions References
Tables Figures
◭ ◮
◭ ◮
Back Close
Full Screen / Esc
Printer-friendly Version Interactive Discussion
Discussion
P
a
per
|
Dis
cussion
P
a
per
|
Discussion
P
a
per
|
Discussio
n
P
a
per
not appear to be representative of the larger scale tropospheric signal. In addition, the regional variability is larger in the troposphere than the stratosphere. Thus we must largely rely on the model simulation to conclude that stratospheric ozone variability im-pacts the troposphere on hemispheric scales. The correlation between the regional records from the regions with a robust signal at 500 hPa (the Eastern US, Canadian
5
and Northern Europian regions) are in the range 0.4–0.5. The simulated correlations between these regions are in the range 0.79–0.95, significantly larger than the mea-sured correlations. This suggests the impact of measurement noise and/or the fact that a substantial portion of regional tropospheric variability is not simulated. As discussed
in connection with Fig. 1 the simulation suggests that 81 % of the 30–90◦N averaged
10
500 hPa ozone variability is explained by the simulated stratospheric ozone compo-nent. Furthermore we find that simulated regionally averaged ozone is representative
of the large-scale 30–90◦N variability.
Terao et al. (2008) examined the vertical correlation of monthly ozone anomaly devi-ations throughout the NH. They found the vertical correldevi-ations between locdevi-ations within
15
the troposphere are geographically indistinct. This suggests rapid tropospheric mixing and is consistent with our results in Fig. 1. However, Terao et al. (2008) found the correlations between the stratosphere and troposphere to have a distinct geographical signature. It is perhaps not too surprising that on monthly timescales regional changes in the jet streams or position of cyclones may have vertically deep impacts on ozone
20
transport within well-defined regions. In this paper, however, we are looking for corre-lations between stratospheric and tropospheric ozone on interannual timescales and on large spatial scales. The longer timescales examined in this study would tend to mix local ozone anomalies over a larger region. Some evidence for this can be found in Hsu and Prather (2009): within a few months they show the more localized ozone
25
ACPD
11, 22719–22770, 2011Stratospheric impact on tropospheric ozone variability and
trends
P. G. Hess and R. Zbinden
Title Page
Abstract Introduction
Conclusions References
Tables Figures
◭ ◮
◭ ◮
Back Close
Full Screen / Esc
Printer-friendly Version Interactive Discussion
Discussion
P
a
per
|
Dis
cussion
P
a
per
|
Discussion
P
a
per
|
Discussio
n
P
a
per
|
5 Simulated interannual ozone variability
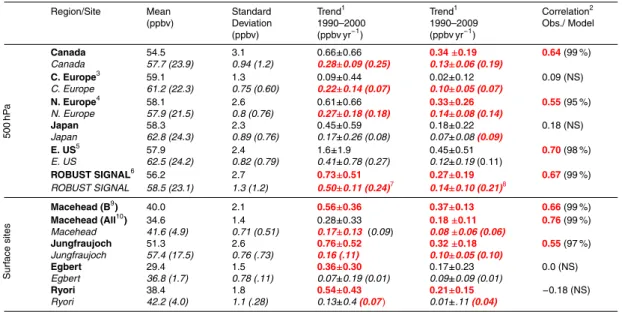
Simulated and measured ozone variability, trends and correlations are given in Table 2. As stratospheric ozone is parameterized in our model we have restricted our analy-sis to the troposphere. Calculated correlations between the model and measurements (Table 2) exclude the period between 1991 and 1995 due to the influence of Pinatubo
5
at 500 hPa, but include this period at the surface. The impact of Mt. Pinatubo on sur-face ozone concentrations does not appear to be large (Fig. 6). The experimental design is only intended to capture ozone variability due to meteorological influences and thus will not capture the chemical impacts of the Mt. Pinatubo eruption. However, in evaluating the measured and modeled ozone trends we do include the Mt. Pinatubo
10
period. The measured trends are likely to be somewhat impacted by Mt. Pinatubo; however, as the analysis period begins prior to Mt. Pinatubo the impact will not play a major role in the trend calculation. Model-measurement comparisons at surface sites
are difficult, as the model does not simulate heterogeneities in local emissions and
meteorology. At the high altitude station of the Jungfraujoch we sample the model at
15
the elevation of the site and not in the simulated surface layer as the model is not able to resolve the actual topography. This type of sampling does not account for the fact that under certain meteorological conditions elevated sites do not measure free-tropospheric air. At Macehead we present both filtered and unfiltered measurements of ozone, where the filtered measurements are those with trajectories from the clean
20
air sector over the Atlantic Basin (Derwent et al., 2007). The filtered record is designed to represent the baseline conditions at Macehead (Derwent et al., 2007). The monthly averaged monthly model output makes it impossible to filter the simulated record for the baseline conditions at Macehead. The model output should be compared to the un-filtered record, although it is noteworthy that the baseline and unun-filtered ozone records
25
at Macehead are highly correlated.
ACPD
11, 22719–22770, 2011Stratospheric impact on tropospheric ozone variability and
trends
P. G. Hess and R. Zbinden
Title Page
Abstract Introduction
Conclusions References
Tables Figures
◭ ◮
◭ ◮
Back Close
Full Screen / Esc
Printer-friendly Version Interactive Discussion
Discussion
P
a
per
|
Dis
cussion
P
a
per
|
Discussion
P
a
per
|
Discussio
n
P
a
per
substantial (Table 2). The simulated stratospheric ozone ranges from over 20 ppbv at the 500 hPa sites to approximately 1–4 ppbv at the lower altitude surface sites. The simulated ozone variance is significantly less than that observed. Note that while the interannual variability in emissions is constant, Pozzoli et al. (2011) suggest emission variability contributes little to the large-scale ozone variability. The variability of the
5
stratospheric portion of simulated ozone accounts for well over 50 % of the total vari-ability for all the 500 hPa regions, as well as at Jungfraujoch and at Macehead.
The simulated ozone is significantly correlated with the measured ozone record in those regions with a regionally robust measured signal at 500 hPa, i.e. Canada
(R=0.64), Eastern US (R=0.70) and Northern Europe (R=0.55) (Table 2 and Fig. 7).
10
Note, that the observed ozone minimum in 1993–1994 attributed to Pinatubo is not captured in the simulation (Fig. 7). Over Canada, Northern Europe and the Eastern US the simulation is particularly good, although simulated ozone tends to be too low near the beginning of the period. Nevertheless, the simulation clearly captures the sharp increase in ozone between 1995 and 1999, the 1998–1999 ozone maximum,
15
and the flattening of the ozone trend subsequent to 1999. The simulated ozone max-imum in 2001 in Canada, the Eastern US, Northern and Central Europe is weakly seen in the Canadian measurements, but not in the other regions; the measured max-imum in 2003 over Northern Europe and the Canada is not particularly well captured in the simulation. Averaged over the Canadian, US and Northern European regions
20
at 500 hPa simulated stratospheric ozone explains 81 % of the ozone variability; ozone averaged over the regions with a robust measured signal at 150 hPa explains 69 % of the measured troposphere variability over these same three regions.
Over Central Europe the simulated and measured ozone are not correlated, although it is important to note that the measurement record over this region is not robust. The
25
ACPD
11, 22719–22770, 2011Stratospheric impact on tropospheric ozone variability and
trends
P. G. Hess and R. Zbinden
Title Page
Abstract Introduction
Conclusions References
Tables Figures
◭ ◮
◭ ◮
Back Close
Full Screen / Esc
Printer-friendly Version Interactive Discussion
Discussion
P
a
per
|
Dis
cussion
P
a
per
|
Discussion
P
a
per
|
Discussio
n
P
a
per
|
number of the measured peak ozone events are captured by the simulation including 1996, 1999, 2004 and 2006, although there are some discrepancies in amplitude and timing.
The model simulation over Japan does not capture the measured interannual vari-ability. The measurement sites over Japan, as previously seen from observations and
5
the model simulation, are not representative of the northern mid-latitude ozone vari-ability.
Simulated ozone is significantly correlated with the measurements at two out of the
four surface sites examined, i.e., Macehead (R=0.66) and Jungfraujoch (R=0.55).
The measured ozone records at other high altitude measurement sites over Europe
10
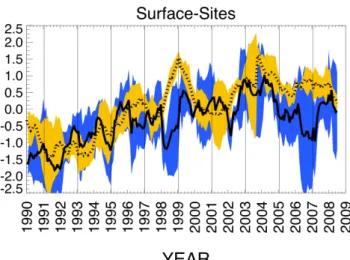
are similar to that at the Jungfraujoch (Ordonez et al., 2007) and are not further an-alyzed here. The modeled and measured ozone record at all four surface sites is given in Fig. 8. For all the surface sites examined both the model and measurements show a generally increasing ozone trend throughout the 1990s. In 1999 both model and measurements have an ozone maximum, although the simulated maximum is not
15
particularly pronounced. Both simulation and measurements show a maximum in the 2003–2004 timeframe. Over Europe the 2003 heat wave likely contributes to this max-imum. Simulated ozone generally shows more normalized variability amongst these surface measurement sites than observed, with pronounced ozone minimums in 1998 and 2006. The correlation between the average simulated and measured ozone
nor-20
malized AAMD over these four surface sites is highly significant (0.66).
The simulated and measured trends at 500 hPa over the two periods are all pos-itive in each of the regions examined, but their significance is very much regionally dependent. However, the 500 hPa measured and simulated ozone trends averaged over the regions with a robust measured signal (Canada, Northern Europe and the
25
ACPD
11, 22719–22770, 2011Stratospheric impact on tropospheric ozone variability and
trends
P. G. Hess and R. Zbinden
Title Page
Abstract Introduction
Conclusions References
Tables Figures
◭ ◮
◭ ◮
Back Close
Full Screen / Esc
Printer-friendly Version Interactive Discussion
Discussion
P
a
per
|
Dis
cussion
P
a
per
|
Discussion
P
a
per
|
Discussio
n
P
a
per
two or more valid measurements on a particular date are not included in the calcu-lation. When the simulated data is not filtered (i.e., all the data is used) the
simu-lated trends decrease substantially; 0.29±0.10 ppbv yr−1between 1990 and 2000 (with
73 % of the trend due increases in stratospheric ozone), and 0.13±0.05 ppbv yr−1from
1990–2009 (with 100 % of the trend explainable by increases in stratospheric ozone).
5
These trends should be compared to the simulated 500 hPa ozone trend north of 30◦N
noted in Sect. 3 (.25 ppbv yr−1 and 0.11 ppbv yr−1during 1990–2000 and 1990–2009,
respectively). Note, in any case, that both simulated and observed trends at 500 hpa have decreased during the last ten years.
At the surface measured trends are everywhere positive and significant except for
10
the unfiltered trend at Macehead between 1990 and 2000, and the long-term trend at Egbert. The simulated surface trend is positive everywhere, but only significant at Macehead and Jungfraujoch. At the latter two locations most of the simulated trend can be traced to increases in stratospheric ozone. In general the simulated surface trends tend to underestimate the measured trends. The simulated and analyzed record at
15
Macehead is examined in more detail in the section below.
5.1 Record at Macehead
The ozone record at Macehead has been discussed in detail in the literature and is often cited as evidence that “background” ozone trends are increasing (e.g., Parrish et al., 2009). Here we examine the simulated and measured ozone at Macehead more
20
specifically. Figure 9 shows the measured and simulated ozone signal at Macehead. Simulated ozone is highly correlated with both the filtered and unfiltered measurement records, although the correlation with unfiltered ozone is somewhat higher (Table 2). Simulated ozone captures the 1999, 2004 ozone peaks and the 2001 and 2005 mini-mums, but does not capture a number of the details of the measured record between
25
ACPD
11, 22719–22770, 2011Stratospheric impact on tropospheric ozone variability and
trends
P. G. Hess and R. Zbinden
Title Page
Abstract Introduction
Conclusions References
Tables Figures
◭ ◮
◭ ◮
Back Close
Full Screen / Esc
Printer-friendly Version Interactive Discussion
Discussion
P
a
per
|
Dis
cussion
P
a
per
|
Discussion
P
a
per
|
Discussio
n
P
a
per
|
filtered measurement record, unfiltered measurement record and model simulation is, respectively, on average 4.1, 1.9 and 1.0 ppbv higher subsequent to 1999 than prior to 1997.
The correlations between the overall stratospheric ozone signal (Fig. 3a) and mea-sured baseline ozone, unfiltered ozone and simulated surface ozone at Macehead
5
(Fig. 6 and 9) are 0.73, 0.63 and 0.52, respectively. The simulated correlation be-tween ozone and its stratospheric component at Macehead is 0.58. Each of these correlations is significant at greater than 98 %, using a 2-sided Student’s T test. The Macehead ozone record is also highly correlated with ozone measured over the ele-vated surface sites over Europe (see Supplement, Table S3). It has been previously
10
suggested that stratospheric variations are responsible for the ozone trends at the el-evated surface sites of Jungfraujoch and Zugspitze (Ordonez et al., 2007). Eighty percent of the simulated jump in ozone between the period prior to 1997 and sub-sequent to 1999 is due to increases in the stratospheric component of ozone. This measurement analysis and model simulation strongly suggests that the stratosphere
15
exerts a strong source of variability at both Macehead and the elevated surface sites over Europe.
The increasing surface ozone trends at Macehead Ireland (Simmonds et al., 2004;
Carslaw, 2005; Derwent et al., 2007) have been difficult to explain as this site is far
removed from Asia, with its large increases in emissions. Instead Macehead should be
20
more directly impacted by emission decreases over the US and Europe. Calculations and simulations (Lamarque et al., 2010; Fiore et al., 2009) suggest global emission
changes are not sufficient to explain the measured trends at Macehead. We find that
the simulated trend at Macehead between 1990 and 2009 is 0.08 ppbv yr−1, with 75 %
of the trend due to increases in the stratospheric component of ozone. Combining this
25
simulated trend (only due to changes in circulation) with the estimated trend at Mace-head due to changes in emissions gives a trend reasonably consistent with that
ob-served. A tagged tracer of ozone produced from 6 Tg N of NOxemitted from East Asia