ACPD
11, 20757–20792, 2011Analysis of linear long-term trend of
AOT derived from SeaWiFS using BAER
J. Yoon et al.
Title Page
Abstract Introduction
Conclusions References
Tables Figures
◭ ◮
◭ ◮
Back Close
Full Screen / Esc
Printer-friendly Version
Interactive Discussion
Discussion
P
a
per
|
Dis
cussion
P
a
per
|
Discussion
P
a
per
|
Discussio
n
P
a
per
|
Atmos. Chem. Phys. Discuss., 11, 20757–20792, 2011 www.atmos-chem-phys-discuss.net/11/20757/2011/ doi:10.5194/acpd-11-20757-2011
© Author(s) 2011. CC Attribution 3.0 License.
Atmospheric Chemistry and Physics Discussions
This discussion paper is/has been under review for the journal Atmospheric Chemistry and Physics (ACP). Please refer to the corresponding final paper in ACP if available.
Analysis of linear long-term trend of
aerosol optical thickness derived from
SeaWiFS using BAER over Europe and
South China
J. Yoon, W. von Hoyningen-Huene, M. Vountas, and J. P. Burrows
Institute of Environmental Physics, University of Bremen, Bremen, Germany
Received: 17 June 2011 – Accepted: 18 July 2011 – Published: 21 July 2011
Correspondence to: J. Yoon ([email protected])
Published by Copernicus Publications on behalf of the European Geosciences Union.
ACPD
11, 20757–20792, 2011Analysis of linear long-term trend of
AOT derived from SeaWiFS using BAER
J. Yoon et al.
Title Page
Abstract Introduction
Conclusions References
Tables Figures
◭ ◮
◭ ◮
Back Close
Full Screen / Esc
Printer-friendly Version
Interactive Discussion
Discussion
P
a
per
|
Dis
cussion
P
a
per
|
Discussion
P
a
per
|
Discussio
n
P
a
per
|
Abstract
The main purpose of the present paper is to derive and discuss linear long-term trends of Aerosol Optical Thickness (AOT) at 443 and 555 nm over regions in Europe and South China. These areas are densely populated and highly polluted. The study uses the Bremen AErosol Retrieval (BAER) and Sea-viewing Wide Field-of-view
Sen-5
sor (SeaWiFS) data for AOT retrievals in the specified regions from October 1997 to May 2008. In order to validate the individually retrieved AOTs and the correspond-ing trends, AErosol RObotic NETwork (AERONET) level 2.0 data have been used. The retrieved AOTs were in good agreement with those of AERONET (0.79≤R≤0.88, 0.08≤RMSD≤0.13). The contamination of BAER aerosol retrievals and/or AERONET
10
observations by thin clouds can significantly degrade the AOT and lead to statistically non-representative monthly-means, especially during cloudy seasons. Therefore an inter-correction method has been developed and applied. The “corrected” trends for both BAER SeaWiFS and AERONET AOT were similar having an average of relative error∼25.19 %. In general terms, negative trends (decrease of aerosol loading) were
15
mainly observed over European regions, with magnitudes up to−0.00453 (−1.93 %) and −0.00484 (−2.35 %) per year at 443 and 555 nm, respectively. In contrast, the trend in Pearl River Delta was positive, most likely attributed to rapid urbanization and industrialization. The magnitudes of AOT increased by +0.00761 (+1.24 %) and +0.00625 (+1.15 %) per year respectively at 443 and 555 nm.
20
1 Introduction
There are many kinds of aerosols in the atmosphere. The increase of anthropogenic pollutants such as urban and industrial aerosols has been identified as a serious health issue (WHO, 1987, 2000, 2005) in the past decades. These increases are attributed to substantial industrialization and change of land use. This is not only deteriorating
25
ACPD
11, 20757–20792, 2011Analysis of linear long-term trend of
AOT derived from SeaWiFS using BAER
J. Yoon et al.
Title Page
Abstract Introduction
Conclusions References
Tables Figures
◭ ◮
◭ ◮
Back Close
Full Screen / Esc
Printer-friendly Version
Interactive Discussion
Discussion
P
a
per
|
Dis
cussion
P
a
per
|
Discussion
P
a
per
|
Discussio
n
P
a
per
|
balance in the atmosphere and climate systems. In order to improve the scientific understanding of aerosol changes and their impact on radiative forcing to support the evolution of environmental policy, it is necessary that the temporal changes of aerosol loading are observed globally.
The monitoring of aerosols using global retrieval techniques from satellite
obser-5
vations is potentially one of the most effective methods to obtain the global distribu-tion and temporal variadistribu-tion of aerosol amount. Several algorithms using, for example, Advanced Very High Resolution Radiometer (AVHRR), Total Ozone Mapping Spec-trometer (TOMS)/Ozone Monitoring Instrument (OMI), Multi-angle Imaging SpectroRa-diometer (MISR), Moderate Resolution Imaging SpectroraSpectroRa-diometer (MODIS), and
Sea-10
viewing Wide Field-of-view Sensor (SeaWiFS) on polar-orbiting satellites (Remer et al., 2005; Kaufman et al., 1997; Higurashi and Nakajima, 1999; Mishchenko et al., 1999; Jeong et al., 2005; Higurashi et al., 2000; Stowe et al., 1999; Heidinger et al., 2004; Torres et al., 2002; DiGirolamo and Wilson, 2003; Martonchik et al., 2004; Diner et al., 2006; Martins et al., 2002; Robbinson et al., 2003; Wang and Shi, 2005) have been
15
developed to retrieve the global Aerosol Optical Thickness (AOT). Up to now AVHRR, TOMS/OMI, and MODIS have been used in the analysis of global and regional aerosol trends, because they have continuous and long-term observation histories.
Mishchenko et al. (2007) and Mishchenko and Geogdzhayev (2007) derived aerosol trends from long-term satellite records, utilizing AVHRR channels one and two over
20
oceans. In their publications, they provided a comprehensive data set and global as well as regional trends of tropospheric aerosol from August 1981 to June 2005. They concluded that the observed decrease of the global trend of tropospheric AOT may have contributed to the upward trend in surface solar fluxes. Zhao et al. (2008) provided a more detailed statistical analysis of global and regional AOT trends using
25
the AVHRR Pathfinder Atmosphere (PATMOS) climate data set. They added uncer-tainty tests, taking into account the effects of grid size, aerosol retrieval algorithm, and radiance calibration. Additionally, Zhang and Reid (2010) explained both regional and global aerosol trends above oceans using MODIS and MISR aerosol products
ACPD
11, 20757–20792, 2011Analysis of linear long-term trend of
AOT derived from SeaWiFS using BAER
J. Yoon et al.
Title Page
Abstract Introduction
Conclusions References
Tables Figures
◭ ◮
◭ ◮
Back Close
Full Screen / Esc
Printer-friendly Version
Interactive Discussion
Discussion
P
a
per
|
Dis
cussion
P
a
per
|
Discussion
P
a
per
|
Discussio
n
P
a
per
|
(2000–2009), which included both level 2 and level 3 (data assimilation) data sets. Yu et al. (2009) examined the seasonal and geographical variability of marine aerosol fine-mode fraction from MODIS collection 5 data. They also described that the variability is consistent with the Goddard Chemistry Aerosol Radiation Transport (GOCART) and Global Modelling Initiative (GMI) model simulations. Up to this point, all publications
5
focussed on AOT trend derivation and analysis of the datasets over oceans only. The relatively short lifetime of aerosols means that these findings cannot be generalized for trends of anthropogenic aerosols emitted over land. Massie et al. (2004) attempted to derive regional patterns of aerosol over land and water from TOMS and their temporal trends from 1979 to 2000. They related the trends to regional sulphur dioxide
emis-10
sions over the same time period. However, aerosol layer height and sub-pixel cloud contamination have a serious influence on the retrieval accuracy of aerosol using the near ultraviolet channel of TOMS (Herman, 1997; Torres et al., 1998, 2002). Karnieli et al. (2009) provided temporal trends of anthropogenic sulphur aerosol transported from central and Eastern Europe to Israel with independent data sets such as
MODIS-15
Terra, CIMEL sun/sky photometer, and PM10 Stacked Filter Unit sampler. de Meij et al. (2010) investigated the global and regional trends of AOT over land for the period of a decade (2000–2009) derived from MODIS, MISR and AErosol RObotic NETwork (AERONET) as well as the emission estimates from the Co-operative Programme for Monitoring and Evaluation of the Long-range Transmission of Air Pollutants (EMEP)
20
for Europe, the Region Emission Inventory for Asia (REAS) and the Intergovernmental Panel on Climate Change (IPCC, RCP 3PD) for North America and the entire globe. It remains a challenging task to retrieve accurate AOTs over land using satellite obser-vations (aerosol retrieval uncertainty;±30∼20 % for TOMS, Torres et al., 2002;±20 % for MISR, Kahn et al., 2005a, 2010; and±15 % for MODIS, Remer et al., 2008; Levy
25
ACPD
11, 20757–20792, 2011Analysis of linear long-term trend of
AOT derived from SeaWiFS using BAER
J. Yoon et al.
Title Page
Abstract Introduction
Conclusions References
Tables Figures
◭ ◮
◭ ◮
Back Close
Full Screen / Esc
Printer-friendly Version
Interactive Discussion
Discussion
P
a
per
|
Dis
cussion
P
a
per
|
Discussion
P
a
per
|
Discussio
n
P
a
per
|
This manuscript has two foci: Firstly, The derivation of aerosol temporal trends over land and water and secondly the improvement of the trend analysis, thereby providing a better understanding of aerosol radiative forcing. This supports the develop evo-lution and assessment of environmental policy for air quality over Europe and South China. Previous investigations have emphasized and focused on the retrieval of
ac-5
curate AOT by improving sensor calibration and the AOT retrieval algorithm. However only a few have investigated AOT trends over land, where most of the anthropogenic aerosols are emitted. As mentioned before, there is a lack of investigations taking into account from subtle thin cloud contamination of the AOT averages within AOT trend analysis. Trend analysis based on annual, seasonal, or monthly averages could
10
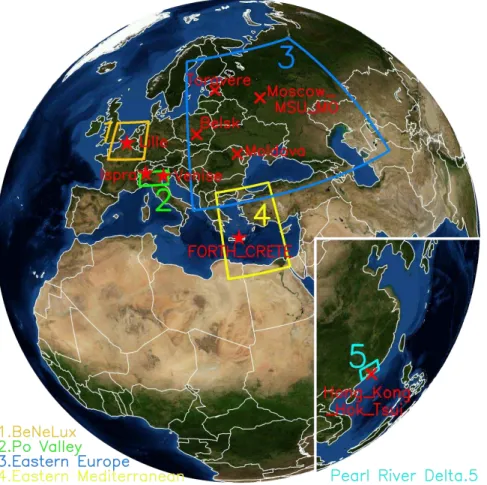
be significantly biased due to statistically unrepresentative averages calculated from a small number of cloud free observations. This study analyzes the AOT trends taking this key issue into account over Europe and South China regions (BeNeLux – Bel-gium/Netherlands/Luxemburg, Po Valley, Eastern Europe, Eastern Mediterranean, and Pearl River Delta, shown by Fig. 1 and listed in Table 1). Thses centers of population
15
have been assigned within the CityZen project (megaCITY – Zoom for the Environment: EU 24 Framework Programme 7 of European Commission) as being of particular sig-nificance. CityZen aims to determine the air pollution distribution and change in and around the selected hotspots over the last decade (https://wiki.met.no/cityzen/start).
In the following sections of this manuscript, the derivation of the linear long-term
20
trends of AOT over selected regions using Bremen AErosol Retrieval (BAER) (von Hoyningen-Huene et al., 2003, 2006, 2011; Lee et al., 2004) and SeaWiFS data is explained. Since the aerosol retrieval accuracy over land based on space-based ob-servations is influenced by various factors, the retrieved AOTs and trends determined are compared with those from ground-based AERONET level 2.0 data. This network
25
of ground-based observations does not only provide accurate AOTs (accuracy;±0.01, Holben et al., 1998), but also various aerosol characteristics (volume size distribution, complex index of refraction, phase functions, Single Scattering Albedo – SSA, and more). In the second section BAER and data sets (SeaWiFS and AERONET data)
ACPD
11, 20757–20792, 2011Analysis of linear long-term trend of
AOT derived from SeaWiFS using BAER
J. Yoon et al.
Title Page
Abstract Introduction
Conclusions References
Tables Figures
◭ ◮
◭ ◮
Back Close
Full Screen / Esc
Printer-friendly Version
Interactive Discussion
Discussion
P
a
per
|
Dis
cussion
P
a
per
|
Discussion
P
a
per
|
Discussio
n
P
a
per
|
adopted for this study will be briefly described. In the third section, we will demonstrate the accuracy ofindividual BAER AOT by comparisons to AERONET data. In order to investigate the feasibility and uncertainty of AOT trends, we will also provide first com-parisons of BAER to AERONET AOT trends by applying the inter-correction method for non-representative monthly AOTs. Additionally, uncertainties resulting from cloud
dis-5
turbance are discussed in the third section. In the fourth section, seasonal and annual AOT trends derived from SeaWiFS data as well as aerosol characteristics (volume size distribution and SSA) from AERONET inversion data will be analyzed together over specific regions shown in Fig. 1 and Table 1. Our conclusions will be summarized in the final section.
10
2 Bremen AErosol Retrieval (BAER) and data sets
The Bremen AErosol Retrieval (BAER) is employed to retrieve AOTs over land and ocean, using various sensors (i.e. MEdium Resolution Imaging Spectrometer (MERIS), SeaWiFS, and MODIS) over specific regions. The validity of this approach has been demonstrated convincingly in previous studies (von Hoyningen-Huene et al., 2003,
15
2006, 2011; Lee et al., 2004). Its main features are designed using multi-spectral sep-aration techniques to discriminate spectral surfaces and atmospheric properties. For instance, SeaWiFS data for channels 2 and 5 (443 and 555 nm), both of which are less influenced by land surface are used to retrieve the AOT. On the other hand, SeaWiFS data at channels 6 and 8 (670 and 865 nm) were utilized to estimate the surface
contri-20
bution using Normalized Differential Vegetation Index (NDVI). More details and further information about the uncertainties of the BAER were comprehensively discussed in von Hoyningen-Huene et al. (2011).
Before analyzing the climatological AOT change, we shall briefly discuss the aspect of radiance calibration which is a well-known major source of uncertainty in AOT
re-25
ACPD
11, 20757–20792, 2011Analysis of linear long-term trend of
AOT derived from SeaWiFS using BAER
J. Yoon et al.
Title Page
Abstract Introduction
Conclusions References
Tables Figures
◭ ◮
◭ ◮
Back Close
Full Screen / Esc
Printer-friendly Version
Interactive Discussion
Discussion
P
a
per
|
Dis
cussion
P
a
per
|
Discussion
P
a
per
|
Discussio
n
P
a
per
|
calibration, inter-satellite calibration, lunar calibration, and comparison with in situ data, have been applied and discussed thoroughly by Li et al. (2009). Recently, calibration accuracies have been improved remarkably, but differ between modern (MISR;∼3 % accuracy, Kahn et al., 2005b; Bruegge et al., 2007; MODIS;∼2 % accuracy, Li et al., 2009) and “transitional” sensors (AVHRR-GACP;∼5 % accuracy, Rossow and Sciffer,
5
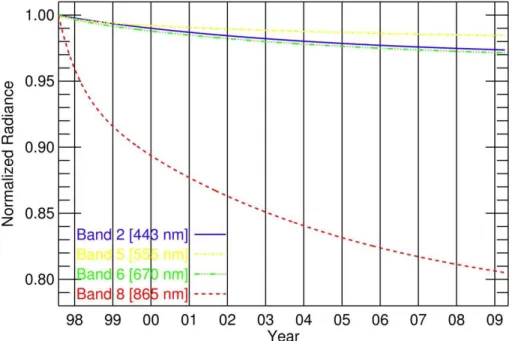
1999; AVHRR-PATMOS;∼3–5 % accuracy, Heidinger et al., 2002; TOMS;∼2 % accu-racy, Li et al., 2009). From the perspective of on-board, lunar (Barnes et al., 2001), and vicarious calibrations (Gordon, 1998; Eplee et al., 2001), SeaWiFS is one of the most accurate and stable sensors (0.5 % accuracy and 0.3 % stability (Li et al., 2009). An example of SeaWiFS normalized radiances by applying the lunar calibration in the
10
fifth reprocessing for channels 2, 5, 6, and 8 (443, 555, 670, and 865 nm, respectively) is depicted in Fig. 2. In addition, this sensor has provided almost continuous radiances since its launch in August 1997. These are crucially required for the trend analysis. Therefore, this study employed SeaWiFS level 1 (L1B) data in order to retrieve AOTs in the specific regions from October 1997 to May 2008. More detailed information on the
15
major instrument parameters and characteristics of SeaWiFS are presented in Hooker et al. (1992) and Cracknell et al. (2001).
In order to validate the results retrieved using BAER, Level 2.0 (pre- and post-field calibration applied, cloud-screened, and quality-assured) AERONET data were used (Holben et al., 1998, 2001; Eck et al., 1999; Smirnov et al., 2000).
Addition-20
ally, AERONET inversion products from sky radiances at all available wavelengths and scattering angles are available to provide useful information about aerosol optical prop-erties such as volume size distribution, complex index of refraction, phase functions, Single Scattering Albedo (SSA), and so on. The AERONET inversion process and research activities were described by Dubovik and King (2000), Dubovik et al. (2000,
25
2001, 2002, 2006), and Sinyuk et al. (2007). In this study, the volume size distribution and SSA were selected to understand seasonal and annual aerosol characteristics at all available AERONET stations within the selected regions (Table 1). Table 1 explains what kind of AERONET data were used for three purposes: (I) validation of BAER
ACPD
11, 20757–20792, 2011Analysis of linear long-term trend of
AOT derived from SeaWiFS using BAER
J. Yoon et al.
Title Page
Abstract Introduction
Conclusions References
Tables Figures
◭ ◮
◭ ◮
Back Close
Full Screen / Esc
Printer-friendly Version
Interactive Discussion
Discussion
P
a
per
|
Dis
cussion
P
a
per
|
Discussion
P
a
per
|
Discussio
n
P
a
per
|
retrieved AOTs, (II) validation of BAER AOT trends, and (III) investigation of climatolog-ical aerosol characteristics.
3 Validation of BAER retrieved AOTs and their trends
For obvious reasons, the validation process of the AOT retrievals based on satellite observations is one important part of this study. The most important uncertainties in
5
aerosol retrieval arise from unscreened thin cloud, knowledge of the relatively strong surface reflectance, and the identification of varying aerosol types. Therefore, an anal-ysis of the reliability and accuracy of BAER retrieved AOTs at 443 and 555 nm is re-quired and achieved by comparison to independent data. In this study, AERONET Level 2 AOTs at selected stations (locations labelled with red stars in Fig. 1) having a
10
long observation history were used for the validation. The AERONET AOT at 555 nm was derived using AERONET ˚Angstr ¨om Exponent (computed by two AOTs at 440 and 675 nm) and AOT at 675 nm. Prior to the validation process, an essential step is to identify and remove cloud-contaminated scenes from the satellite retrievals. Cloud pix-els were screened out by (1) a reflectance threshold for the minimum cloud reflectance
15
(Kokhanovsky, 2001), (2) checking for decreased spectral Top Of Atmosphere (TOA) reflectance in the blue bands, (3) checking for increased heterogeneity within 5×5 pix-els, and (4) adjacency effects around clouds (von Hoyningen-Huene et al., 2011). De-spite these rigorous cloud-masking schemes, clouds could still remain one of the most serious factors in the uncertainty of aerosol retrieval. In order to reduce the
remain-20
ing impact due to cloud contamination, we have applied an additional cloud filtering method for cases where the averaged AOT exhibits high standard deviation.
3.1 Validation of BAER AOTs
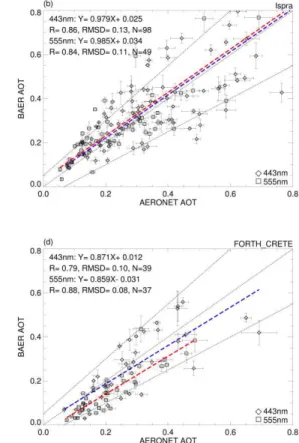
In Fig. 3a–d, AOTs retrieved using BAER were validated with AERONET AOTs at 443 (diamond symbol) and 555 nm (square symbol) over stations in Lille, Ispra, Venice, and
ACPD
11, 20757–20792, 2011Analysis of linear long-term trend of
AOT derived from SeaWiFS using BAER
J. Yoon et al.
Title Page
Abstract Introduction
Conclusions References
Tables Figures
◭ ◮
◭ ◮
Back Close
Full Screen / Esc
Printer-friendly Version
Interactive Discussion
Discussion
P
a
per
|
Dis
cussion
P
a
per
|
Discussion
P
a
per
|
Discussio
n
P
a
per
|
Crete for the observation period available, as shown in Table 1. The correlation coeffi -cient (R), Relative Root-Mean-Square Difference (RMSD), and linear correlation equa-tion (y=Ax+B) between them generally revealed good agreement (0.79≤R≤0.88, 0.08≤RMSD≤0.13, 0.762≤A≤0.988, and −0.031≤B≤0.067) at all stations. Nev-ertheless, there still were some discrepancies, caused by three main factors: (1)
un-5
screened clouds, (2) incorrect surface reflectance, and (3) inadequate aerosol optical properties assumed in BAER. In this study, the aerosol properties observed during the LACE-98 (Lindenberg Aerosol Characterization Experiment) (Bundke et al., 2002; Ans-mann et al., 2002; von Hoyningen-Huene et al., 2003) have been used to precalculate Look-Up-Tables (LUT) in BAER for the entire research period.
10
3.2 Validation of BAER AOT trends
Even though previous validations indicated that BAER and AERONET AOTs are in good agreement, it remains important to ensure that AOTtrends retrieved using satel-lite observations are highly reliable. This is achieved by undertaking an additional validation of BAER and AERONET AOT trends. First, a simple linear model, which
15
is used to minimize chi-square error statistics, was adopted for the estimation of both trends. However, in order to analyze accurate trends, this simple model needs to be analyzed with respect to AOT variability, which is usually autocorrelated (Weatherhead et al., 1998; Zhao et al., 2008).
LetYtbe the BAER retrieved AOT values. The linear trend model is given by Eq. (1),
20
whereµis a constant term andωis the magnitude of the trend per year (Xt=t/12).
Yt = µ + ω Xt + Nt, t = 1, ..., T. (1) To investigate the effects of the magnitude and autocorrelation of noise on the esti-mated trend, the noiseNtis assumed to be autoregressive of first order like in Eq. (2), whereεt is an independent random variable and φis autocorrelation coefficient with
25
−1< φ <1 (Weatherhead et al., 1998):
ACPD
11, 20757–20792, 2011Analysis of linear long-term trend of
AOT derived from SeaWiFS using BAER
J. Yoon et al.
Title Page
Abstract Introduction
Conclusions References
Tables Figures
◭ ◮
◭ ◮
Back Close
Full Screen / Esc
Printer-friendly Version
Interactive Discussion
Discussion
P
a
per
|
Dis
cussion
P
a
per
|
Discussion
P
a
per
|
Discussio
n
P
a
per
|
The estimated trend ( ˆω) is determined by minimizing the chi-square error statistics, the variance (σN2) of the noise (Nt) is obtained, and also related to the variance (σε2) of the white noise (εt) by the following equation:
σN2 = Var (Nt) = σ 2 ε
1 − φ2. (3)
Finally, the precision or uncertainty of the trend is given by the following equation:
5
σωˆ ≈
σε
(1 − φ) 1
n3/2 =
σN n3/2
s 1 + φ
1 − φ, (4)
wheren=T/12 denotes the number of years. Additionally, we have adopted a common decision rule that the trend is supposed to be real when the significance (ω/σˆ ωˆ
) of the trend is larger than two at a 5 % significance or 95 % confidence level (Tiao et al., 1990).
10
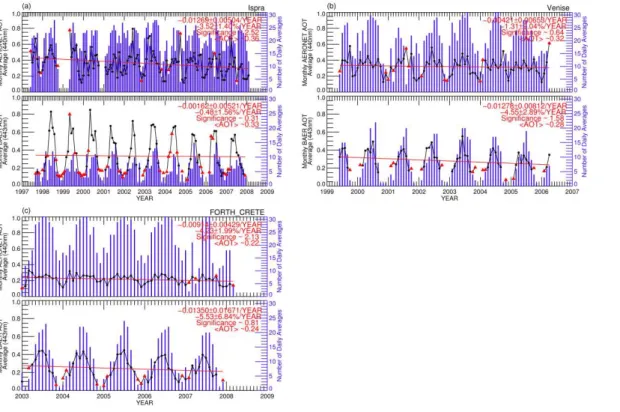
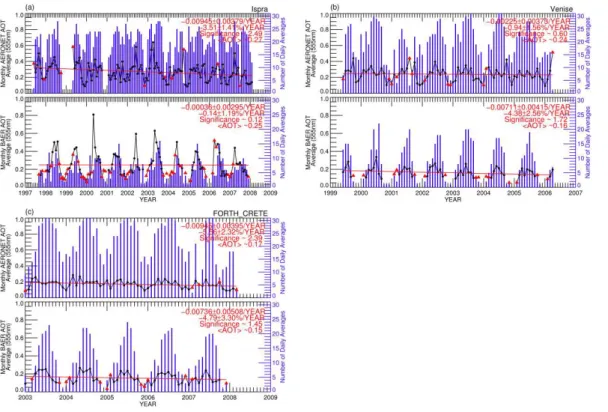
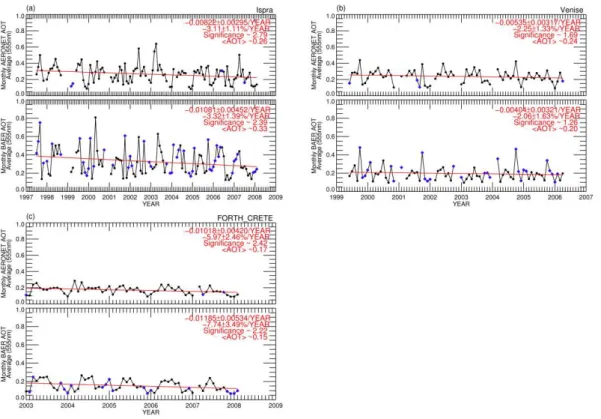
Figures 4 and 5 depict the linear trends of BAER and AERONET monthly AOTs at 443 and 555 nm. Generally, negative trends are similar for both data sets, but their magnitudes are quite different. Especially, the significance values of BAER trends are poor (ω/σˆ ωˆ
≪2), except for the values from Venice ( ω/σˆ ωˆ
=1.58/1.72 at 443/555 nm). One of the most serious factors reducing the significance values as well
15
as the difference of trend magnitudes is cloud disturbance, which leads to reduced observation numbers in the statistics.
The presence of clouds influences AOT retrievals in three ways (Husar et al., 1997; Haywood et al., 2001; Jeong and Li, 2005; Jeong et al., 2005): by (1) thin cloud contamination, (2) misclassification of strong aerosol loading as clouds, and (3) biasing
20
aerosol sampling due to a lack of retrievals in presence of clouds.
ACPD
11, 20757–20792, 2011Analysis of linear long-term trend of
AOT derived from SeaWiFS using BAER
J. Yoon et al.
Title Page
Abstract Introduction
Conclusions References
Tables Figures
◭ ◮
◭ ◮
Back Close
Full Screen / Esc
Printer-friendly Version
Interactive Discussion
Discussion
P
a
per
|
Dis
cussion
P
a
per
|
Discussion
P
a
per
|
Discussio
n
P
a
per
|
retrievals. The second effect leads (on average) to an underestimated AOT due to the removal of pixels dominated by heavy aerosol loading. This underestimation could not easily be quantified in previous validations (Fig. 3) as misclassified aerosols were already removed by cloud masking. In particular, the second effect can induce more serious errors to calculate climatological data (e.g. monthly, seasonal, annual average
5
of global and regional AOTs) and their trends. The third effect generates a random-like error. The uncertainty from the third effect leads to over- or underestimation of the AOT because cloudy days are underrepresented in the database (Remer et al., 1997; Dubovik et al., 2001). Overall, the three superimposed cloud effects can have a complicated influence on the quality of AOT retrievals, as seen in the difference
be-10
tween AERONET and BAER AOT trends (Figs. 4 and 5). For the consideration of the first and second cloud effects, we have introduced a histogram analysis (right axis in Figs. 4 and 5). Based on statistical and visual analysis non-representative monthly AOTs (shown as red triangle symbols in Figs. 4 and 5) were defined as the average of less than five daily AOTs from BAER and ten from AERONET. According to these
15
criteria, Lille station has been excluded from this study because most of the BAER AOT retrievals were non-representative.
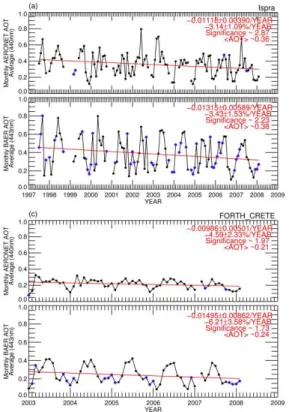
Finally, for a direct comparison between the trends of AERONET and BAER under the same conditions, non-representative monthly AOTs have been inter-corrected from the other dataset (representative values) using the linear correlation equations (blue
20
and red correlation lines shown in Fig. 3). Figures 6 and 7 show both trends based on inter-corrected (blue diamond symbol) and representative monthly AOT (black circle symbol) at 443 and 555 nm including their statistical significance. Negative trends prevailed for all AERONET stations considered. Magnitudes of both trends now agree much better and their statistical significance improved. Most of the inter-corrections
25
were done for data measured in winter time.
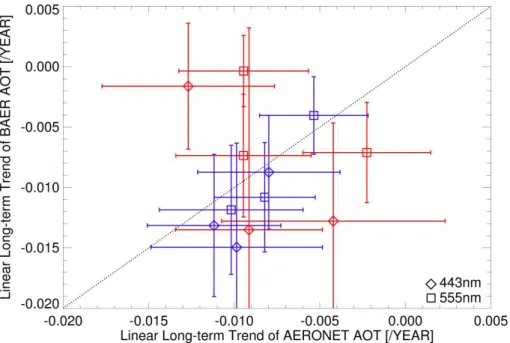
Figure 8 shows linear long-term AOT trends before (red) and after (blue) applying the inter-correction method described above. Clearly, the trends of the BAER AOT and those of AERONET agree within error (average of relative error∼25.19 %) after
ACPD
11, 20757–20792, 2011Analysis of linear long-term trend of
AOT derived from SeaWiFS using BAER
J. Yoon et al.
Title Page
Abstract Introduction
Conclusions References
Tables Figures
◭ ◮
◭ ◮
Back Close
Full Screen / Esc
Printer-friendly Version
Interactive Discussion
Discussion
P
a
per
|
Dis
cussion
P
a
per
|
Discussion
P
a
per
|
Discussio
n
P
a
per
|
application of this method.
4 Linear long-term AOT trends and aerosol characteristics over Europe and South China
Aerosol has variable temporal and regional characteristics because of its different aerosol sources (e.g. aerosol types and emission intensity) and different atmospheric
5
conditions (e.g. relative humidity and boundary layer height). The regions defined in this paper are selected to be affected by human activity. Over European regions (BeNeLux, Po Valley, Eastern Europe, and Eastern Mediterranean), aerosols have a strong seasonal variation because industrial pollution composed of sulphur is en-hanced during summer, when the solar radiation at the surface maximizes (Marmer et
10
al., 2007; Karnieli et al., 2009). Furthermore, forest fires in Southern Europe, occurring mostly in summer, may well contribute to seasonal variation (Pace et al., 2006; Tafuro et al., 2008). Additionally, the absence of removal processes (e.g. rain and monsoon) as well as a high boundary layer height causes higher AOTs in summer over Europe (Gerasopoulos et al., 2003; Bergamo et al., 2008; Venzac et al., 2009).
15
Over the Pearl River Delta in South China, seasonal aerosol trends are mainly influ-enced by typical anthropogenic aerosols, caused by urbanization and industrialization as well as a hygroscopic growth with stagnant synoptic meteorological patterns in sum-mer.
Figure 9 shows the linear long-term trends of BAER retrieved AOTs over the several
20
regions (BeNeLux: −0.00453 (−1.93 %)/−0.00484 (−2.35 %), Po Valley: −0.00386 (−1.22 %)/−0.00440 (1.59 %), Eastern Europe: −0.00055 (−0.24 %)/−0.00019 (−0.10 %), Eastern Mediterranean: −0.00079 (−0.32 %)/−0.00054 (−0.32 %), and Pearl River Delta:+0.00761(+1.24 %)/+0.00625(+1.15 %) per year at 443/555 nm, re-spectively). Except for the case of Pearl River Delta in South China, negative trends
25
ACPD
11, 20757–20792, 2011Analysis of linear long-term trend of
AOT derived from SeaWiFS using BAER
J. Yoon et al.
Title Page
Abstract Introduction
Conclusions References
Tables Figures
◭ ◮
◭ ◮
Back Close
Full Screen / Esc
Printer-friendly Version
Interactive Discussion
Discussion
P
a
per
|
Dis
cussion
P
a
per
|
Discussion
P
a
per
|
Discussio
n
P
a
per
|
climate change and improving air quality (Smith et al., 2001; Streets et al., 2006; Zhao et al., 2008). In comparison, no similarly significant trends could be found over East-ern Mediterranean and EastEast-ern Europe regions, which are affected by various kinds of aerosols (e.g. sea salt, dust, industrial, and biomass burning). On the other hand, rapid urbanization and industrialization in the Pearl River Delta region led to rapidly
5
increasing trend.
As explained earlier, practically all AOT trends based on satellite observations need to be corrected due to cloud uncertainties. However, the inter-correction as applied ignores the difference in spatial resolution of the two data sets. Therefore, we have tried to roughly estimate the cloud uncertainties by a separate analysis of trends for
10
each season (as shown in Fig. 10 and Table 2). Generally speaking, a lot of clouds are observed in winter over Europe and summer over South China. The trends in summer over most of the European regions (BeNeLux, Po Valley, Eastern Mediterranean, and Eastern Europe) were strongly negative, while some positive trends in cloudy seasons were also observed. Realistically, these positive trends are likely to be contaminated
15
by clouds. If the cloud-contaminated months could be excluded, only negative trends over European regions were dominant. Surprisingly, over the Pearl River Delta, a negative trend in summer with highly significant values is opposite to positive trends in other seasons. Clearly, the removal processes of aerosol (e.g. strong monsoon and frequent rain) can influence the decrease of AOT in summer. On the other hand, high
20
relative humidity and meteorological stagnation of the atmosphere in summer could easily lead to misclassification of aerosol and clouds. Therefore, the summer trend of BAER AOT over the Pearl River Delta is actually not real, despite the significance value (ω/σˆ ωˆ
=3.01/2.93 at 443/555 nm, respectively) in summer is larger than two. It should be kept in mind that the annual AOT trend could be influenced strongly by this
25
uncertainty in summer. Detailed values of BAER AOT trends and statistical parameters over the regions are shown in Table 2.
Figure 11 depicts seasonal and annual aerosol optical characteristics (volume size distribution and SSA) from Level 2.0 inversion data at the AERONET stations (red
ACPD
11, 20757–20792, 2011Analysis of linear long-term trend of
AOT derived from SeaWiFS using BAER
J. Yoon et al.
Title Page
Abstract Introduction
Conclusions References
Tables Figures
◭ ◮
◭ ◮
Back Close
Full Screen / Esc
Printer-friendly Version
Interactive Discussion
Discussion
P
a
per
|
Dis
cussion
P
a
per
|
Discussion
P
a
per
|
Discussio
n
P
a
per
|
star and cross symbols) within the regions. The volume size distribution and SSA are quite useful information to understand aerosol particle size and scattering efficiency. The size distributions at most AERONET stations were dominated by accumulation mode with spectral decrease of SSA towards longer wavelengths. They are typical for an industrial aerosol type (Dubovik et al., 2001). The aerosol optical properties over
5
Crete (dominant coarse mode and spectral decrease of SSA by longer wavelengths) revealed that oceanic aerosol and desert dust were predominant. On the other hand, the aerosol properties in Hong Kong, located within the Pearl River Delta, have typical anthropogenic characteristics. Especially interesting is a noticeable increase of mean radius of aerosol fine mode in summer. This circumstance has been explained by
stag-10
nant synoptic meteorological patterns, secondary aerosol formation, and hygroscopic growth (Kotchenruther et al., 1999; Dubovik et al., 2001; Kim et al., 2007). Therefore, the aerosol optical characteristics at Hong Kong support that the main cause of the increase in AOT is industrial aerosol, and that cloud uncertainties have a large impact on the estimation of the summer trend over the Pearl River Delta.
15
5 Summary and conclusion
This study yielded linear long-term trends of AOT retrieved from SeaWiFS observa-tions using BAER for selected regions. Before effectively analyzing the AOT trends retrieved from satellite observations, two validation processes have been performed. First, BAER AOTs have been compared to AERONET AOTs using scattergrams and
20
correlation analysis. This comparison revealed good agreement based on linear cor-relations and RMSDs. However, there were also some discrepancies caused by un-screened clouds, miscalculated surface contribution, and inadequate aerosol optical properties.
In spite of these retrieval uncertainties, after applying an inter-correction method
25
ACPD
11, 20757–20792, 2011Analysis of linear long-term trend of
AOT derived from SeaWiFS using BAER
J. Yoon et al.
Title Page
Abstract Introduction
Conclusions References
Tables Figures
◭ ◮
◭ ◮
Back Close
Full Screen / Esc
Printer-friendly Version
Interactive Discussion
Discussion
P
a
per
|
Dis
cussion
P
a
per
|
Discussion
P
a
per
|
Discussio
n
P
a
per
|
one of the largest uncertainties in AOT trend analysis is caused by cloud disturbances. Accordingly, the cloud induced errors will be larger during cloudy seasons (winter in Europe and summer in South China).
We have investigated seasonal AOT trends in order to identify cloud-contamination. The annual and seasonal trends for the past decade over all European regions
(espe-5
cially, BeNeLux and Po Valley) were most likely negative due to environmental regula-tion. Seasonal aerosol size distribution and SSA at AERONET stations within the Euro-pean regions also supported that industrial aerosol are dominant except for the station on Crete. Excluding cloud-contaminated scenes, our conclusion that aerosol emis-sion has been decreasing over wide areas of Europe is clearly supported. Conversely,
10
the increasing AOT trend in the region of the Pearl River Delta was actually affected by the constant condition of economical development and industrial aerosol emission. The strong negative trend in summer may be explained by increasing aerosol removal processes (e.g. frequent rain and strong monsoon). Furthermore, proceeding from a noticeable hygroscopic growth with high relative humidity and meteorological
stagna-15
tion in summer in Hong Kong (within the Pearl River Delta), it can be concluded that the cloud uncertainties are the most important impact factors in the trend analysis.
The limitation due to cloud contamination can be generalized to other aerosol trend studies using comparable approaches and data. In this respect, the discussion about global brightening and dimming caused by aerosol and measured by space-based
ob-20
servations (Mishchenko et al., 2007; Mishchenko and Geogdzhayev, 2007; Wild et al., 2005, 2007; Ohmura, 2006; Stanhill, 2007; Norris and Wild, 2007; Karnieli et al., 2009; Zhao et al., 2008) need to be extended and reexamined to assess the impact of cloud contamination. Consequently, more continuous cloud-free aerosol measurements uti-lizing space- and ground-based observations are necessary.
25
Acknowledgements. This work was supported in part by the CityZen Project (megaCITY – Zoom for the Environment: EU Framework Programme 7 of European Commission), ACCENT Plus Project (Atmospheric Composition Change: the European Network), and University of Bre-men. The authors would like to thank the NASA ocean colour group and the AERONET team
ACPD
11, 20757–20792, 2011Analysis of linear long-term trend of
AOT derived from SeaWiFS using BAER
J. Yoon et al.
Title Page
Abstract Introduction
Conclusions References
Tables Figures
◭ ◮
◭ ◮
Back Close
Full Screen / Esc
Printer-friendly Version
Interactive Discussion
Discussion
P
a
per
|
Dis
cussion
P
a
per
|
Discussion
P
a
per
|
Discussio
n
P
a
per
|
for providing the SeaWiFS upwelling reflectance and aerosol optical properties data used in the study. I also would like to express my deep and sincere gratitude to my former supervisors, H. K. Cho and J. Kim in Yonsei University, South Korea.
References
Ansmann, A., Wandinger, U., Wiedensohler, A., and Leiterer, U.: Lindenberg Aerosol
Charac-5
terization Experiment 1998 (LACE 98): Overview, J. Geophys. Res., 107(D21), 8129–8140, doi:10.1029/2000JD000233, 2002.
Barnes, R. A., Eplee Jr., R. E., Schmidt, G. M., Patt, F. S., and Mc-Clain, C. R.: Calibration of SeaWiFS, I: Direct techniques, Appl. Optics, 40(36), 6682–6700, doi:10.1364/AO.40.006682, 2001.
10
Bergamo, A., Tafuro, A. M., Kinne, S., De Tomasi, F., and Perrone, M. R.: Monthly-averaged anthropogenic aerosol direct radiative forcing over the Mediterranean based on AERONET aerosol properties, Atmos. Chem. Phys., 8, 6995–7014, doi:10.5194/acp-8-6995-2008, 2008.
Bruegge, C. J., Diner, D. J., Kahn, R. A., Chrien, N., Helmlinger, M. C., Gaitley, B. J., and
15
Abdou, W. A.: The MISR radiometric calibration process, Remote Sens. Environ., 107, 2– 11, doi:10.1016/j.rse.2006.07.024, 2007.
Bundke, U., H ¨anel, G., Horvath, H., Kaller, W., Seidl, S., Wex, H., Wiedensohler, A., Wiegner, M., and Freudenthaler, V.: Aerosol optical properties during the Lindenberg Aerosol Characterization Experiment (LACE 98), J. Geophys. Res., 107(D21), 8123–8137,
20
doi:10.1029/2000JD000188, 2002.
Cracknell, A. P., Newcombe, S. K., Black, A. F., and Kirby, N. E.: The ABDMAP (Algal Bloom Detection, Monitoring and Prediction) Concerted Action, Int. J. Remote Sens., 22, 205–247, 2001.
de Meij, A., Pozzer, A., and Lelieveld, J.: Global and regional trends in aerosol optical depth
25
ACPD
11, 20757–20792, 2011Analysis of linear long-term trend of
AOT derived from SeaWiFS using BAER
J. Yoon et al.
Title Page
Abstract Introduction
Conclusions References
Tables Figures
◭ ◮
◭ ◮
Back Close
Full Screen / Esc
Printer-friendly Version
Interactive Discussion
Discussion
P
a
per
|
Dis
cussion
P
a
per
|
Discussion
P
a
per
|
Discussio
n
P
a
per
|
Di Girolamo, L. and Wilson, M. J.: A first look at banddifferenced angular signa-tures for cloud detection from MISR, IEEE T. Geosci. Remote, 41(7), 1730–1734, doi:10.1109/TGRS.2003.815659, 2003.
Diner, D. J., Abdou, W. A., Ackerman, T. P., Crean, K., Gordon, H. R., Kahn, R. A., Martonchik, J. V., Paradise, S. R., Pinty, B., Verstraete, M. M., Wang, M., and West, R. A.: Multi-angle
5
Imaging SpectroRadiometer Level 2 Aerosol Retrieval Algorithm Theoretical Basis, Revision F. Jet Propulsion Laboratory, JPL D-11400,, California Institute of Technology, 2006.
Dubovik, O. and King, M. D.: A flexible inversion algorithm for retrieval of aerosol optical prop-erties from Sun and sky radiance measurements, J. Geophys. Res., 105, 20673–20696, 2000.
10
Dubovik, O., Smirnov, A., Holben, B. N., King, M. D., Kaufman, Y. J., Eck, T. F., and Slutsker, I.: Accuracy assessment of aerosol optical properties retrieval from AERONET sun and sky radiance measurements, J. Geophys. Res., 105, 9791–9806, 2000.
Dubovik, O., Holben, B. N., Eck, T. F., Smirnov, A., Kaufman, Y. J., King, M. D., Tanr ´e, D., and Slutsker, I.: Variability of absorption and optical properties of key aerosol types observed in
15
worldwide locations, J. Atmos. Sci., 59, 590–608, 2001.
Dubovik, O., Holben, B. N., Lapyonok, T., Sinyuk, A., Mishchenko, M. I., Yang, P., and Slutsker, I.: Non-spherical aerosol retrieval method employing light scattering by spheroids, Geophys. Res. Lett., 10, 1415–1418, doi:10.1029/2001GL014506, 2002.
Dubovik, O., Sinyuk, A., Lapyonok, T., Holben, B. N., Mishchenko, M., Yang, P., Eck, T.
20
F., Volten, H., Munoz, O., Veihelmann, B., van der Zander, W. J., Leon, J.-F., Sorokin, M., and Slutsker, I.: Application of light scattering by spheroids for accounting for par-ticle non-sphericity in remote sensing of desert dust, J. Geophys. Res., 111, D11208, doi:10.1029/2005JD006619, 2006.
Eck, T. F., Holben, B. N., Reid, J. S., Dubovik, O., Smirnov, A., O’Neill, N. T., Slutsker, I.,
25
and Kinne, S.: Wavelength dependence of the optical depth of biomass burning, urban, and desert dust aerosol, J. Geophys. Res., 104, 31333–31350, 1999.
Eplee Jr., R. E., Robinson, W. D., Bailey, S. W., Clark, D. K., Werdell, P. J., Wang, M., Barnes, R. A., and McClain, C. R.: The calibration of SeaWiFS, Part 2: Vicarious techniques, Appl. Optics, 40(36), 6701–6718, doi:10.1364/AO.40.006701, 2001.
30
Gerasopoulos, E., Andreae, M. O., Zerefos, C. S., Andreae, T. W., Balis, D., Formenti, P., Merlet, P., Amiridis, V., and Papastefanou, C.: Climatological aspects of aerosol optical properties in Northern Greece, Atmos. Chem. Phys., 3, 2025–2041, doi:10.5194/acp-3-2025-2003, 2003.
ACPD
11, 20757–20792, 2011Analysis of linear long-term trend of
AOT derived from SeaWiFS using BAER
J. Yoon et al.
Title Page
Abstract Introduction
Conclusions References
Tables Figures
◭ ◮
◭ ◮
Back Close
Full Screen / Esc
Printer-friendly Version
Interactive Discussion
Discussion
P
a
per
|
Dis
cussion
P
a
per
|
Discussion
P
a
per
|
Discussio
n
P
a
per
|
Gordon, H. R.: In-orbit calibration strategy for ocean color sensors, Remote Sens. Environ., 63, 265–278, 1998.
Haywood, J. M., Francis, P. N., Geogdzhayev, I., Mishchenko, M., and Frey, R.: Comparison of Saharan dust aerosol optical depths retrieved using aircraft mounted pyranometers and 2-channel AVHRR algorithms, Geophys. Res. Lett., 28(12), 2393–2396, 2001.
5
Heidinger, A. K., Cao, C., and Sullivan, J.: Using Moderate Resolution Imaging Spectrome-ter (MODIS) to calibrate Advanced Very High Resolution RadiomeSpectrome-ter (AVHRR) reflectance channels, J. Geophys. Res., 107(D23), 4702, doi:10,1029/2001JD002035, 2002.
Heidinger, A. K., Goldberg, M. D., Tarpley, D., Jelenak, A., and Pavolonis, M.: A new AVHRR cloud climatology. Applications with Weather Satellites II, Honolulu, Hawaii, 9–11
Novem-10
ber 2004, Call Number: Reprint #4198, Proceedings SPIE-The International Society for Op-tical Engineering, Bellingham, WA, 197–205, 2004.
Herman, J. R., Bhartia, P. K., Torres, O., Hsu, C., Seftor, C., and Celarier, E.: Global distribution of UV-absorbing aerosols from Nimbus 7/TOMS data, J. Geophys. Res., 102(D14), 16911– 16922, 1997.
15
Higurashi, A. and Nakajima, T.: Development of a two channel aerosol retrieval algorithm on global scale using NOAA AVHRR, J. Atmos. Sci., 56, 924–941, 1999.
Higurashi, A., Nakajima, T., Holben, B. N., Smirnov, A., Frouin, R., and Chatenet, B.: A study of global aerosol optical climatology with two-channel AVHRR remote sensing, J. Climate, 13(12), 2011–2027, doi:10.1175/1520-0442(2000)013<2011:ASOGAO>2.0.CO;2, 2000.
20
Holben, B. N., Eck, T. F., Slutsker, I., Tanr ´e, D., Buis, J. P., Setzer, A., Vermote, E., Reagan, J. A., Kaufman, Y. J., Nakajima, T., Lavenu, F., Jankowiak, I., and Smirnov, A.: AERONET – A federated instrument network and data archive for aerosol characteristics, Remote Sens. Environ., 66, 1–16, 1998.
Holben, B. N., Tanr ´e, D., Smirnov, A., Eck, T. F., Slutsker, I., Abuhassan, N., Newcomb, W.
25
W., Schafer, J. S., Chatenet, B., Lavenu, F., Kaufman, Y. J., Vande Castle, J., Setzer, A., Markham, B., Clark, D., Frouin, R., Halthore, R., Karneli, A., O’Neill, N. T., Pietras, C., Pinker, R. T., Voss, K., and Zibordi, G.: An emerging ground-based aerosol climatology: Aerosol optical depth from AERONET, J. Geophys. Res., 106, 12067–12097, 2001.
Hooker, S. B., Esaias, W. E., Feldman, G. C., Gregg, W. W., and McClain, C. R.: An Overview
30
ACPD
11, 20757–20792, 2011Analysis of linear long-term trend of
AOT derived from SeaWiFS using BAER
J. Yoon et al.
Title Page
Abstract Introduction
Conclusions References
Tables Figures
◭ ◮
◭ ◮
Back Close
Full Screen / Esc
Printer-friendly Version
Interactive Discussion
Discussion
P
a
per
|
Dis
cussion
P
a
per
|
Discussion
P
a
per
|
Discussio
n
P
a
per
|
Husar, R. B., Prospero, J. M., and Stowe, L. L.: Characterization of tropospheric aerosols over the oceans with the NOAA advanced very high resolution radiometer optical thickness operational product, J. Geophys. Res., 102(D14), 16889–16910, 1997.
Ignatov, A. and Stowe, L.: Sensitivity and information content of aerosol retrievals from AVHRR: Radiometric factors, Appl. Optics, 41(6), 991–1011, doi:10.1364/AO.41.000991, 2002.
5
Jeong, M.-J. and Li, Z.: Quality, compatibility, and synergy analyses of global aerosol products of global aerosol products derived from the advanced very high resolution ra-diometer and Total Ozone Mapping Spectrometer, J. Geophys. Res., 110, D10S08, doi:10.1029/2004JD004647, 2005.
Jeong, M.-J., Li, Z., Chu, D. A., and Tsay, S.-T.: Quality and compatibility analyses
10
of global aerosol products derived from the advanced very high resolution radiome-ters and the moderate imaging spectroradiometer, J. Geophys. Res., 110, D10S09, doi:10.1029/2004JD004648, 2005.
Kahn, R. A., Gaitley, B., Martonchik, J., Diner, D., Crean, K., and Holben, B.: MISR global aerosol optical depth validation based on two years of coincident AERONET observations,
15
J. Geophys. Res., 110, D10S04, doi:10.1029/2004JD004706, 2005a.
Kahn, R., Li, W.-H., Martonchik, J., Bruegge, C., Diner, D., Gaitley, B., Abdou, W., Dubovik, O., Holben, B., Smirnov, S., Jin, Z., and Clark, D.: MISR low-light-level calibration, and implications for aerosol retrieval over dark water, J. Atmos. Sci., 62(4), 1032–1062, doi:10.1175/JAS3390.1, 2005b.
20
Kahn, R. A., Gaitley, B. J., Garay, M. J., Diner, D. J., Eck, T. F., Smirnov, A., and Hol-ben, B. N.: Multiangle Imaging SpectroRadiometer global aerosol product assessment by comparison with the Aerosol Robotic Network, J. Geophys. Res., 25(115), D23209, doi:10.1029/2010JD014601, 2010.
Karnieli, A., Derimian, Y., Indoitu, R., Panov, N., Levy, R. C., Remer, L. A., Maenhaut, W.,
25
and Holben, B. N.: Temporal trend in anthropogenic sulfur aerosol transport from central and eastern Europe to Israel, J. Geophys. Res., 114, D00D19, doi:10.1029/2009JD011870, 2009.
Kaufman, Y. J., Tanr ´e, D., Gordon, H. R., Nakajima, T., Lenoble, J., Frouin, R., Grassl, H., Herman, B. M., King, M. D., and Teillet, P. M.: Passive remote sensing of tropospheric aerosol
30
and atmospheric correction for the aerosol effect, J. Geoph. Res., 102, 16815–16830, 1997.
ACPD
11, 20757–20792, 2011Analysis of linear long-term trend of
AOT derived from SeaWiFS using BAER
J. Yoon et al.
Title Page
Abstract Introduction
Conclusions References
Tables Figures
◭ ◮
◭ ◮
Back Close
Full Screen / Esc
Printer-friendly Version
Interactive Discussion
Discussion
P
a
per
|
Dis
cussion
P
a
per
|
Discussion
P
a
per
|
Discussio
n
P
a
per
|
Kim, S.-W., Yoon, S.-C., Kim, J., and Kim, S.-Y.: Seasonal and monthly variations of columnar aerosol optical properties over East Asia determined from multi-year MODIS, LIDAR, and AERONET sun/sky radiometer measurements, Atmos. Environ., 41, 1634–1651, 2007. Kokhanovsky, A. A.: Reflection and transmission of polarized light by optically thick weakly
absorbing random media, J. Opt. Soc. Am., 18, 883–887, 2001.
5
Kotchenruther, R., Hobbs, P. V., and Hegg, D. A.: Humidification factors for atmospheric aerosols offthe mid-Atlantic coast of the United States, J. Geophys. Res., 104, 2239–2251, 1999.
Lee, K. H., Kim, Y. J., and von Hoyningen-Huene, W.: Estimation of aerosol optical thick-ness over northeast Asia from Sea-Viewing Wide Field-of-View Sensor (SeaWiFS) data
10
during the 2001 ACE-Asia intensive observation period, J. Geophys. Res., 109, D19S16, doi:10.1029/2003JD004126, 2004.
Levy, R. C., Remer, L. A., Kleidman, R. G., Mattoo, S., Ichoku, C., Kahn, R., and Eck, T. F.: Global evaluation of the Collection 5 MODIS dark-target aerosol products over land, Atmos. Chem. Phys., 10, 10399–10420, doi:10.5194/acp-10-10399-2010, 2010.
15
Li, Z., Zhao, X., Kahn, R., Mishchenko, M., Remer, L., Lee, K.-H., Wang, M., Laszlo, I., Naka-jima, T., and Maring, H.: Uncertainties in satellite remote sensing of aerosols and impact on monitoring its long-term trend: a review and perspective, Ann. Geophys., 27, 2755–2770, doi:10.5194/angeo-27-2755-2009, 2009.
Marmer, E., Langmann, B., Fagerli, H., and Vestreng, V.: Direct shortwave radiative
forc-20
ing of sulphate aerosol over Europe from 1900 to 2000, J. Geophys. Res., 112, D23S17, doi:10.1029/2006JD008037, 2007.
Martins, J. V., Remer, L., Kaufman, Y. J., Mattoo, S., and Levy, R.: MODIS cloud screening for remote sensing of aerosols over oceans using spatial variability, Geophys. Res. Lett., 29(12), 8009, doi:10.1029/2001GL013252, 2002.
25
Martonchik, J. V., Diner, D. J., Kahn, R. A., Gaitley, B. J., and Holben, B. N.: Comparison of MISR and AERONET aerosol optical depths over desert sites, Geophys. Res. Lett., 31, L16101, doi:10.1029/2004GL019807, 2004.
Massie, T. S., Torres, O., and Smith, S. J.: Total ozone mapping spectrometer (TOMS) obser-vations of increases in Asian aerosol in winter from 1979 to 2000, J. Geophys. Res., 109,
30
D18211, doi:10.1029/2004JD004620, 2004.
ACPD
11, 20757–20792, 2011Analysis of linear long-term trend of
AOT derived from SeaWiFS using BAER
J. Yoon et al.
Title Page
Abstract Introduction
Conclusions References
Tables Figures
◭ ◮
◭ ◮
Back Close
Full Screen / Esc
Printer-friendly Version
Interactive Discussion
Discussion
P
a
per
|
Dis
cussion
P
a
per
|
Discussion
P
a
per
|
Discussio
n
P
a
per
|
Mishchenko, M. I., Geogdzhayev, I. V., Cairns, B., Rossow, W. B., and Lacis, A. A.: Aerosol retrievals over the ocean by use of channels 1 and 2 AVHRR data: sensitivity analysis and preliminary results, Appl. Optics, 38, 7325–7341, 1999.
Mishchenko, M., Geogdzhayev, I. V., Rossow, W. B., Cairns, B., Carlson, B. E., Lacis, A. A., Liu, L., and Travis, L. D.: Long-term satellite record reveals likely recent aerosol trend, Science,
5
315, 1543, 2007.
Norris, J. R. and Wild, M.: Trends in aerosol radiative effects over Europe inferred from ob-served cloud cover, solar “dimming”, and solar “brightening”, J. Geophys. Res., 112, D08214, doi:10.1029/2006JD007794, 2007.
Ohmura, A.: Observed long-term variations of solar irradiance at the Earth’s surface, Space
10
Sci. Rev., 125, 111–128, 2006.
Pace, G., di Sarra, A., Meloni, D., Piacentino, S., and Chamard, P.: Aerosol optical properties at Lampedusa (Central Mediterranean). 1. Influence of transport and identification of different aerosol types, Atmos. Chem. Phys., 6, 697–713, doi:10.5194/acp-6-697-2006, 2006. Remer, L. A., Gasso, S., Hegg, D. A., Kaufman, Y. J., and Holben, B. N.: Urban/industrial
15
aerosol: Ground-based sun/sky radiometer and airborne in situ measurements, J. Geophys. Res., 102, 16849–16859, 1997.
Remer, L. A., Kaufman, Y. J., Tanr ´e, D., Mattoo, S., Chu, D. A., Martins, J. V., Li, R.-R., Ichoku, C., Levy, R. C., Kleidman, R. G., Eck, T. F., Vermote, E., and Holben, B. N.: The MODIS Aerosol Algorithm, Products, and Validation, J. Atmos. Sci., 62, 947–973, 2005.
20
Remer, L. A., Kleidman, R. G., Levy, R. C., Kaufman, Y. J., Tanr ´e, D., Mattoo, S., Martins, J. V., Ichoku, C., Koren, I., Yu, H., and Holben, B. N.: Global aerosol climatology from the MODIS satellite sensors, J. Geophys. Res., 113, D14S07, doi:10.1029/2007JD009661, 2008. Robinson, W. D., Franz, B. A., Patt, F. S., Bailey, S. W., and Werdell, P. J.: Masks and flags
updates, NASA Goddard Space Flight Center, Greenbelt, Maryland, edited by: Hooker,
25
S. B. and Firestone, E. R., SeaWiFS Postlaunch Technical Report Series Vol. 22, NASA Tech. Memo. 2003-206892, 2003.
Rossow, W. B. and Schiffer, R. A.: Advances in understanding clouds from ISCCP, B. Am. Mete-orol. Soc., 80(11), 2261–2287, doi:10.1175/1520-0477(1999)080<2261:AIUCFI>2.0.CO;2, 1999.
30
Sinyuk, A., Dubovik, O., Holben, B. N., Eck, T. F., Breon, F.-M., Martonchik, J., Kahn, R., Diner, D. J., Vermote, E. F., Roger, J.-C., Lapyonok, T., and Slutsker, I.: Simultaneous retrieval of aerosol and surface properties from a combination of AERONET and satellite data, Remote
ACPD
11, 20757–20792, 2011Analysis of linear long-term trend of
AOT derived from SeaWiFS using BAER
J. Yoon et al.
Title Page
Abstract Introduction
Conclusions References
Tables Figures
◭ ◮
◭ ◮
Back Close
Full Screen / Esc
Printer-friendly Version
Interactive Discussion
Discussion
P
a
per
|
Dis
cussion
P
a
per
|
Discussion
P
a
per
|
Discussio
n
P
a
per
|
Sens. Environ., 107, 90–108, 2007.
Smirnov, A., Holben, B. N., Eck, T. F., Dubovik, O., and Slutsker, I.: Cloud screening and quality control algorithms for the AERONET data base, Remote Sens. Environ., 73(3), 337–349, 2000.
Smith, S. J., Pitcher, H., and Wigley, T. M. L.: Global and regional anthropogenic sulfur dioxide
5
emissions, Global Planet. Change, 29, 99–119, 2001.
Stanhill, G.: A perspective on global warming, dimming, and brightening, EOS Trans. Am. Geophys. Union, 88, 58, 2007.
Stowe, L. L., Davis, P. A., and McClain, E. P.: Scientific basis and initial evaluation of the CLAVR-1 global clear/cloud classification algorithm for the Advanced Very High
10
Resolution Radiometer, J. Atmos. Ocean. Tech., 16(6), 656–681, doi:10.1175/1520-0426(1999)016<0656:SBAIEO>2.0.CO;2, 1999.
Streets, D. G., Wu, Y., and Chin, M.: Two-decadal aerosol trends as a likely expla-nation of the global dimming/brightening transition, Geophys. Res. Lett., 33, L15806, doi:10.1029/2006GL026471, 2006.
15
Tafuro, A. M., De Tomasi, F., and Perrone, M. R.: Remote Sensing of Aerosols by Sunphotome-ters and Lidar Techniques, Chapter 14, in: Advanced Environmental Monitoring, edited by: Kim, Y. J., Platt, U., ISBN 978-1-4020-6363-3, XXII, Springer, 179–189, 2008.
Tiao, G. C., Reinsel, G. C., Xu, D., Pedrick, J. H., Zhu, X., Miller, A. J., DeLuisi, J. J., Mateer, C. L., and Wuebbles, D. J.: Effects of autocorrelation and temporal sampling schemes on
20
estimates of trend and spatial correlation, J. Geophys. Res., 95, 20507–20517, 1990. Torres, O., Bhartia, P. K., Herman, J. R., Ahmad, Z., and Gleason, J.: Derivation of aerosol
properties from satellite measurements of backscattered ultraviolet radiation: Theoretical basis, J. Geophys. Res., 103(D14), 17099–17110, 1998.
Torres, O., Bhartia, P. K., Herman, J. R., Sinyuk, A., and Holben, B.: A long term record of
25
aerosol optical thickness from TOMS observations and comparison to AERONET measure-ments, J. Atmos. Sci., 59, 398–413, 2002.
Venzac, H., Sellegri, K., Villani, P., Picard, D., and Laj, P.: Seasonal variation of aerosol size distributions in the free troposphere and residual layer at the puy de Dme station, France, Atmos. Chem. Phys., 9, 1465–1478, doi:10.5194/acp-9-1465-2009, 2009.
30
ACPD
11, 20757–20792, 2011Analysis of linear long-term trend of
AOT derived from SeaWiFS using BAER
J. Yoon et al.
Title Page
Abstract Introduction
Conclusions References
Tables Figures
◭ ◮
◭ ◮
Back Close
Full Screen / Esc
Printer-friendly Version
Interactive Discussion
Discussion
P
a
per
|
Dis
cussion
P
a
per
|
Discussion
P
a
per
|
Discussio
n
P
a
per
|
von Hoyningen-Huene, W., Kokhanovsky, A. A., Burrows, J. P., Bruniquel-Pinel, V., Regner, P., and Baret, F.: Simultaneous Determination of Aerosol- and Surface Characteristics from Top-of-Atmosphere Reflectance using MERIS on board of ENVISAT, J. Adv. Space Res., 37, 2172–2177, 2006.
von Hoyningen-Huene, W., Yoon, J., Vountas, M., Istomina, L. G., Rohen, G., Dinter, T.,
5
Kokhanovsky, A. A., and Burrows, J. P.: Retrieval of spectral aerosol optical thickness over land using ocean color sensors MERIS and SeaWiFS, Atmos. Meas. Tech., 4, 151–171, doi:10.5194/amt-4-151-2011, 2011.
Wang, M. and Shi, W.: Estimation of ocean contribution at the MODIS near-infrared wave-lengths along the east coast of the U.S.: Two case studies, Geophys. Res. Lett., 32, L13606,
10
doi:13610.11029/12005GL022917, 2005.
Weatherhead, E. C., Reinsel, G. C., Tiao, G. C., Meng, X.-L., Choi, D., Cheang, W.-K., Keller, T., DeLuisi, J., Wuebbles, D. J., Kerr, J. B., Miller, A. J., Oltmans, S. J., and Frederick, J. E.: Factors affecting the detection of trends: Statistical considerations and applications to environmental data, J. Geophys. Res., 103, 17149–17161, 1998.
15
WHO – World Health Organization: Air quality guidelines for Europe, No. 23, 1987. WHO – World Health Organization: Air quality guidelines for Europe, No. 91, 2000. WHO – World Health Organization: Air quality guidelines for Europe, 18–20, 2005.
Wild, M., Gilgen, H., Roesch, A., Ohmura, A., Long, C. N., Dutton, E. G., Forgan, B., Kallis, A., Russak, V., and Tsvetkov, A.: From dimming to brightening: Decadal changes in solar
20
radiation at Earth’s surface, Science, 308, doi:10.1126/science.1103215, 847–850, 2005. Wild, M., Ohmura, A., and Makowski, K.: Impact of global dimming and brightening on global
warming, Geophys. Res. Lett., 34, L04702, doi:10.1029/2006GL028031, 2007.
Yu, H., Chin, M., Remer, L. A., Kleidman, R. G., Bellouin, N., Bian, H., and Diehl, T.: Variability of marine aerosol fine-mode fraction and estimates of anthropogenic aerosol component
25
over cloud-free oceans from the Moderate Resolution Imaging Spectroradiometer (MODIS), J. Geophys. Res., 114, D10206, doi:10.1029/2008JD010648, 2009.
Zhang, J. and Reid, J. S.: A decadal regional and global trend analysis of the aerosol optical depth using a data-assimilation grade over-water MODIS and Level 2 MISR aerosol products, Atmos. Chem. Phys., 10, 10949–10963, doi:10.5194/acp-10-10949-2010, 2010.
30
Zhao, T. X.-P., Laszlo, I., Guo, W., Heidinger, A., Cao, C., Jelenak, A., Tarpley, D., and Sullivan, J.: Study of long-term trend in aerosol optical thickness observed from operational AVHRR satellite instrument, J. Geophys. Res., 113, D07201, doi:10.1029/2007JD009061, 2008.
ACPD
11, 20757–20792, 2011Analysis of linear long-term trend of
AOT derived from SeaWiFS using BAER
J. Yoon et al.
Title Page
Abstract Introduction
Conclusions References
Tables Figures
◭ ◮
◭ ◮
Back Close
Full Screen / Esc
Printer-friendly Version
Interactive Discussion
Discussion
P
a
per
|
Dis
cussion
P
a
per
|
Discussion
P
a
per
|
Discussio
n
P
a
per
|
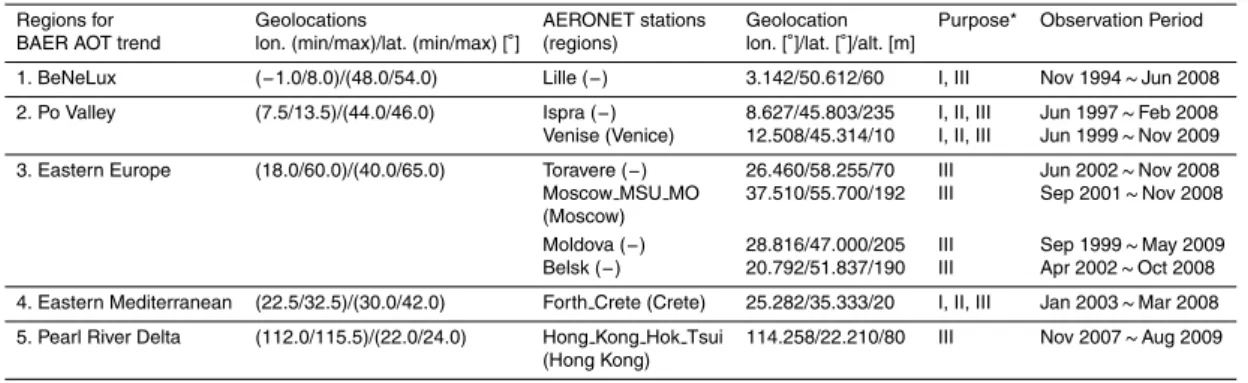
Table 1.Geolocations of several regions for linear long-term trend of BAER AOT and informa-tion summary of AERONET data.
Regions for Geolocations AERONET stations Geolocation Purpose* Observation Period BAER AOT trend lon. (min/max)/lat. (min/max) [◦] (regions) lon. [◦]/lat. [◦]/alt. [m]
1. BeNeLux (−1.0/8.0)/(48.0/54.0) Lille (−) 3.142/50.612/60 I, III Nov 1994∼Jun 2008
2. Po Valley (7.5/13.5)/(44.0/46.0) Ispra (−) 8.627/45.803/235 I, II, III Jun 1997∼Feb 2008 Venise (Venice) 12.508/45.314/10 I, II, III Jun 1999∼Nov 2009
3. Eastern Europe (18.0/60.0)/(40.0/65.0) Toravere (−) 26.460/58.255/70 III Jun 2002∼Nov 2008 Moscow MSU MO 37.510/55.700/192 III Sep 2001∼Nov 2008 (Moscow)
Moldova (−) 28.816/47.000/205 III Sep 1999∼May 2009 Belsk (−) 20.792/51.837/190 III Apr 2002∼Oct 2008
4. Eastern Mediterranean (22.5/32.5)/(30.0/42.0) Forth Crete (Crete) 25.282/35.333/20 I, II, III Jan 2003∼Mar 2008
5. Pearl River Delta (112.0/115.5)/(22.0/24.0) Hong Kong Hok Tsui 114.258/22.210/80 III Nov 2007∼Aug 2009 (Hong Kong)
* The AERONET data were mainly used for three purposes, which are (I) validation of BAER retireved AOTs, (II) validation of BAER AOT trends, and
(III) investigation of climatological aerosol characteristics. For purpose I and II, AERONET Level 2.0 (pre- and post-field calibration applied, cloud-screened,
and quality-assured) all-point and monthly AOTs were employed respectively. For purpose III, Level 2 inversion all-point data (volume size distribution and
ACPD
11, 20757–20792, 2011Analysis of linear long-term trend of
AOT derived from SeaWiFS using BAER
J. Yoon et al.
Title Page
Abstract Introduction
Conclusions References
Tables Figures
◭ ◮
◭ ◮
Back Close
Full Screen / Esc
Printer-friendly Version
Interactive Discussion
Discussion
P
a
per
|
Dis
cussion
P
a
per
|
Discussion
P
a
per
|
Discussio
n
P
a
per
|
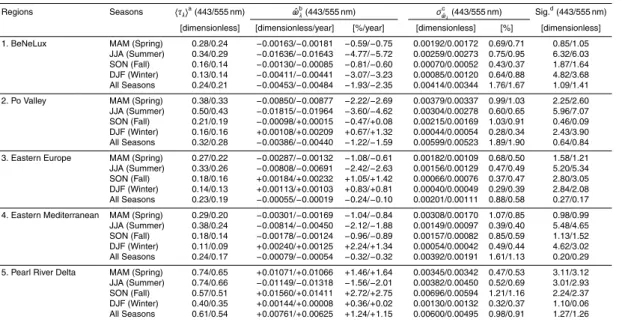
Table 2. Statistical parameters for linear long-term trends of AOTs (443 and 555 nm) retrieved by BAER over several regions.
Regions Seasons hτλia(443/555 nm) ωˆb
λ(443/555 nm) σ
c ˆ
ωλ(443/555 nm) Sig. d
(443/555 nm)
[dimensionless] [dimensionless/year] [%/year] [dimensionless] [%] [dimensionless]
1. BeNeLux MAM (Spring) 0.28/0.24 −0.00163/−0.00181 −0.59/−0.75 0.00192/0.00172 0.69/0.71 0.85/1.05 JJA (Summer) 0.34/0.29 −0.01636/−0.01643 −4.77/−5.72 0.00259/0.00273 0.75/0.95 6.32/6.03 SON (Fall) 0.16/0.14 −0.00130/−0.00085 −0.81/−0.60 0.00070/0.00052 0.43/0.37 1.87/1.64 DJF (Winter) 0.13/0.14 −0.00411/−0.00441 −3.07/−3.23 0.00085/0.00120 0.64/0.88 4.82/3.68 All Seasons 0.24/0.21 −0.00453/−0.00484 −1.93/−2.35 0.00414/0.00344 1.76/1.67 1.09/1.41
2. Po Valley MAM (Spring) 0.38/0.33 −0.00850/−0.00877 −2.22/−2.69 0.00379/0.00337 0.99/1.03 2.25/2.60 JJA (Summer) 0.50/0.43 −0.01815/−0.01964 −3.60/−4.62 0.00304/0.00278 0.60/0.65 5.96/7.07 SON (Fall) 0.21/0.19 −0.00098/+0.00015 −0.47/+0.08 0.00215/0.00169 1.03/0.91 0.46/0.09 DJF (Winter) 0.16/0.16 +0.00108/+0.00209 +0.67/+1.32 0.00044/0.00054 0.28/0.34 2.43/3.90 All Seasons 0.32/0.28 −0.00386/−0.00440 −1.22/−1.59 0.00599/0.00523 1.89/1.90 0.64/0.84
3. Eastern Europe MAM (Spring) 0.27/0.22 −0.00287/−0.00132 −1.08/−0.61 0.00182/0.00109 0.68/0.50 1.58/1.21 JJA (Summer) 0.33/0.26 −0.00808/−0.00691 −2.42/−2.63 0.00156/0.00129 0.47/0.49 5.20/5.34 SON (Fall) 0.18/0.16 +0.00184/+0.00232 +1.05/+1.42 0.00066/0.00076 0.37/0.47 2.80/3.05 DJF (Winter) 0.14/0.13 +0.00113/+0.00103 +0.83/+0.81 0.00040/0.00049 0.29/0.39 2.84/2.08 All Seasons 0.23/0.19 −0.00055/−0.00019 −0.24/−0.10 0.00201/0.00111 0.88/0.58 0.27/0.17
4. Eastern Mediterranean MAM (Spring) 0.29/0.20 −0.00301/−0.00169 −1.04/−0.84 0.00308/0.00170 1.07/0.85 0.98/0.99 JJA (Summer) 0.38/0.24 −0.00814/−0.00450 −2.12/−1.88 0.00149/0.00097 0.39/0.40 5.48/4.65 SON (Fall) 0.18/0.14 −0.00178/−0.00124 −0.96/−0.89 0.00157/0.00082 0.85/0.59 1.13/1.52 DJF (Winter) 0.11/0.09 +0.00240/+0.00125 +2.24/+1.34 0.00054/0.00042 0.49/0.44 4.62/3.02 All Seasons 0.24/0.17 −0.00079/−0.00054 −0.32/−0.32 0.00392/0.00191 1.61/1.13 0.20/0.29
5. Pearl River Delta MAM (Spring) 0.74/0.65 +0.01071/+0.01066 +1.46/+1.64 0.00345/0.00342 0.47/0.53 3.11/3.12 JJA (Summer) 0.74/0.66 −0.01149/−0.01318 −1.56/−2.01 0.00382/0.00450 0.52/0.69 3.01/2.93 SON (Fall) 0.57/0.51 +0.01560/+0.01411 +2.72/+2.75 0.00696/0.00594 1.21/1.16 2.24/2.37 DJF (Winter) 0.40/0.35 +0.00144/+0.00008 +0.36/+0.02 0.00130/0.00132 0.32/0.37 1.10/0.06 All Seasons 0.61/0.54 +0.00761/+0.00625 +1.24/+1.15 0.00600/0.00495 0.98/0.91 1.27/1.26
aAOT average, ˆω
λ;
b
linear long-term trend of AOTs,σωλˆ ; c
standard deviation of the AOT trends, and Sig.; d
significance, ω/σˆ ωˆ
ACPD
11, 20757–20792, 2011Analysis of linear long-term trend of
AOT derived from SeaWiFS using BAER
J. Yoon et al.
Title Page
Abstract Introduction
Conclusions References
Tables Figures
◭ ◮
◭ ◮
Back Close
Full Screen / Esc
Printer-friendly Version
Interactive Discussion
Discussion
P
a
per
|
Dis
cussion
P
a
per
|
Discussion
P
a
per
|
Discussio
n
P
a
per
|