ACPD
5, 287–323, 2005Water activity and activation diameters from hygroscopicity
data – Part I
S. M. Kreidenweis et al.
Title Page
Abstract Introduction
Conclusions References
Tables Figures
◭ ◮
◭ ◮
Back Close
Full Screen / Esc
Print Version
Interactive Discussion
EGU
Atmos. Chem. Phys. Discuss., 5, 287–323, 2005 www.atmos-chem-phys.org/acpd/5/287/
SRef-ID: 1680-7375/acpd/2005-5-287 European Geosciences Union
Atmospheric Chemistry and Physics Discussions
Water activity and activation diameters
from hygroscopicity data – Part I: Theory
and application to inorganic salts
S. M. Kreidenweis1, K. Koehler1, P. DeMott1, A. J. Prenni1, C. Carrico1, and B. Ervens2
1
Department of Atmospheric Science, Colorado State University, Fort Collins, CO, 80523, USA
2
Cooperative Institute for Research in the Atmosphere, Colorado State University, Fort Collins, CO, 80523/NOAA, Boulder, CO, USA
Received: 5 January 2005 – Accepted: 13 January 2005 – Published: 25 January 2005 Correspondence to: K. Koehler (kkoehler@lamar.colostate.edu)
© 2005 Author(s). This work is licensed under a Creative Commons License.
ACPD
5, 287–323, 2005Water activity and activation diameters from hygroscopicity
data – Part I
S. M. Kreidenweis et al.
Title Page
Abstract Introduction
Conclusions References
Tables Figures
◭ ◮
◭ ◮
Back Close
Full Screen / Esc
Print Version
Interactive Discussion
EGU
Abstract
A method is described that uses particle hygroscopicity measurements, made with a humidified tandem differential mobility analyzer (HTDMA), to determine solution water
activity as a function of composition. The use of derived water activity data in com-putations determining the ability of aerosols to serve as cloud condensation nuclei 5
(CCN) is explored. Results for sodium chloride and ammonium sulfate are shown in Part I. In Part II (Koehler et al., to be submitted, 20051), results are reported for sev-eral atmospherically-relevant dicarboxylic acids: malonic acid, glutaric acid and oxalic acid. The methodology yields solution water activities and critical dry diameters for ammonium sulfate and sodium chloride in good agreement with previously published 10
data. The approach avoids the assumptions required for application of simplified and modified K ¨ohler equations to predict CCN activity, most importantly, knowledge of the molecular weight and the degree of dissociation of the soluble species. Predictions of the dependence of water activity on the mass fraction of aerosol species are sensitive to the assumed dry density, but predicted critical dry diameters are not.
15
1. Introduction
The water activity of solutions comprising atmospheric particles is a key parameter describing particles’ equilibrium interactions with water vapor. For example, water ac-tivity data are used to calculate the supersaturation required for particles to activate as cloud condensation nuclei (CCN), and also to compute equilibrium water contents 20
below 100% relative humidity for visibility and direct radiative forcing calculations. The relative efficiency of various species in nucleating cloud droplets can be, and has been,
investigated directly in the laboratory. However, such measurements, typically made
1
ACPD
5, 287–323, 2005Water activity and activation diameters from hygroscopicity
data – Part I
S. M. Kreidenweis et al.
Title Page
Abstract Introduction
Conclusions References
Tables Figures
◭ ◮
◭ ◮
Back Close
Full Screen / Esc
Print Version
Interactive Discussion
EGU
using a thermogradient diffusion chamber, require very stable supersaturations for
re-liable results, which can be difficult to maintain. Further, data from the diffusion
cham-bers do not provide any quantitative information on water uptake below the critical su-persaturation. It is desirable to develop a methodology to provide data on aerosol-water vapor interactions through the full range of relevant atmospheric saturation ratios. 5
In this work, we investigate the use of water uptake data for particles below wa-ter saturation to calculate the wawa-ter activity as a function of solute weight percent, extrapolating to dilute solution concentrations relevant to describing equilibria at super-saturated vapor conditions. Water uptake data for relative humidities below about 95% are typically obtained using the humidified tandem differential mobility analyzer
(HT-10
DMA). The HTDMA measures the water uptake of a nearly monodisperse aerosol at a controlled temperature and relative humidity. The use of HTDMA data for determining solution water activities was proposed by Brechtel and Kreidenweis (2000a, b); here, we adapt their methodology to a different water activity expression. The system used
in this work is described briefly here and in detail in Brechtel and Kreidenweis (2000b). 15
Figure 1 shows the experimental set-up of the HTDMA; the unit is operated in an enclo-sure held at 30◦C. Aerosol is generated using a Constant Output Atomizer (TSI Model
3076), then passed through a heater, diffusion dryer, and dilution chamber to remove
remaining moisture. The dry aerosol is size selected using a Differential Mobility
Ana-lyzer (DMA, TSI Model 3071A). Our results are based on a selected dry size of 100 nm. 20
Part of the size-selected flow is diverted to a condensation particle counter (CPC, TSI Model 3010), which gives a real-time particle concentration. The remaining flow is sent to a humidified loop where the aerosol encounters a controlled, constant relative hu-midity for about 2 s and comes to equilibrium with those conditions. The flow then is sent to a second humidified DMA, which scans through particle sizes, and a second 25
CPC that counts the particles thus giving a size distribution for the humidified particles. The peak of the grown distribution is determined to be the grown size at each relative
ACPD
5, 287–323, 2005Water activity and activation diameters from hygroscopicity
data – Part I
S. M. Kreidenweis et al.
Title Page
Abstract Introduction
Conclusions References
Tables Figures
◭ ◮
◭ ◮
Back Close
Full Screen / Esc
Print Version
Interactive Discussion
EGU
humidity. The growth factor (GF) is defined as
GF(RH)=Dwet(RH)
Ddry , (1)
whereDwetis the grown diameter at the selected relative humidity (RH) andDdryis the
dry size of the particle. From the standard deviations of the DMA flows, which together with the applied voltage control particle sizing, and the uncertainties in RH sensor 5
calibration, the uncertainty in theGF is estimated to be±0.02 at the 95% confidence
level (Carrico et al., 2005). The relative humidity sensors are accurate within±2% for
RHup to 95%.
2. Methodology
2.1. K ¨ohler theory 10
The equilibrium water vapor pressure, pw, over a spherical solution droplet, at a
par-ticular temperatureT, is given by the following expression:
pw
po(T) =s=awexp
4σsolVw RT Dp
!
= RH
100 (2)
In Eq. (2), aw is the water activity of the solution droplet, σsol is the surface tension of the solution, Vw is the partial molar volume of water in solution, R is the universal
15
gas constant, andDp is the droplet size. Water activity, surface tension, and partial molar volume are all functions of composition and temperature. The ratio of the vapor pressure of water over the drop to the saturation vapor pressure of water at that tem-perature,po(T),is known as the saturation ratio,s. The saturation ratio can be equated to the fractional ambient relative humidity,RH/100, if the droplet is in equilibrium with 20
ACPD
5, 287–323, 2005Water activity and activation diameters from hygroscopicity
data – Part I
S. M. Kreidenweis et al.
Title Page
Abstract Introduction
Conclusions References
Tables Figures
◭ ◮
◭ ◮
Back Close
Full Screen / Esc
Print Version
Interactive Discussion
EGU
Equation (2) forms the basis of K ¨ohler theory (K ¨ohler, 1936), which in various forms has been used to theoretically predict the cloud condensation nucleating (CCN) activity of simple and complex aerosols in terms of their critical supersaturations (Giebl, 2002; Kumar et al., 2003; Prenni et al., 2001; Raymond and Pandis, 2002). A plot ofsvs.Dp,
computed for a particular assumed mass of dry solute, generally has a maximum. The 5
saturation ratio at this maximum is the so-called critical saturation, or, more commonly, critical supersaturation, Sc, where S is expressed as a percentage: S=(s−1)×100.
Droplets that have grown past the diameter associated with this critical supersaturation are considered to be stable cloud droplets. A discussion of common assumptions used to further simplify Eq. (2) is provided by Brechtel and Kreidenweis (2000a). A standard 10
assumption is to simplify the calculation of the partial molar volume of water. The partial molar volume of water in solution is given by
Vw =
MWw ρsol
1+100x
ρsol
d ρ
sol
dx , (3)
whereMWw is the molecular weight of water, ρsol is the density of the solution, and
x is the weight percent of solute. For an ideal solution, the partial molar volume of 15
water in solution is equal to the molar volume of pure water,MWw/ρw, also known as
the volume additivity assumption. As discussed in Brechtel and Kreidenweis (2000a), the assumption of volume additivity leads to negligibly small errors in the application of Eq. (1) for common inorganic, ionic species, and will be applied in this work. Using this assumption in Eq. (2) gives
20
s=awexp 4σsolMWw
RT ρwDp !
(4)
We note that some prior works have usedρsol in place of ρw in Eq. (4), which can
lead to erroneously low estimates ofVw, but the resulting error in the Kelvin term at the dilute solution concentrations near the critical supersaturation is generally negligible.
ACPD
5, 287–323, 2005Water activity and activation diameters from hygroscopicity
data – Part I
S. M. Kreidenweis et al.
Title Page
Abstract Introduction
Conclusions References
Tables Figures
◭ ◮
◭ ◮
Back Close
Full Screen / Esc
Print Version
Interactive Discussion
EGU
Further simplifications are directed towards the calculation of the composition-dependent water activity. The water activity may be computed fromaw=γwyw, where
γw is the water activity coefficient in solution, a function of composition, andyw is the
mole fraction of water in solution. It is alternately expressed as
ln(aw)= −νmMWwΦ
1000 , (5)
5
whereΦis the molal osmotic coefficient of the solute in solution,mis solution molality,
andνis the number of ions of solute present in solution (ν>1 if the solute dissociates). Thus,
a−1
w =exp
+νmMW
wΦ
1000
. (6)
In the early cloud physics literature, it was proposed that solution nonidealities be cap-10
tured by the so-called van’t Hoff factor, i (Pruppacher and Klett, 1997), defined by
(McDonald, 1953):
a−1
w =1+i
ns
nw
, (7)
wherens andnw are the number of moles of solute and water in solution, respectively. The van’t Hofffactor can be related to the molal osmotic coefficient as follows. A series
15
expansion of the exponential term in Eq. (6) gives:
a−1
w =1+
νmMW
wΦ
1000
+1
2
νmMW
wΦ
1000
2
+... (8)
Comparing Eq. (8) with Eq. (7), and recognizing that
ns
nw =
mMWw
ACPD
5, 287–323, 2005Water activity and activation diameters from hygroscopicity
data – Part I
S. M. Kreidenweis et al.
Title Page
Abstract Introduction
Conclusions References
Tables Figures
◭ ◮
◭ ◮
Back Close
Full Screen / Esc
Print Version
Interactive Discussion
EGU
it can be seen that the van’t Hofffactor equates to:
i =νΦ + mMWw
1000
(νΦ)2
2 +
mMW
w
1000
2(νΦ)3
6 +... (10)
The van’t Hoff factor is thus a function of composition, particularly for more
concen-trated solutions, although it is often assumed constant for dilute conditions (e.g., Wise et al., 2003). If the series in Eq. (10) is truncated after the first term, then:
5
a−1
w =1+νΦ
ns
nw. (11)
The most frequently-applied form of Eq. (4), derived by K ¨ohler (Pruppacher and Klett, 1997) makes the following assumptions in addition to volume additivity: the droplet containsnw moles of water andns moles of nonvolatile solute; the moles of nonvolatile
solute in solution can be computed from the initial dry particle mass, Ms, molecular 10
weight of solute,MWs, and the number of ions the solute dissociates into,ν; the solu-tion is dilute, the activity coefficient of water can be assumed to be equal to 1; and the
surface tension of the dilute solution can be approximated by that of pure water,σw. If the solution is dilute,Φ≈1, and
aw =
nw
nw+νns, (12)
15
this is the expression for water activity used in simplified K ¨ohler theory. We note this is the same expression that would be obtained using aw=γwyw, and assuming γw
approaches 1 for dilute solutions. Under the assumptions listed above, and applying a parameterization for the change in surface tension of water with temperature, Eq. (2) can be formulated (Seinfeld and Pandis, 1998)
20
lnpw
po
= A
Dp −
B D3p
A= 4MWwσw
RT ρw
∼
= 0.66
T
B= 6nsMw
πρw ∼=
3.44×10¹³νMs
MWs ,
(13)
ACPD
5, 287–323, 2005Water activity and activation diameters from hygroscopicity
data – Part I
S. M. Kreidenweis et al.
Title Page
Abstract Introduction
Conclusions References
Tables Figures
◭ ◮
◭ ◮
Back Close
Full Screen / Esc
Print Version
Interactive Discussion
EGU
where the units ofAandDpare microns (µm), andµm3forB.
If the initial dry particle contains insoluble material, then the number of moles of solute in solution must be computed from only the soluble portion. The necessary modification, which requires knowledge of the soluble mass fraction, is shown in Prup-pacher and Klett (1997). More recently, several authors have discussed additional 5
modifications to K ¨ohler theory to account for other effects that may be important in
atmospheric aerosols. These include mixed particles with a slightly soluble compo-nent (that is, the moles of slightly soluble compocompo-nent in solution depend on the amount of liquid water, which is controlled by more hygroscopic species, and thus the overall solute composition changes withRH) (Shulman et al., 1996); surfactants (Facchini et 10
al., 2000; Shulman et al., 1996), which lower the droplet surface tension; and wetting properties (Raymond and Pandis, 2002).
In addition to the possible inapplicability of the assumptions used to derive Eq. (13) and its modified forms, a major difficulty in applying the theory is that it requires a priori
knowledge of the properties of the initial dry particle: soluble fraction, molecular weight, 15
solute density (to estimate solute mass from the dry diameter), and the parameterν. Nevertheless, for many pure salts, it has been shown to be a good approximation. For pure organic species, it has been argued thatν=1 for compounds that dissociate
very little (Kumar et al., 2003; Prenni et al., 2001; Raymond and Pandis, 2002), but predictions based on this assumption do not always match experimental observations 20
(Kumar et al., 2003; Raymond and Pandis, 2002). Further, although methods to extend the calculation to multiple components have been presented (Raymond and Pandis, 2003), these require values of the solubility limits andνfor each species.
2.2. Use of HTDMA data to determine water activities
In this work, we use Eq. (4) directly to compute the droplet diameter-RH relationship 25
and thus to determineSc, the critical (maximum) equilibrium supersaturation over the
composi-ACPD
5, 287–323, 2005Water activity and activation diameters from hygroscopicity
data – Part I
S. M. Kreidenweis et al.
Title Page
Abstract Introduction
Conclusions References
Tables Figures
◭ ◮
◭ ◮
Back Close
Full Screen / Esc
Print Version
Interactive Discussion
EGU
tion from humidified tandem differential mobility analyzer measurements (Brechtel and
Kreidenweis, 2000b; Prenni et al., 2001; Rader and McMurry, 1986). The HTDMA measures the hygroscopic diameter growth factor, GF, of particles at relative humidi-ties less than 95%, whereGF is defined as the ratio of the diameter in equilibrium with water vapor at the relative humidityRHto the dry diameter, the latter usually measured 5
atRH<5%.
The relationship between growth factors, composition, and water activities can be deduced as follows. Assuming volume additivity, the moles of water associated with a mole of solute at a given relative humidity can be expressed as:
nw
ns
=(GF3−1)MWsρw
MWwρs, (14)
10
whereρs is the density of the solute. By Eq. (11),
nw
ns
=νΦ aw
1−aw
. (15)
Substituting Eq. (14) into Eq. (15):
(GF3−1)=νΦMWwρs MWsρw
aw
1−aw
. (16)
The productνΦ is not constant with composition. We assume variations can be
cap-15
tured by a polynomial inaw, with adjustable parametersa,b, andc, and the molecular weights and densities can be pulled into the constants of that polynomial. The func-tional form thus obtained is:
GF =
1+(a+b·aw+c·a2
w)
aw
1−aw
13
. (17)
It can be shown that Eq. (17) has the property that, as water activity approaches 1, 20
the mass fraction of solute approaches zero. The resulting relationship between wa-ter activity and mole fraction of solute is shown in Eq. (18), where water activity of
ACPD
5, 287–323, 2005Water activity and activation diameters from hygroscopicity
data – Part I
S. M. Kreidenweis et al.
Title Page
Abstract Introduction
Conclusions References
Tables Figures
◭ ◮
◭ ◮
Back Close
Full Screen / Esc
Print Version
Interactive Discussion
EGU
unity corresponds to zero mole fraction of solute anda′,b′and c′are the polynomial
coefficients multiplied byMWsρw/(MWwρs):
ns
ns+nw
= 1−aw
1−aw+a′·aw+b′·a2w+c′·a3w
(18)
Equation (17) is used to model the growth factors from the HTDMA data in terms of the water activity. This is the same functional form used by Dick et al. (2000), Prenni 5
et al. (2001) and Brooks et al. (2004) except they model theGF as a function ofRH. SinceRH, and not water activity, is measured in the HTDMA, an assumption relating
RH to aw is needed. The simplest assumption that can be made is aw=RH. The
solution water activity is equal to the relative humidity at each point if the particles are in equilibrium with the vapor and the Kelvin effect due to curvature of the droplet
10
is negligible. For 100 nm particles and typical growth factors, this implies a surface tension below about 65 dyne cm−1
, for less than 1% error due to the Kelvin effect.
Since the surface tension of many aqueous solutions is closer to that of pure water (∼72 dyne cm−1), neglecting the effects of curvature can result in a few percent error in aw. The data can be corrected for this effect by calculating the Kelvin term,Ke, for the
15
wetted droplet size at each point. The activity of the solution is then:
aw =
RH
K e, (19)
where
K e=exp 4MWwσsol
RT ρwDp
!
. (20)
This correction can be made either by assuming the surface tension is equal to that of 20
pure water (σsol=σw=72 dyne cm−1) or using known concentration-dependent solution
surface tensions.
ACPD
5, 287–323, 2005Water activity and activation diameters from hygroscopicity
data – Part I
S. M. Kreidenweis et al.
Title Page
Abstract Introduction
Conclusions References
Tables Figures
◭ ◮
◭ ◮
Back Close
Full Screen / Esc
Print Version
Interactive Discussion
EGU
Eq. (17). Then a series of values of aw are chosen andGF is computed from the fit.
The masses of solute (Ms) and water (Mw) are then given by:
Ms=D3
dry
π
6 ∗ρs, (21)
Mw=D3
dry
π
6 ∗ρsol ∗(GF)
3 −π
6 ∗ρs
. (22)
The weight percent of solute in the solution,x, corresponding to the water activityaw
5
at whichGF was evaluated, is then simply
Mw Ms
= 100−x
x (23)
However,x must be computed iteratively, because the density of the solution,ρsol, is also a function of composition. Under the assumption of volume additivity:
ρsol =
1
1−100x
ρw + x
100
ρs
. (24)
10
The water activity data as a function ofxthat are obtained by application of this method-ology are then used in Eq. (4) to compute values on the supersaturation-droplet diam-eter curve for any choice of dry diamdiam-eter. The maximum is identified as the critical supersaturation for that dry particle size.
2.3. Sources of uncertainty 15
Application of Eqs. (21) through (24) in the methodology outlined above requires se-lection of a value for the density of the dry solute. This choice determines the value of
xassociated with a particular growth factor. However, sinceGF expresses the ratio of wet to dry particle volume, and not mass, theaw-GF relationship determined from the HTDMA data does not depend on the choice ofρs, and its extrapolation to the dilute
20
ACPD
5, 287–323, 2005Water activity and activation diameters from hygroscopicity
data – Part I
S. M. Kreidenweis et al.
Title Page
Abstract Introduction
Conclusions References
Tables Figures
◭ ◮
◭ ◮
Back Close
Full Screen / Esc
Print Version
Interactive Discussion
EGU
conditions at the critical supersaturation is also independent of the choice of dry den-sity. If self-consistent choices ofρs are used to determine bothaw(x) and to compute
K ¨ohler curves via Eq. (4), the predictedScand wet droplet size are independent of the choice of dry density. This implies that the method could be applied to unknown com-pounds or mixtures, with an arbitrary choice ofρs, to yield satisfactory predictions of
5
the critical supersaturation. However, comparison ofaw(x) for a particular compound obtained from this method withaw(x) for that species obtained by other methods will of course depend on the choice ofρs.
Although the determination of the critical supersaturation is not sensitive to the choice of dry particle density used, it does rely on accurate determination of the dry 10
particle volume. The DMA selects size using an electrical mobility diameter, which assumes a spherical shape. However, many substances, when dried, will have a crys-talline structure. This non-spherical structure leads to a larger drag and a larger elec-trical mobility diameter, and therefore the mobility diameter is larger than the true diam-eter. When the particle takes up water it will preferentially adsorb water at the corners 15
of the non-spherical particle and transform to a nearly spherical shape (Mikhailov et al., 2004). Since the dry size is actually smaller than it appears in the DMA, there is an apparent underestimation of the water uptake. Shape factors are used to correct HTDMA data for the overestimation of dry diameter. The growth factor including the shape factor,χ, whereχ >1 is
20
GF =Dp(RH)
Ddry ∗χ . (25)
Sodium chloride has a cubic structure when dry; application of a shape factor of 1.08 has been shown to be appropriate for this compound (Brechtel and Kreiden-weis, 2000b; Rader and McMurry, 1986). For ammonium sulfate, the dry particles are assumed to be spherical, which has been previously determined to be a good as-25
ACPD
5, 287–323, 2005Water activity and activation diameters from hygroscopicity
data – Part I
S. M. Kreidenweis et al.
Title Page
Abstract Introduction
Conclusions References
Tables Figures
◭ ◮
◭ ◮
Back Close
Full Screen / Esc
Print Version
Interactive Discussion
EGU
assumed. Uncertainty due to this assumption is examined in the sensitivity studies section.
Some species, such as ammonium nitrate, are known to exist in several solid and liquid-like states depending on the temperature, pressure, humidity, and purity (Mikhailov et al., 2004). This chemical restructuring can take place within the HTDMA, 5
giving rise to errors in dry particle size on the order of several nanometers. It has also been shown that some semi-volatile species evaporate in the HTDMA between the selection of the dry size in DMA1 and the measuring at DMA2 (Prenni et al., 2001); the same phenomenon confounds interpretation of water activity data from the electro-dynamic balance (Peng et al., 2001). Although evaporative effects are accounted for
10
experimentally as far as possible, the degree of evaporation may be a function of the relative humidity, resulting in additional uncertainty in the dry particle sizing (Mikhailov et al., 2004).
3. Application to selected ionic species
In this section, we apply the proposed methodology to HTDMA data from our laboratory 15
for ammonium sulfate and sodium chloride particles, and compare the derivedaw(x) relationships with published data and models. We also predict the critical supersatura-tions for both particle types, and compare predicsupersatura-tions with simplified K ¨ohler theory and with published experimental CCN data.
3.1. Ammonium sulfate 20
3.1.1. Water activity
Figure 2 shows HTDMA data for 100 nm dry ammonium sulfate particles. The particles were generated by atomization of a 1 weight percent solution, and dried toRH<5% before sampling and size selection. The indicated uncertainties in GF and RH are
ACPD
5, 287–323, 2005Water activity and activation diameters from hygroscopicity
data – Part I
S. M. Kreidenweis et al.
Title Page
Abstract Introduction
Conclusions References
Tables Figures
◭ ◮
◭ ◮
Back Close
Full Screen / Esc
Print Version
Interactive Discussion
EGU
0.02 and 2%, respectively (Carrico et al., 2005). The curves in Fig. 3 indicate the fit by Eq. (17) for two cases: assuming aw=RH and including the Kelvin correction,
as-suming a constantσsol=72 dyne cm−1. The fits use only data obtained atRH values
above the deliquescence point (RH=79%). Fit coefficients to Eq. (17) are provided
in Table 1; fitting was performed without consideration of experimental uncertainties. 5
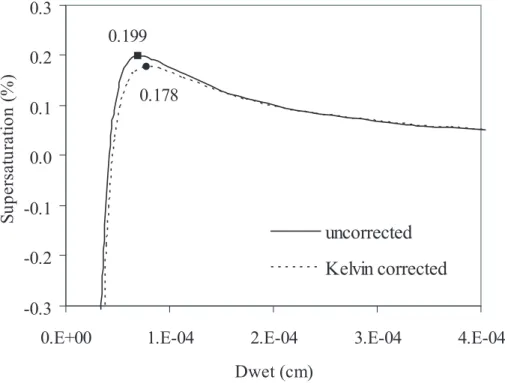
Figure 3 illustrates the predicted relationship, from both fit curves, between drop size and the equilibrium percent supersaturation, S; Sc is indicated by the point defining the maximum of each curve. In the calculations of Sc shown in Fig. 3, the
varia-tion of surface tension with composivaria-tion was ignored, andσsol was again set equal to
σw=72 dyne cm−1.
10
The estimated water activities, expressed as functions of solution weight percent, are shown in Figs. 4a and b, together with estimates from published data or models. The Tang and Munkelwitz (1994) polynomials foraw(x) were based on data from an electro-dynamic balance (EDB), which exposes a supermicron particle to various relative hu-midities and measures the mass increase due to water uptake. Those authors mapped 15
out water contents for the crystallization (hysteresis) branch of the ammonium sulfate curve, whereas our HTDMA experiments always started with dry particles. As with the HTDMA method, it is difficult to control the experimentalRH in the EDB at RH>95%,
so their polynomial fit is less constrained for dilute solutions. Low (1969) used activ-ity and osmotic coefficients reported by Lange (1961) to determine water activity over
20
a range of concentrations, which were reported as values of the van’t Hoff factor as
functions of solution composition. The Wise et al. (2003) relationship is computed from their estimate of a constant van’t Hofffactor, using water activities derived from vapor
pressure measurements for moderately dilute solutions. The AIM model is described by Clegg et al. (1998a) and accessible online at http://mae.ucdavis.edu/wexler/aim. 25
Because of the extensive experimental data and model evaluations it incorporates, in these comparisons we consider the AIM estimates of solution water activities to be the most accurate.
ACPD
5, 287–323, 2005Water activity and activation diameters from hygroscopicity
data – Part I
S. M. Kreidenweis et al.
Title Page
Abstract Introduction
Conclusions References
Tables Figures
◭ ◮
◭ ◮
Back Close
Full Screen / Esc
Print Version
Interactive Discussion
EGU
shown in Figs. 4a and b. The water activity predicted by simplified K ¨ohler theory is significantly different from the other estimates. This is not surprising, becauseν=3 has
been shown to be an overestimation of the dissociation (Gerber et al., 1977; Kumar et al., 2003). The water activities from the Kelvin-corrected case derived from HTDMA data match the predictions from the AIM model and Tang and Munkelwitz (1994) very 5
well, while the estimates from the Wise et al. (2003) model are somewhat lower. In the dilute limit, the activity coefficient of the solute can be expressed by the limiting
Debye-H ¨uckel theory, leading to the following expression for the water activity:
lnaw = 0.509
3
νMWw
1000 m 3
/2−νMWw
1000 m, (26)
wheremis the molality of the solution, moles (kg water)−1. As can be seen in Fig. 4b, 10
all models except the K ¨ohler assumption (Eq.12) vary significantly from the predictions of Eq. (26). However, the solution weight percentages computed for the range ofSc
examined here (0.3%–1.0%) vary from about 0.5% to 3%, well outside the range of applicability of the Debye-H ¨uckel limiting law.
3.1.2. Critical dry diameters 15
In Table 2, we compare predictions of critical supersaturations using the variousaw(x)
relationships, and examine the agreement with experimental observations (Corrigan and Novakov, 1999; Giebl, 2002; Raymond and Pandis, 2002; Kumar et al., 2003). The calculations use Eq. (4) withσsol=σw=72 dynes cm−1, unless indicated otherwise,
and T=298 K. To conform to the typical experimental configurations, we select Sc of
20
0.3%, 0.4%, 0.8% and 1% and compute the dry diameters (“critical dry diameter”) that yield these critical supersaturations. The uncorrected HTDMA data consistently give the largest predicted critical dry diameters, as expected from the water activities shown in Fig. 4. The range in predicted critical dry diameter for each supersaturation is shown in the last row of Table 2. The predictions from the HTDMA method, and the overall 25
ACPD
5, 287–323, 2005Water activity and activation diameters from hygroscopicity
data – Part I
S. M. Kreidenweis et al.
Title Page
Abstract Introduction
Conclusions References
Tables Figures
◭ ◮
◭ ◮
Back Close
Full Screen / Esc
Print Version
Interactive Discussion
EGU
variation produced by the various estimates, are within the experimental uncertainties reported by Raymond and Pandis (2002).
3.2. Sodium chloride
3.2.1. Water activity
The analyses of HTDMA data described above for ammonium sulfate have been re-5
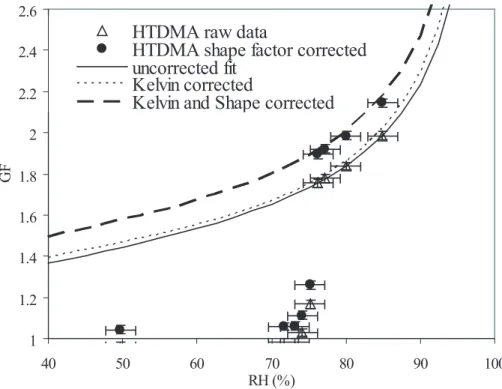
peated for sodium chloride. HTDMA data and fits for this species are shown in Fig. 5 and fitting constants are listed in Table 1. As discussed above, sodium chloride has the added complication that when aerosol is generated and dried it forms a cubic shape which must be corrected for in the size selection by the DMA. The water activity is then modeled in three ways: (1) from uncorrected HTDMA data; (2) from Kelvin-10
corrected HTDMA data; and (3) from Kelvin- and shape factor-corrected HTDMA data. Method (3) is expected to give the most accurate results, since without the shape factor correction, the solute mass is overestimated and the growth factors underestimated.
Figure 6 shows aw(x) computed from the HTDMA data, compared with
relation-ships due to Tang et al. (1997), Low (1969), the AIM model (Clegg et al., 1998b; 15
http://mae.ucdavis.edu/wexler/aim), and simplified K ¨ohler theory withν=2. The
Kelvin-and shape-corrected HTDMA data are in good agreement with the Tang et al. (1997) and AIM-derived relationships over the entire range, while the other methods give sub-stantially different estimates forRH<90%.
3.2.2. Critical dry diameters 20
ACPD
5, 287–323, 2005Water activity and activation diameters from hygroscopicity
data – Part I
S. M. Kreidenweis et al.
Title Page
Abstract Introduction
Conclusions References
Tables Figures
◭ ◮
◭ ◮
Back Close
Full Screen / Esc
Print Version
Interactive Discussion
EGU
determining the solute volume when computing the growth factor, making the particles appear less hygroscopic than they truly are. When the HTDMA data are processed using the shape factor and correcting for the Kelvin effect, the resulting critical dry
di-ameters match reported experimental data, as well as predictions from K ¨ohler theory, very well. As indicated by the close agreement between the water activities seen in 5
Fig. 6, calculations using the AIM and Tang et al. (1997) relationships are very similar to those using water activities derived from HTDMA data corrected for the Kelvin and shape factors. The overall range in predicted critical dry diameter is shown in the last row of the table. The predictions, including those using the least-accurate water activ-ities derived from uncorrected HTDMA data, are within or close to the range of exper-10
imental observations; the spread in predicted diameters at a given supersaturation is generally smaller than the uncertainty ranges reported by Raymond and Pandis (2002) and Corrigan and Novakov (1999).
4. Sensitivity studies
4.1. Sensitivity to shape factor 15
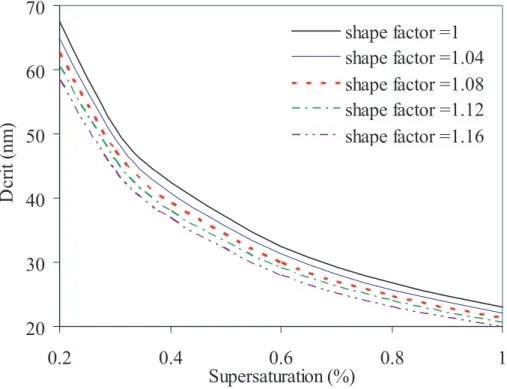
We next examine how unknown shape factors in the HTDMA data ultimately affect the
predicted critical dry diameters. As the shape factor increases, the predicted critical dry diameters for a selected supersaturation will decrease. Figure 7 shows the magnitude of this change for sodium chloride particles, where the correct shape factor is known to be 1.08. As the shape factor used to process the HTDMA data is increased from 1 20
to 1.16, the spread of the critical dry diameters is nearly 7 nm at 0.3% supersaturation but decreases as the supersaturation increases to about 3 nm at 1% supersaturation; both represent about a 14% change. Thus at higher supersaturations, the absolute error due to the shape factor will be quite small, even for shape factors as large as 1.16. From Fig. 7 we may infer that over-prediction of the size of the critical dry di-25
ameter, compared with experimental observations, could be improved if a shape factor
ACPD
5, 287–323, 2005Water activity and activation diameters from hygroscopicity
data – Part I
S. M. Kreidenweis et al.
Title Page
Abstract Introduction
Conclusions References
Tables Figures
◭ ◮
◭ ◮
Back Close
Full Screen / Esc
Print Version
Interactive Discussion
EGU
greater than one were applied to the HTDMA data used to construct the water activity curves. Conversely, if predicted critical dry diameters are not larger than the experi-mental results, we can infer that assuming a shape factor equal to one is an acceptable approximation. This appears to be the case for ammonium sulfate.
Figure 7 can also be used to examine sensitivity of predictions to uncertainty in the 5
HTDMA data. A shape factor of 1.02 is equivalent to a 2% overestimate of diameter ratios. This 2% error in the GF yields errors in the critical dry diameters of 0.5–1.5 nm, or approximately 2%.
4.2. Sensitivity to assumed dry density
As discussed in Sect. 2.3, if the density of small particles is not the same as the bulk 10
density of the substance, or if a species of unknown density is studied, the critical dry diameters can still be predicted with the same accuracy since the method essentially extrapolates the volume ratios to dilute conditions, and not the mass ratios. Thus the K ¨ohler curves will be identical for any assumed dry density. This result suggest that, for ambient aerosols with unknown density, a surrogate density could be assumed and 15
representative K ¨ohler curves obtained by extrapolation of GF data. This hypothesis needs to be evaluated with appropriate experiments.
However, the water activity as a function of solute weight percent,aw(x), derived from
the HTDMA data will be different for different assumed densities, as shown in Fig. 8 for
sodium chloride. Thus, for calculations where water activity must be computed for a 20
specified mass fraction of a species, for example, for mixed particles, knowledge of the correct density is still required to deduceaw(x)relationships applicable to those cases.
4.3. Sensitivity to surface tension
Estimates of critical dry diameters are reported in Tables 2 and 3 for HTDMA data processed using two disparate assumptions: no Kelvin term (essentially, low surface 25
ACPD
5, 287–323, 2005Water activity and activation diameters from hygroscopicity
data – Part I
S. M. Kreidenweis et al.
Title Page
Abstract Introduction
Conclusions References
Tables Figures
◭ ◮
◭ ◮
Back Close
Full Screen / Esc
Print Version
Interactive Discussion
EGU
tension of pure water. The differences in predictions indicated in the Tables provide
some guidance as to how sensitive the calculations are to unknown surface tension in the HTDMA; the critical diameters have all been computed using pure water surface tension in Eq. (4), to remove those variations from the comparisons. According to Pruppacher and Klett (1997), the surface tension of inorganic salt solutions increases 5
linearly with the concentration of the solution, so that the surface tension of the solution droplets measured in the HTDMA are actually larger than those for pure water, yielding an even larger Kelvin correction than that computed forσ=72 dyne cm−1.
HTDMA data for ammonium sulfate were reprocessed, correcting with a Kelvin term computed using the composition-dependent surface tension suggested by Pruppacher 10
and Klett (1997), parameterized as a linear function of molality. The effect of the
in-creased surface tension acts to very modestly decrease the water activity. When the revisedaw(x) is used to compute critical dry diameters, the difference is less than 1 nm
even at 0.3% supersaturation, as shown in Table 2. At 1% supersaturation this dif-ference is only 0.2 nm. For atmospheric aerosols, it is generally expected that mixed 15
particles contain constituents that lower, not raise, the surface tension of the solution as compared with that for pure water. Thus, the two limiting cases for processing HTDMA data that were proposed in Section 2.2 should provide reasonable bounds onaw(x).
5. Parameterization of results
To determine the size of a dry solute particle that would activate at a given supersatu-20
ration, the K ¨ohler equation can be rewritten as:
ln(s)= 4σwMWw
ρwRT Dp −
νMWwρsDdry3
MWsρwDp3 , (27)
whereDdry is the dry particle diameter andDpis the diameter of droplet at equilibrium with saturation ratios. To find the critical saturation ratio, corresponding to dry diameter
ACPD
5, 287–323, 2005Water activity and activation diameters from hygroscopicity
data – Part I
S. M. Kreidenweis et al.
Title Page
Abstract Introduction
Conclusions References
Tables Figures
◭ ◮
◭ ◮
Back Close
Full Screen / Esc
Print Version
Interactive Discussion
EGU Dcri t, the derivative of Eq. (28) is taken with respect toDpand set equal to zero. This
gives:
D2
cri t =
2νρsρwRT Ddry3
4σw . (28)
Combining Eqs. (27) and (28), the dependence of theDcri t on the supersaturation
at the critical point can be derived. RecallingS=(s−1)×100, the solution gives,
5
Dcri t = 256j
3
27k !1/3
×S− 2/
3
cri t =β×S
−2/3
cri t,
j=
σ
wMWw
RT ρw
(29)
k=
νρ
sMWw
MWsρw
.
This yields a straightforward parameterization of critical dry diameters as predicted by simplified K ¨ohler theory.
10
To extend this idea to critical dry diameters computed from Eq. (4), we parameterize Eq. (30) as simply,
Dcri t =α×S
−2/3
cri t, (30)
whereα is a best fit parameter for Dcri t expressed in nm and Scri t in supersaturation
percentage. The fits were performed for the Dcri ts computed from HTDMA-derived 15
water activities, and values ofα andβare listed in Table 1. As the only parameter that is not a constant inβis the number of ions produced after dissociation, a best-fitνcan be deduced from our parameterization,
ν=256
27
σ
w
RT
3MW
w
ρw 2ρ
s
ACPD
5, 287–323, 2005Water activity and activation diameters from hygroscopicity
data – Part I
S. M. Kreidenweis et al.
Title Page
Abstract Introduction
Conclusions References
Tables Figures
◭ ◮
◭ ◮
Back Close
Full Screen / Esc
Print Version
Interactive Discussion
EGU
This effectiveν, or more accuratelyνΦ, is listed in Table 1 for each species and each
model.
6. Summary and conclusions
The methodology of Brechtel and Kreidenweis (2000a), describing the use of HTDMA-derived water uptake data to predict water activity as a function of solute weight per-5
cent, has been adapted to a different GF-aw relationship, and tested for ammonium
sulfate and sodium chloride particles. Results are in reasonably good agreement with previously-published water activity data. Using HTDMA-derived water activities, CCN properties for the two inorganic salts are computed. Predicted critical dry diameters are in good agreement with reported experimental results, as well as with predictions 10
of critical dry diameters using published water activity data.
The approach outlined here does not require knowledge of the solute properties, such as molecular weight and degree of dissociation, that are needed for the applica-tion of standard K ¨ohler theory. It also does not require the dry particle density to predict CCN activity; the solution composition can instead be expressed in terms of volume 15
fractions of water and dry material. However, the dry density is required to accurately express water activity as a function of dry aerosol weight percent. We show that the method is also sensitive to the assumed dry particle shape factor. Nevertheless, even for sodium chloride, the inaccuracies introduced by assuming spherical particles lead to predicted critical dry diameters within, or close to, the range associated with the di-20
rect determination of critical dry diameters using CCN counters. In Part II, we explore the effect of this uncertainty range in water activity, and thus in critical dry diameter, on
the predicted droplet number concentrations in an adiabatic updraft.
One clear disadvantage of this method is that some slightly-soluble species, e.g., adipic acid, do not take up water appreciably below 95% relative humidity, the upper 25
limit in HTDMA experiments (Prenni et al., 2001), and thus their water and CCN ac-tivities cannot be modeled using this approach. Similarly, for mixed particles, if one
ACPD
5, 287–323, 2005Water activity and activation diameters from hygroscopicity
data – Part I
S. M. Kreidenweis et al.
Title Page
Abstract Introduction
Conclusions References
Tables Figures
◭ ◮
◭ ◮
Back Close
Full Screen / Esc
Print Version
Interactive Discussion
EGU
component is only slightly soluble and does not go into solution forRH<95%, its con-tributions to water activity will not be captured in the HTDMA data. In Part II (Koehler et al., to be submitted, 20051), we test this methodology for particles composed of se-lected organic species, whose water uptake and CCN activities have been previously reported. Further testing of the methodology for pure and mixed particles, including 5
real atmospheric aerosols with unknown compositions, is clearly needed.
Acknowledgements. This work was supported in part by the NOAA Office of Global Programs
and by the National Science Foundation under grant NSF-ATM-0071321. K. Koehler gratefully acknowledges support from a NASA Global Change Fellowship. We thank S. Clegg for useful discussions.
10
References
Brechtel, F. J. and Kreidenweis, S. M.: Predicting particle critical supersaturation from hygro-scopic growth measurements in the humidified TDMA, part I: Theory and sensitivity studies, J. Atmos. Sci., 57(12), 1854–1871, 2000a.
Brechtel, F. J. and Kreidenweis, S. M.: Predicting particle critical supersaturation from
hy-15
groscopic growth measurements in the humidified TDMA, Part II: Laboratory and ambient studies, J. Atmos. Sci., 57(12), 1872–1887, 2000b.
Brooks, S. D., DeMott, P. J., and Kreidenweis, S. M.: Water uptake by particles containing humic materials and mixtures of humic materials with ammonium sulfate, Atmos. Environ., 38(13), 1859–1868, 2004.
20
Carrico, C. M., Kreidenweis, S. M., Malm, W. C., Day, D. E., Lee, T., Carrillo, J., McMeeking, G. R., and Collett, J. L.: Hygroscopic growth behavior of a carbon-dominated aerosol in Yosemite National Park, Atmos. Environ., in press, 2005.
Clegg, S. L., Brimblecombe, P., and Wexler, A. S.: A thermodynamic model of the system H-NH4-SO4-NO3-H2O at tropospheric temperatures, J. Phys. Chem., 102A, 2137–2154,
25
1998a.
ACPD
5, 287–323, 2005Water activity and activation diameters from hygroscopicity
data – Part I
S. M. Kreidenweis et al.
Title Page
Abstract Introduction
Conclusions References
Tables Figures
◭ ◮
◭ ◮
Back Close
Full Screen / Esc
Print Version
Interactive Discussion
EGU Corrigan, C. E. and Novakov, T.: Cloud condensation nucleus activity of organic compounds: a
laboratory study, Atmos. Environ., 33(17), 2661–2668, 1999.
Dick, W. D., Saxena, P., and McMurry, P. H.: Estimation of water uptake by organic compounds in submicron aerosols measured during the Southeastern Aerosol and Visibility Study, J. Geophys. Res.-A, 105(D1), 1471–1479, 2000.
5
Facchini, M. C., Decesari, S., Mircea, M., Fuzzi, S., and Loglio, G.: Surface tension of atmo-spheric wet aerosol and cloud/fog droplets in relation to their organic carbon content and chemical composition, Atmos. Environ., 34(28), 4853–4857, 2000.
Gerber, H. E., Hoppel, W. A., and Wojciechowski, T. A.: Experimental-Verification of Theoretical Relationship between Size and Critical Supersaturation of Salt Nuclei, J. Atmos. Sci., 34(11),
10
1836–1841, 1977.
Giebl, H., Berner, A., Reischl, G., Puxbaum, H., Kasper-Giebl, A., and Hitzenberger, R.: CCN activation of oxalic and malonic acid test aerosols with the University of Vienna cloud con-densation nucleus counter, J. Aerosol Sci., 33, 1623–1634, 2002.
K ¨ohler, H.: The nucleus in and the growth of hygroscopic droplets, Trans. Faraday Soc., 32,
15
1152–1161, 1936.
Kumar, P. P., Broekhuizen, K., and Abbatt, J. P. D.: Organic acids as cloud condensation nuclei: Laboratory studies of highly soluble and insoluble species, Atmos. Chem. Phys., 3, 509–520, 2003,
SRef-ID: 1680-7324/acp/2003-3-509.
20
Lange, N. A.: Handbook of chemistry, McGraw Hill, New York, 1969, 1961.
Low, R. D.: A theoretical study of nineteen condensation nuclei, J. de Rech. Atmos., 4, 65–78, 1969.
McDonald, J. E.: Erroneous Cloud-Physics Applications of Raoult Law, J. Meteorol., 10(1), 68–70, 1953.
25
Mikhailov, E., Vlasenko, S., Niessner, R., and P ¨oschl, U.: Interaction of aerosol particles com-posed of protein and salts with water vapor: hygroscopic growth and microstructural rear-rangement, Atmos. Chem. Phys., 4, 323–350, 2004,
SRef-ID: 1680-7324/acp/2004-4-323.
Peng, C., Chan, M. N., and Chan, C. K.: The hygroscopic properties of dicarboxylic and
mul-30
tifunctional acids: Measurements and UNIFAC predictions, Environ. Sci. Technol., 35(22), 4495–4501, 2001.
Pitzer, K. S.: Ion interaction approach: Theory and data correlation, in: Activity coefficients in
ACPD
5, 287–323, 2005Water activity and activation diameters from hygroscopicity
data – Part I
S. M. Kreidenweis et al.
Title Page
Abstract Introduction
Conclusions References
Tables Figures
◭ ◮
◭ ◮
Back Close
Full Screen / Esc
Print Version
Interactive Discussion
EGU electrolyte solutions, edited by: Pitzer, K. S., Boca Raton, CRC Press, 1991.
Prenni, A. J., Demott, P. J., Kreidenweis, S. M., Sherman, E. E., et al.: The effects of low molecular weight dicarboxylic acids on cloud formation, J. Phys. Chem. A, 105(50), 11 240– 11 248, 2001.
Pruppacher, H. R. and Klett, J. D.: Microphysics of Clouds and Precipitation, Kluwer Academic
5
Publishers, Dordrecht, 954, 1997.
Rader, D. J. and McMurry, P. H.: Application of the Tandem Differential Mobility Analyzer to Studies of Droplet Growth or Evaporation, J. Aerosol Sci., 17(5), 771–787, 1986.
Raymond, T. M. and Pandis, S. N.: Cloud activation of single-component organic aerosol parti-cles, J. Geophys. Res.-A, 107(D24), 4787–4794, 2002.
10
Raymond, T. M. and Pandis, S. N.: Formation of cloud droplets by multicomponent organic particles, J. Geophys. Res.-A, 108(D15), 4469–4476, 2003.
Seinfeld, J. H. and Pandis, S. N.: Atmospheric Chemistry and Physics: From air pollution to climate change, John Wiley & Sons, Inc., New York, 1326, 1998.
Shulman, M. L., Jacobson, M. C., Carlson, R. J., Synovec, R. E., and Young, T. E.: Dissolution
15
behavior and surface tension effects of organic compounds in nucleating cloud droplets, Geophys. Res. Lett., 23(3), 277-280, 1996.
Tang, I. N. and Munkelwitz, H. R.: Water activities, densities, and refractive indices of aqueous sulfates and sodium nitrate droplets of atmospheric importance, J. Geophys. Res.-A, 99(D9), 18 801–18 808, 1994.
20
Tang, I. N., Tridico, A. C., and Fung, K. H.: Thermodynamic and optical properties of sea salt aerosols, J. Geophys. Res.-A, 102(D19), 23 269–23 275, 1997.
ACPD
5, 287–323, 2005Water activity and activation diameters from hygroscopicity
data – Part I
S. M. Kreidenweis et al.
Title Page
Abstract Introduction
Conclusions References
Tables Figures
◭ ◮
◭ ◮
Back Close
Full Screen / Esc
Print Version
Interactive Discussion
EGU Table 1.Fitting constants forGF-aw relationship, parameterization constants for CCN activity,
and deducedνs for ammonium sulfate and sodium chloride. See text for full explanation.
Species and Model a b c α β ν
Ammonium sulfate; uncorrected 1.71845 −2.04960 0.69443 34.0425 26.1487 1.36 Ammonium sulfate; Kelvin corrected 2.42848 −3.85261 1.88159 31.4475 “ 1.72 Sodium chloride; uncorrected 3.89243 −4.49667 1.62110 24.2239 21.3277 1.37 Sodium chloride; Kelvin corrected 4.83257 −6.92329 3.27805 23.0149 “ 1.59 Sodium chloride; Kelvin and shape corrected 6.79172 −9.88139 4.57915 21.4737 “ 1.96
ACPD
5, 287–323, 2005Water activity and activation diameters from hygroscopicity
data – Part I
S. M. Kreidenweis et al.
Title Page
Abstract Introduction
Conclusions References
Tables Figures
◭ ◮
◭ ◮
Back Close
Full Screen / Esc
Print Version
Interactive Discussion
EGU Table 2.Comparison of various predicted critical dry diameters and available observations for
ammonium sulfate.
Critical Diameter Critical Diameter Critical Diameter Critical Diameter Reference/Notes
(nm) (nm) (nm) (nm)
Sc=0.3% Sc=0.4% Sc=0.8% Sc=1%
Raymond and Pandis (2002), 66±13 26±4 Raymond and Pandis (2002) experimental observation
Corrigan and Novakov (1999), 51±8 30±5 Corrigan and Novakov (1999) experimental observation
Giebl et al. (2002), 52.5 29.1 Giebl et al. (2002) experimental observation (Sc=0.42%) (Sc=1.08%)
Kumar et al. (2003), 67±10 59±9 Kumar et al. (2003) experimental observation
This work, fit uncorrected 75.9 62.6 39.3 33.8 for Kelvin effects (76.7)a (60.6)b (32.1)b This work, fit corrected 70.5 58.1 36.5 31.4 for Kelvin effects (71.2)a (56.2)b (29.9)b
This work, fit corrected for 69.7 57.5 36.3 31.2 Surface tension estimated Kelvin and surface tension effects from Pruppacher and Klett (1997) Standard K¨ohler Theory, 59.3 49.0 30.9 26.6 Water activity
Eq. (4) from Eq. (12)
Raymond and Pandis (2002), 61 27 Raymond and Pandis (2002) theoretical calculation
aParenthetical values are computed at S
c=0.295%, for comparison with Brechtel and Kreidenweis (2000a). bParenthetical values are computed at S
ACPD
5, 287–323, 2005Water activity and activation diameters from hygroscopicity
data – Part I
S. M. Kreidenweis et al.
Title Page
Abstract Introduction
Conclusions References
Tables Figures
◭ ◮
◭ ◮
Back Close
Full Screen / Esc
Print Version
Interactive Discussion
EGU Table 2.Continued.
Critical Diameter Critical Diameter Critical Diameter Critical Diameter Reference/Notes
(nm) (nm) (nm) (nm)
Sc=0.3% Sc=0.4% Sc=0.8% Sc=1%
Corrigan and Novakov (1999), 50 31 Corrigan and Novakov (1999) predicted by K¨ohler Theory
Brechtel and Kreidenweis (2000a), 70 Brechtel and Kreidenweis (2000a) theoretical calculation (Sc=0.295%)
Kumar et al. (2002), 59.4 49.0 Kumar et al. (2002) standard K¨ohler theory
Kumar et al. (2002), using 63.2 52.6 Kumar et al. (2002) Clegg et al. (1996) water activity
awfrom Tang and Munkelwitz (1994) 68.2 56.4 35.7 30.8 Tang and Munkelwitz (1994)
σsol=constant=72 dyne/cm
awfrom AIM model; 62.9 52.3 33.5 29.1 Clegg et al. (1998a)
σsol=constant=72 dyne/cm
awfrom Debye-Huckel limiting law; 59.9 49.5 31.4 27.1
σsol=constant=72 dyne/cm
awfrom Wise et al. (2004); 64.7 53.4 33.7 29.0 Wise et al. (2004)
σsol=constant=72 dyne/cm
Range in predicted 75.9–59.3 62.6–49 39.3–31 33.8–27 critical dry diameters 68±8 56±7 35±4 30±3
aParenthetical values are computed at S
c=0.295%, for comparison with Brechtel and Kreidenweis (2000a). bParenthetical values are computed at S
c=0.42% or 1.08%, for comparison with Giebl et al. (2002).
ACPD
5, 287–323, 2005Water activity and activation diameters from hygroscopicity
data – Part I
S. M. Kreidenweis et al.
Title Page
Abstract Introduction
Conclusions References
Tables Figures
◭ ◮
◭ ◮
Back Close
Full Screen / Esc
Print Version
Interactive Discussion
EGU Table 3.Comparison of various predicted critical dry diameters and available observations for
sodium chloridea.
Critical Diameter Critical Diameter Critical Diameter Critical Diameter Reference/Notes
(nm) (nm) (nm) (nm)
Sc=0.3% Sc=0.4% Sc=0.8% Sc=1%
Raymond and Pandis (2002), 48±1 19±3 Raymond and Pandis (2002) experimental observation
Corrigan and Novakov (1999), 40±6 Corrigan and Novakov (1999) experimental observation
Giebl et al. (2002), 71.4 34.0 Giebl et al. (2002) experimental observation (Sc=0.22%) (Sc=0.58%)
This work, fit 54.2 44.6 28.1 24.2 uncorrected for Kelvin effects (66.7) (34.7)
This work, fit 51.4 42.4 26.7 23.0 corrected for Kelvin effects (63.2) (33.1)
This work, fit corrected 47.7 39.4 24.8 21.3 Shape factor=1.08 for Kelvin and shape effects (58.6) (30.7)
Standard K¨ohler Theory, 48.4 40.0 25.2 21.7 Water activity
Eq. (4) from Eq. (12)
Raymond and Pandis (2002), 51 23 Raymond and Pandis (2002) theoretical calculation
Corrigan and Novakov (1999), 41 26 Corrigan and Novakov (1999) predicted by K¨ohler Theory
Brechtel and Kreidenweis (2000), 70 40 Brechtel and Kreidenweis (2000) theoretical calculation (Sc=0.20%) (Sc=0.47%)
a
ACPD
5, 287–323, 2005Water activity and activation diameters from hygroscopicity
data – Part I
S. M. Kreidenweis et al.
Title Page
Abstract Introduction
Conclusions References
Tables Figures
◭ ◮
◭ ◮
Back Close
Full Screen / Esc
Print Version
Interactive Discussion
EGU Table 3.Continued.
Critical Diameter Critical Diameter Critical Diameter Critical Diameter Reference/Notes
(nm) (nm) (nm) (nm)
Sc=0.3% Sc=0.4% Sc=0.8% Sc=1%
awfrom Tang et al. (1997); 47.9 39.6 25.0 21.6 Activity and density
σsol=constant=72 dyne/cm from Tang et al. (1997)
awfrom AIM model; 49.3 40.8 25.8 22.3 Clegg et al. (1998b)
σsol=constant=72 dyne/cm
awfrom Debye-Huckel limiting law; 49.0 40.5 25.7 22.2
σsol=constant=72 dyne/cm
Range in predicted 54.2–47.7 44.6–39.4 28.1–24.8 24.2–21.3 critical dry diameters 51±3 42±3 27±2 23±1
aParenthetical values are computed at S
ccorresponding to those reported by Giebl et al. (2002).
ACPD
5, 287–323, 2005Water activity and activation diameters from hygroscopicity
data – Part I
S. M. Kreidenweis et al.
Title Page Abstract Introduction Conclusions References Tables Figures ◭ ◮ ◭ ◮ Back Close
Full Screen / Esc
Print Version
Interactive Discussion
EGU
Maintained at 30oC
Dry Sheath Air
DMA 2
DMA 1
Humidified Sheath Air Excess Air Excess Air
CPC 2 CPC 1
Perma Pure Tubing Wet Near-Monodisperse Aerosol RHS Humidified Sheath Air RHS Dif fu s io n Drier TSI Atomizer Dry Filtered Air Filter Filter Open to room
Dry Polydisperse
Aerosol
Maintained at 30oC
Dry Sheath Air
DMA 2
DMA 1
Humidified Sheath Air Excess Air Excess Air
CPC 2 CPC 1
Perma Pure Tubing Wet Near-Monodisperse Aerosol RHS Humidified Sheath Air RHS Heater Dif fu s io n Drier TSI Atomizer Dry Filtered Air Filter Filter Open to room
Dry Polydisperse Aerosol Dilution Ch amb e r Maintained at 30oC
Dry Sheath Air
DMA 2
DMA 1
Humidified Sheath Air Excess Air Excess Air
CPC 2 CPC 1
Perma Pure Tubing Wet Near-Monodisperse Aerosol RHS Humidified Sheath Air RHS Dif fu s io n Drier TSI Atomizer Dry Filtered Air Filter Filter Open to room
Dry Polydisperse
Aerosol
Maintained at 30oC
Dry Sheath Air
DMA 2
DMA 1
Humidified Sheath Air Excess Air Excess Air
CPC 2 CPC 1
Perma Pure Tubing Wet Near-Monodisperse Aerosol RHS Humidified Sheath Air RHS Heater Dif fu s io n Drier TSI Atomizer Dry Filtered Air Filter Filter Open to room
Dry Polydisperse Aerosol Dilution Ch amb e r
Fig. 1. Schematic of the Humidified Tandem Differential Mobility Analyzer (from Prenni et al.,
ACPD
5, 287–323, 2005Water activity and activation diameters from hygroscopicity
data – Part I
S. M. Kreidenweis et al.
Title Page
Abstract Introduction
Conclusions References
Tables Figures
◭ ◮
◭ ◮
Back Close
Full Screen / Esc
Print Version
Interactive Discussion
EGU
1
1.2
1.4
1.6
1.8
2
40
50
60
70
80
90
100
RH (%)
GF
HTDMA
aw=RH
aw=RH/Ke
Fig. 2. HTDMA data for 100 nm ammonium sulfate particles. Curves are the fit to the data using the uncorrected data (aw=RH) and removing the Kelvin effect (aw=RH/Ke).
ACPD
5, 287–323, 2005Water activity and activation diameters from hygroscopicity
data – Part I
S. M. Kreidenweis et al.
Title Page
Abstract Introduction
Conclusions References
Tables Figures
◭ ◮
◭ ◮
Back Close
Full Screen / Esc
Print Version
Interactive Discussion
EGU
0.178
0.199
-0.3
-0.2
-0.1
0.0
0.1
0.2
0.3
0.E+00
1.E-04
2.E-04
3.E-04
4.E-04
Dwet (cm)
S
u
p
e
rs
a
tu
ra
ti
on
(%
)
uncorrected
Kelvin corrected
ACPD
5, 287–323, 2005Water activity and activation diameters from hygroscopicity
data – Part I
S. M. Kreidenweis et al.
Title Page
Abstract Introduction
Conclusions References
Tables Figures
◭ ◮
◭ ◮
Back Close
Full Screen / Esc
Print Version
Interactive Discussion
EGU
0.8 0.84 0.88 0.92 0.96 1
0 5 10 15 20 25 30 35 40
x, weight percent solute (%)
water activity
AIM Debye-Huckel Kohler Wise et al. (2003) Tang and Munkelwitz (1994) Low (1969)
Uncorrected Kelvin-corrected
(a)
0.99 0.992 0.994 0.996 0.998 1
0.0 0.5 1.0 1.5 2.0 2.5 3.0
x, weight percent solute (%)
water activity
AIM Debye-Huckel Kohler Wise et al. (2003) Tang and Munkelwitz (1994) Low (1969)
Uncorrected Kelvin-corrected
(b)
Fig. 4. (a)Water activity as a function of ammonium sulfate weight percent. Corrected and Kelvin corrected: this study. Other relationships shown are from Tang and Munkelwitz (1994); Wise et al. (2003); the AIM Model (Clegg et al., 1998a); Low et al. (1969). K ¨ohler: Eq. (12) with
ν=3 assumed; and the Debye-H ¨uckel limiting law (Eq.26). (b)Water activity as a function of ammonium sulfate weight percent in the dilute limit.