*Correspondence: R. O. Castilho. Departamento de Produtos Farmacêuticos, Faculdade de Farmácia, Universidade Federal de Minas Gerais. Av. Presidente Antônio Carlos, 6627, Campus UFMG – Pampulha, 31270-901 - Belo Horizonte – MG, Brasil. E-mail: [email protected]
A
vol. 49, n. 3, jul./sep., 2013
Stryphnodendron adstringens
(Mart.) Coville (Fabaceae)
proanthocyanidins quantitation by RP-HPLC
André Márcio do Nascimento, Priscila Tavares Guedes, Rachel Oliveira Castilho
*,
Cristina Duarte Vianna-Soares
Departamento de Produtos Farmacêuticos, Faculdade de Farmácia, Universidade Federal de Minas Gerais, Belo Horizonte, MG, Brazil
Stryphnodendron adstringens (Mart.) Coville (barbatimão) is a tree belonging to the Fabaceae family, and it is commonly found in the southeastern Brazilian cerrado. The stem bark of this tree is traditionally
used as an anti-inlammatory and antiseptic agent to treat leucorrhea and diarrhea, as well as to promote wound healing (owing to the presence of proanthocyanidins). Proanthocyanidins were obtained from the
ethanolic extract of S. adstringens stem bark andassessed by reversed phase–high performance liquid
chromatography with an ultraviolet/diode array detector. The identiied compounds included gallic
acid, catechin, gallocatechin (GC), epigallocatechin, and epigallocatechin gallate (EGCG). The selected
markers, GC and EGCG, were simultaneously used for chromatographic validation (linearity range: 30-330 ng, equivalent to 3-33 µg/mL; r>0.998). The method showed precision (intra-day relative standard deviation [RSD]: 1.72% for GC; 1.16% for EGCG; inter-day RSD: 1.74%–2.60% for both markers), accuracy, robustness, and selectivity. The limits of detection and quantitation were 0.29 µg/ml and 0.89 µg/ml for GC, and 0.88 µg/mL and 2.67 µg/mL for EGCG, respectively. In addition, S. obovatum was
evaluated and showed an average of 12.2 µg/mL for GC (equivalent to 1.22% w/w) and 14.2 µg/mL for EGCG (equivalent to 1.42% w/w) in the ethanolic extract. The quantitative results were compared to
those obtained for S. adstringens, which showed that the markers are present in both species.
Uniterms:Stryphnodendron adstringens/phytochemistry.Fabaceae/phytochemistry.Barbatimão/extrato
vegetal/evaluation. Proanthocyanidins/evaluation. RP-High performance liquid chromatography/análise
quantitativa.
Stryphnodendron adstringens (Mart.) Coville (barbatimão) é uma árvore da família Fabaceae encontrada no cerrado do sudeste do Brasil. As cascas do caule das espécies são tradicionalmente utilizadas como
agente antiinlamatório e antisséptico para o tratamento de diarreia e leucorreia, bem como para promover
a cicatrização de feridas, devido à presença de proantocianidinas. Estas substâncias obtidas a partir do
extracto etanólico (EE) de cascas do caule de S. adstringens foram avaliadas por cromatograia líquida de
alta eiciência de fase reversa. As substâncias identiicadas foram ácido gálico, catequina, galocatequina
(GC), epigalocatequina e galato de epigalocatequina (EGCG). Os marcadores selecionados, GC e EGCG,
foram utilizados simultaneamente para validação cromatográica (intervalo de linearidade 30-330 ng, equivalente a 3-33 µg/mL, r>0,998). O método mostrou precisão (intra-dia DPR 1,72% para GC; 1,16% para EGCG; inter-dia DPR 1,74%–2,60% para ambos os marcadores), exatidão, robustez e seletividade. Os limites de detecção e de quantiicação de 0,29 µg/mL e 0,89 µg/mL para a GC, e 0,88 ng/mL e 2,67 µg/mL para EGCG, respectivamente. Outra espécie (S. obovatum) avaliada, mostrou valores médios 12,2
µg/mL de GC (equivalente a 1,22% p/p) e 14,2 µg/mL de EGCG (equivalente a 1,42% p/p) encontrados
no EE. Os resultados quantitativos comparam-se aos de S. adstringens e mostram que tais marcadores estão presentes em ambas as espécies.
INTRODUCTION
Stryphnodendron adstringens (Martius) Coville,
Fabaceae, is among the most widely used plants for wound treatment in traditional medicine (Forero, 1972). Its registry
has been deposited in the Missouri Botanical Garden (MOBOT) nomenclature database (Missouri, 2009). This
plant was described in the 19th century by naturalists who
traveled throughout southeast Brazil, in particular, the state of Minas Gerais (Brandão et al., 2008). Popularly known in Brazil as barbatimão, infusions of the stem bark of S. adstringens are used as an anti-inlammatory or antiseptic
agent, as well as in the treatment of leucorrhea, diarrhea, and wound healing. Previous studies have described
anti-ulcerogenic, antioxidant, anti-tyrosinase, antimicrobial, trypanocidal, leishmanicidal, and molluscicidal properties of Stryphnodendron species (Audi et al., 1999; Baurin et al., 2002; Bezerra et al., 2002; Herzog-Soares et al., 2002; Rebecca et al., 2003; Lopes et al., 2005; Luize et al., 2005;
Ishida et al., 2006; Souza et al., 2007).
Rebecca et al. (2003) suggested that a long period of per os (p.o.) administration of barbatimão aqueous extract in mice promotes its toxic effects. On the other hand, Costa et al. (2010) and Sousa et al. (2003) reported that the extract of S. adstringens and its proanthocyanidin
polymer-rich fraction did not show genotoxicity.
A variety of compounds have been isolated from the Stryphnodendron genus, including triterpenes and, mainly, tannins (prodelphinidins and prorobinetinidins) (Mello,
Petereit, Nahrstedt, 1996a; Mello, Petereit, Nahrstedt, 1996b; Mello, Petereit, Nahrstedt, 1999; Lopes et al., 2008).
Oficial monographs of S. adstringens can be found
in the Brazilian Pharmacopeia, in which the
ultraviolet-visible spectrophotometry (UV-Vis) technique for determining tannin content is described (Farmacopeia, 2012). This technique is also described in the British Pharmacopoeia(British, 2011) and the European Pharmacopoeia (European, 2011). Usually described in official compendia, either the UV-Vis Folin-Denis or Ciocalteu methods are based on total phenolics and tannins. These methods require variable sources of
a protein binding agent and a waiting period for the formation of the color compound (Schoield, Mbugua,
Pell, 2001).Although these methods are eficient, several
limitations make their routine use dificult. Furthermore, the diverse structures found in tannins causes dificulties
in their quantitation.
Previously reported methods for the determination
of tannins involve sample preparation with solid-phase
extraction or by liquid-liquid extraction (Nascimento et al., 2008; Lopes et al., 2009; Isler et al., 2010; Lopes et
al., 2010; Castilho et al., 2011). Another method involving
high performance liquid chromatography (HPLC) that
employs several sample preparation steps such as liquid-liquid and solid-phase extractions has recently been updated for the barbatimão monograph in the Brazilian Pharmacopeia (Farmacopeia, 2012).
Condensed tannins can precisely be quantified by
HPLC by using either normal or reverse-phase columns. However, the separation of higher polymeric tannins
(i.e., larger than tetramers) has not been accomplished, as reported by Waterhouse, Price, Maccord (1999), because the
presence of many isomeric tannins with similar polarities results in overlapping peaks with similar retention times.
In this study, we describe a specific, adequate reversed phase-HPLC (RP-HPLC) method using linear-gradient elution with UV/DAD detection for determination of proanthocyanidins in routine analyses. This method was
developed and validated using the selected biomarkers, gallocatechin (GC) and epigallocatechin gallate (EGCG),
simultaneously. The active compounds were determined
in stem bark extracts of S. adstringens and S. obovatum.
MATERIAL AND METHODS
Chemicals
Acetonitrile and methanol (HPLC grade) were
purchased from Tedia (Fairfield, OH, USA) and J.T. Baker (Phillipsburg, NJ, USA), respectively. Concentrated
phosphoric acid (85% w/v, Merck, Darmstadt, Germany) and commercial ethanol (96% [v/v]) were used. Ultrapure water was obtained using a Milli-Q plus system (Millipore, Milford, MA, USA). HPLC-grade reference substances used were gallic acid (GA; 98%, Acrós Organics, Geel, Belgium); quercetin (Q; 95%, Aldrich, Milwaukee, WI, USA); epigallocatechin (EGC; 90%, Fluka, Milwaukee, WI, USA); procyanidin B2 [epicatechin-(4β®8)-epicatechin; P, Extrasynthese, Genay, France]; and catechin (C; minimum 98%), gallocatechin (GC; minimum 98%), and epigallocatechin gallate (EGCG; minimum 95%) purchased from Sigma (Milwaukee, WI, USA).
Plant Material
The stem bark of S. adstringens (Martius) Coville,
S21°00′45.2″, WO44°18′42.1″). The samples were identiied by Prof. José R. Stehmann, Ph.D. (Botanical Department of Biological Sciences Institute, BDBSI), and a voucher specimen was deposited at the BDBSI
herbarium (coded as BHCB111231).
The stem bark of S. obovatum Benth. (Fabaceae) was collected from the central state of Mato Grosso do Sul, in
Campo Grande city (S20°24′37.4″ and WO54°36′52.5″). The species was identiied by Arnildo Pott, Ph.D. (National
Center for Research on Beef Cattle, CNPGC EMBRAPA, Campo Grande, MS), and a voucher specimen (32997)
was deposited at the CGMS herbarium of the Federal
University of Mato Grosso do Sul.
Sample preparation
The stem bark samples of S. adstringens and S. obovatum were separately dried in an oven at 40 °C until
a constant weight was obtained. They were then ground, and 170 g (in triplicate) was extracted (200 ml, 96% [v/v] commercial ethanol) by percolation for 2 weeks at an ambient temperature with the solvent changed every 24 h. The solvent from the ethanol extracts (EE) was removed in a rotavapor at 40°C, yielding a dark brown solid with 44.82% [w/w] (76.19 g) and 45.50% [w/w] (77.35 g) dry
mass for S. adstringens and S. obovatum, respectively.
Ethanolic extract purification
EE was puriied by liquid-liquid extraction by using ethyl acetate:butanol:2-propanol:water (3.5:0.5:1.0:4.5). An aliquot of EE (250 mg) was accurately weighed,
transferred to a separation funnel, and vigorously extracted
3-fold with the solvent system. The irst organic (OF1) and aqueous fractions (AF1) were separately collected. AF1 was again extracted with the same amount of the saturated
organic phase of the solvent system to yield the OF2
fraction. The inal combined organic and aqueous fractions were separately evaporated under warm air stream (40 °C) to dry the residues.
Analysis of extracted samples
EE samples from the 2 different species of barbatimão (S. adstringens and S. obovatum) were evaluated (in duplicate) using the validated method. Both extracts
were puriied by the described liquid-liquid partition. An
aliquot of the combined OF (100 mg) from each species
was accurately weighed in a volumetric lask (10 mL), and the volume was adjusted with methanol. Thereafter, a 1-mL aliquot was transferred to a 10-mL volumetric lask,
and the volume was completed with puriied water.
Analytical conditions
Chromatographic analyses were carried out using a
HP1100 system (Agilent, Santa Clara, USA) coupled to a quaternary pump, an auto sampler, and a programmable
ultraviolet photodiode array detector (UV/DAD). A HPChemStation for LC3D systems software (Rev. B.02.01-SR2[260] 2001-2006) was used to assess the data. A reversed-phase pre-column C18 (XDB Zorbax®, 4 × 4 mm
I.D.; 5 µm, Agilent, Santa Clara, USA) was attached to a C18
column (LiChrospher100, 250 × 4 mm I.D.; 5 µm, Merck,
Darmstadt, Germany) at 40 °C. After iltration with
0.45-µm PTFE membrane, 10 mL of the standard and sample
solutions were automatically injected into the system at a low rate of 1 mL/min and detected at a wavelength of 210 nm. UV/DAD spectral lines were recorded for peak purity and identiication in the wavelength range of 190–400 nm, and substance elutions were conirmed by co-elution of the
standards. The degassed mobile phase consisted of aqueous 0.1% phosphoric acid (solution A) and 0.1% phosphoric acid in acetonitrile (solution B). The linear gradient used
was from A-B (95:5 [v/v]) to A-B (60:40 [v/v]) in 60 min, which was followed by cleaning and reconditioning of the
column in 15 min. The tannin retention time (tR), retention
factor (k), resolution (R), column eficiency (N), and tailing factor (T) were assessed.
Standard solutions
Circa 5 mg, accurately weighed for each of the
reference substances (i.e., GA, C, Q, EGC, P, GC, and EGCG) were individually transferred to 5-mL volumetric lasks. Methanol was added to the standards to achieve a volume of 5 mL.
Validation
National guidelines for the validation of analytical
and bioanalytical methods (RE 899/2003), and international ICH guideline requirements for analytical methods were adhered to for evaluation of the method performance (Agência, 2003; International, 1996).
Selectivity
The purity of the elution peaks for the reference
substances and extracts was assessed by UV/DAD spectra
plus the chromatographic system suitability parameters
Linearity
A standard stock solution containing 1 mg/mL each of GC prepared in 10% (v/v) methanol. Aliquots of this solution (3, 9, 15, 21, 27, and 33 mL, in triplicate) were injected. Separate calibration curves were evaluated by plotting their injected concentration (3–33 µg/mL
equivalent to 30–300 ng) versus peak areas for both GC
and EGCG. Data were submitted for regression analysis
and compared by ANOVA and Tukey tests.
Precision
The intra-day precision (repeatability) was evaluated at 100% of the working concentration (15 µg/mL, n=6).
Similarly, the inter-day precision (n=12) was evaluated for
2 different days by different analysts. The concentration
of GC or EGCG in the organic fraction of the EE was
determined, and the relative standard deviation (RSD)
was calculated.
Accuracy
Stock solutions (1 mg/mL) of each reference (i.e., for EGCG and GC) were added to the dry extracts before purification to obtain 3 different working concentrations (60%, 100%, and 140%). Accuracy was also tested after puriication at the same concentration levels by the addition of adequate volumes (20 µg/mL) of each reference solution to the OF. Samples were
prepared in triplicate, and the recovery percentage for
each level was determined using the standard addition
method.
Detection and quantitation limits
The limit of detection (LOD) and limit of quantitation (LOQ) for GC and EGCG were estimated on the basis of
the ratio of standard deviation of the y-intercept (sa) of the regression lines and the slope (b) of the calibration curve
by using the equations LOD = 3.3sa/b and LOQ = 10sa/b, respectively.
Robustness
Six sample solutions at a working concentration of 100% were prepared and analyzed under the established conditions, as well as under intentionally varied conditions
of analytical parameters (e.g., chromatographic column supplier and gradient slope). The GC and EGCG marker
contents and RSD were determined for each condition.
Data were submitted for statistical analysis (ANOVA, a = 0.05, Tukey test).
RESULTS AND DISCUSSION
Development and optimization of the chromatographic method
The EE samples of S. adstringens were initially tested along different linear gradient conditions (results not
shown), considering that baseline drifting was not desirable
because it can cause a decrease in analytical accuracy
and precision. The tested solvent systems (water:ACN with either acetic or phosphoric acid in both solvents and water:ACN with no added acid) indicated that a decrease in
the mobile phase pH clearly affected peak shape in a desired fashion, leading to an increase in peak symmetry. Thus,
phosphoric acid in the mobile phase was more effective than
acetic acid. The effect of temperature on analyte retention
and selectivity was tested by setting the column temperature
to 25 °C, 30 °C, or 40°C, and a better separation was
obtained at 40°C. The wavelength at 210 nm showed the
greatest signal intensity for tannin peak evaluation. A small
value of the slope of the linear gradient A–B (95:5→60:40 [v/v]) led to a complete resolution of the main peaks with a low baseline drift in a total run time of 60 min.
Sample purification and elution pattern
The puriication step, performed as a sample cleanup
to eliminate the cluster of polar compounds in the matrix,
was critical and considered necessary for vegetal complex
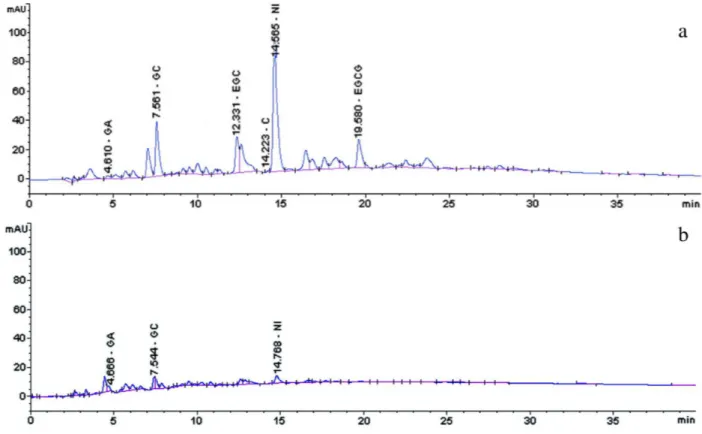
matrices. The EE of S. adstringens was purified by liquid-liquid extraction by using an adequate, previously developed solvent system (Nascimento et al., 2008). The
yields were 36% and 58% [w/w] for OF (Figure 1a) and
AF (Figure 1b), respectively.
Five (GA, C, GC, EGC, and EGCG) of the 7
reference substances were selected to assess EE eluate of
the 2 barbatimão species stem bark samples. The presence
of the reference substances in the EE was also conirmed
by retention time (tR) co-elution experiments and UV/
DAD. The chromatographic results showed a proile with the identiication of 3 main peaks (GA, GC, and EGCG) with good resolution. Two other identified peaks eluted together with R<1.5 (EGC, tR 12.33 and C tR 14.22). GA and
C were present in very low concentrations in the extract. EGC did not yield adequate resolution (R 1.124) since it eluted with adjacent peaks. There was a major unidentiied
peak (tR 14.56 min), which co-eluted (R 1.311) with C
be a substance of the proanthocyanidin group because
of the presented UV/DAD spectrum profile. It has not been identiied or characterized in this study, as such an investigation is beyond the scope of this work. Although this substance constituted a major peak and could be selected as a good marker, it is neither well resolved nor commercially available. Thus, if chosen for use as a marker, it would prove to be impractical for use in routine analyses. It requires more
investigation for a better-fit characterization in the near
future. Quercetin and procyanidin B2 were not detected
under the described conditions.
The elution patterns of GC (tR 7.561 min, R 1.514,
k′ 2.70) and EGCG (tR 19.580 min, R 1.964, k 8.23) were
more than satisfactory. Therefore, they were selected as markers for quantitation. It is noteworthy to report that
the selected markers, GC and EGCG, remained in the OF (Figure 1a) rather than in the AF (Figure 1b).
Validation
The spectral purity of the proanthocyanidins
derivative peaks was assessed using the UV/DAD system.
The peak purity of the standard elution was higher than 98.5% for all phenolic derivatives, thus conirming that
the analyte peak is attributed to only one component. The
resolution (R) obtained was greater than 7 for all reference
peaks, representing adequate separation of the components in the standard chromatogram.
In the EE sample of S. adstringens, the resolution
obtained for GC or EGCG peaks was greater than 1.5, a
value that indicates good separation. Therefore, the results attest that the method is selective for the determination of tannins in S. adstringens.
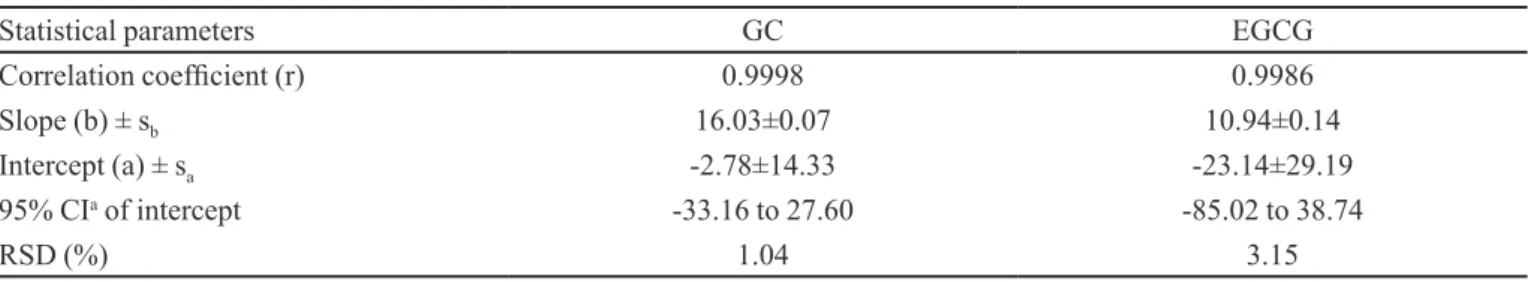
Linear regression analyses were performed by the
least squares method by using external standards. The
calibration curve and parameters correlation coeficient,
slope, intercept, standard error of the slope, standard error of the intercept, and relative standard deviation (r; b; a; sb; sa, RSD) at 95% conidence level interval for each marker
are shown in Table I. Equivalent concentration and mass ranges were 3–33 µg/mL or 30–330 ng, respectively.
A linear relationship (r>0.99) was found for the calibration curve plots of GC or EGCG concentration versus peak areas in the assayed range. Graphical
FIGURE 1 Chromatograms of S. adstringens stem bark (a) organic fraction (OF) containing the majority of the identiied peaks (GA, gallic acid; GC, gallocatechin; EGC, epigallocatechin; C, catechin; EGCG, epigallocatechin gallate) and a non-identiied (NI) substance peak; (b) aqueous fraction (AF) shows minority of eluted peaks from EE of S. adstringens. Conditions: pre-column C18 (XDB Zorbax®, 4 × 4 mm I.D.; 5 µm), attached to a C18 column (LiChrospher100, 250 × 4 mm I.D.; 5 µm); linear gradient elution,
examination of the data and the residuals showed linearity and homocedasticity, respectively. Table II shows the
results for the application of this method for identifying
each marker (GC, 13.15±0.23 µg/mL and EGCG, 13.40 ± 0.15 µg/mL) in the EE of S. adstringens. Intra-day
precision (n=6) RSD results ranged from 1.16% to 1.72%, and the inter-day (n=12) RSD values ranged from 1.74%
to 5.01% for S. adstringens markers when considering different days and analysts. The acceptance criteria for
precision were highly dependent on the type of matrix and
the amount of active compounds assessed in the analysis.
An RSD value ≤5% is usually considered acceptable
for the results of drug determination in dosage forms
(Agência, 2003). However, for biological and vegetal
complex matrices, higher values (e.g., up to 15%) are
considered acceptable (Grdinic, Vukovic, 2004). Hence, the method shows satisfactory precision for intra-assay
(repeatability) and inter-assay (intermediate precision) assessments.
The average recovery (n=3) of the standard addition
before liquid-liquid extraction (purification) for the 3
concentration levels (60%, 100%, and 140%) was 78.58% (RSD 18.75%) for GC, and 101.84% (RSD 2.32%) for
EGCG. Higher RSD values for GC indicate the importance of the purification step in determining recovery rates.
Additionally, the average recovery (n=3) of the standards placed directly onto OF (after puriication) was 76.50% (RSD 4.53%) for GC and 104.98% (RSD 3.21%) for
EGCG (Table III). Therefore, GC seems to be more labile
than the more stable ester form (i.e., EGCG).
Lower GC recoveries with greater RSD values were observed. This may be indicative of degradation
throughout the analytical procedure. Certain factors, including light exposition and temperature, may promote
degradation, which has been previously reported for lavan-3-ols (Friedman, Jurgens, 2000; Chen et al., 2001;
Wang, Zhou, Wen, 2006). Moreover, 0.2% ascorbic acid and 0.02% EDTA were added to both the standard and
sample solutions in order to prevent secondary metabolite degradation in the determination of antioxidants in
botanicals, supplements, and beverages by RP-HPLC-UV/ DAD gradient elution with detection at λ254 nm (Ulluci et al., 2012). Desirable analyte recovery rates near 100% are
probably achievable with the addition of ascorbic acid and EDTA, but lower values are acceptable since the results provide linearity, precision, and selectivity (International, 1996; Agência, 2003). Moreover, lower recovery rates are
acceptable considering the complexity of the matrix and lability of the analyte (Dhooghe et al., 2008; Serpe et al.,
2010). Therefore, precision with an RSD value lower than 4.6% and recovery higher than 76% for GC indicate that
the developed method provided precise and acceptably accurate results in the EE of S. adstringens (Agência, 2003).
The developed method is considered precise and
accurate for EGCG because recovery rates obtained were
TABLE I - Linearity results for gallocatechin (GC) and epigallocatechin gallate (EGCG) calibration curves in the concentration range 3-33 mg/mL by RP-HPLC-UV gradient elution (n=18). Conditions see Figure 1
Statistical parameters GC EGCG
Correlation coeficient (r) 0.9998 0.9986
Slope (b) ± sb 16.03±0.07 10.94±0.14
Intercept (a) ± sa -2.78±14.33 -23.14±29.19
95% CIa of intercept -33.16 to 27.60 -85.02 to 38.74
RSD (%) 1.04 3.15
a conidence interval
TABLE II - Summary results for intra-day (n=6) and inter-day (n=12) precision for gallocatechin (GC) and epigallocatechin gallate (EGCG) determination in S. adstringens organic fraction (OF)
Precision Analyst Day Concentration, µg/mL [x±s
a (RSD%)]
GC EGCG
Intra-day 1 1 13.15±0.23 (1.72) 13.40±0.15 (1.16) Inter-day 1 and 1 1-2 13.06±0.23 (1.74) 13.30±0.35 (2.60) 1 and 2 1-2 13.76±0.69 (5.01) 13.18±0.36 (2.76)
close to 100% and RSD average values were lower than 3.5% in both experiments, before and after the puriication step (Table III).
The estimated LOD obtained for GC and EGCG were 0.29 and 0.88 µg/mL, respectively, whereas the limits of quantitation were 0.89 and 2.67 µg/mL for GC and EGCG, respectively. The low values of LODs and LOQs
demonstrate the high sensitivity of the method presented in this study.
Statistical analysis showed no signiicant differences between the intentional variations in analytical conditions
relative to the established conditions. The p-values were greater than the critical value (p>0.05), thus indicating no
statistical signiicant difference. Hence, the method was
robust for different column suppliers (GC, p=0.9933; EGCG, p=0.1037), as well as for different values of the
gradient slope applied by alterations in the mobile phase
composition, for instance, 4.8% to 41.0% ACN (GC,
p = 0.5188; EGCG, p = 0.3220) and 5.2% to 39.0% ACN (GC, p=0.9821; EGCG, p=0.1525).
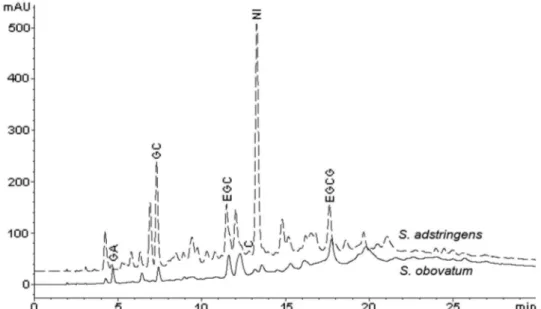
S. obovatum method application
The OF of the EE of S. obovatum was also analyzed.
The average tannin content was 12.2 µg/mL (equivalent to 1.22% w/w) and 14.2 µg/mL (equivalent to 1.42% w/w) for GC and EGCG, respectively. The values of the quantitative results were similar to those for S. adstringens
(Table II). They also show that such markers are present in both species (Figure 2) and are quantiied with minimal variation between species. Therefore, the method is also
adequate for tannin determination in S. obovatum. TABLE III - Precision and recovery results (n=3) of gallocatechin (GC) and epigallocatechin gallate (EGCG) before and after puriication of organic fraction from S. adstringens stem bark EE
Marker Level (%) a %Recovery
b
[x±sd(%RSD)]
%Recovery c
[x±sd(%RSD)]
GC 140 70.06±2.10 (3.00) 75.81±0.43 (0.57)
100 67.94±4.80 (7.07) 74.73±4.77 (6.38) 60 97.75±3.31 (3.39) 78.95±3.26 (4.13)
Average 78.58±14.73 (18.75) 76.50±3.46 (4.53)
EGCG 140 99.34±2.10 (2.11) 103.24±0.72 (0.70)
100 102.79±1.15 (1.12) 103.91±1.09 (1.05) 60 103.39±1.53 (1.48) 107.78±5.06 (4.70)
Average 101.84±2.37 (2.32) 104.98±3.37 (3.21)
a theoretical concentration level, b before puriication, c after puriication; d average±standard deviation
CONCLUSION
In this study, we described the development of
an extractive analytical method for the determination
of tannins in plant-derived products. The data showed that it is possible to eliminate major interferences with a single liquid-liquid puriication step only by using an eficient solvent system for sample cleanup, as well as for the identiication and quantiication of speciic tannin markers. Interestingly, the described chromatographic method allows for the analysis of the characteristic tannins
(monomer markers) instead of total phenolics, as reported by compendial methods.
The developed, extractive analytical method
employing RP-HPLC-UV/DAD (l=210 nm) was shown to be speciic, linear, precise, accurate, and robust for GC
and EGCG determination in barbatimão (S. adstringens)
stem bark extracts, as well as for tannin determination
(e.g., in S. obovatum).
ACKNOWLEDGEMENTS
The authors thank Mrs. Aparecida C.P. Santos,
Ph.D., (DCNAT/UFSJ) for technical support; Laboratório Usmed Ltda., CEDAFAR/FAFAR/UFMG, FUNDECT (41/100172/05); and CNPq (471374/2004-0) for inancial
support.
REFERENCES
AGÊNCIA NACIONAL DE VIGILÂNCIA SANITÁRIA (Brasil). Resolução n.899, de 29 de maio de 2003. Guia para validação de métodos analíticos e bioanalíticos.
Diário Oicial da União. Poder Executivo, Brasília DF, 02 de Junho de 2003. Available at: <www.anvisa.gov.br/legis/ resol/2003/re/899_03re.htm>. Accessed on: March 2012.
AUDI, E.A.; TOLEDO, D.P.; PERES, P.G.; KIMURA, E.; PEREIRA, W.K.V.; MELLO, J.C.P.; NAKAMURA, C.V.; ALVES PRADO, W.; CUMAN, R.K.N.; BERSANI-AMADO, C.A. Gastric antiulcerogenic effects of Stryphnodendron adstringens in rats. Phytother. Res., v.13, n.3, p.264-266, 1999.
BAURIN, N.; ARNOULT, E.; SCIOR, T.; DO, Q.T.; BERNARD, P. Preliminary screening of some tropical plants for anti-tyrosinase activity. J. Ethnopharmacol., v.82, n.2-3, p.155-158, 2002.
BEZERRA, J.C.B.; SILVA, I.A.; FERREIRA, H.D.; FERRI, P.H.; SANTOS, S.C. Molluscicidal activity against Biomphalaria glabrata of brazilian cerrado medicinal plants. Fitoterapia, v.73, n.5, p.428-430, 2002.
BRANDÃO, M.G.L.; ZANETTI, N.N.S.; OLIVEIRA, P.; GRAEL, C.F.F.; SANTOS, A.C.P.; MONTE-MÓR, R.L.M. Brazilian medicinal plants described by 19th century European naturalists and in the oficial pharmacopoeia. J. Ethnopharmacol., v.120, n.2, p.141-148, 2008.
BRITISH PHARMACOPOEIA. London: Her Majesty’s Stationery Ofice, 2011. p.A297.
CASTILHO, R.O.; NASCIMENTO, A.M.; VIANNA-SOARES, C.D.; GUEDES, P.T. Extractive analytical method for tannins determination on raw materials and plant products. WO. Pat.2011017792, A1. Pat.20110217, CAN. Pat.154:233148, AN Pat.2011:205998, 2011. 37 p.
CHEN, Z.; ZHU, Q.Y.; TSANG, D.; HUANG, Y.Z. Degradation of green tea catechins in tea drinks. J. Agric. Food Chem., v.49, n.1, p.477-482, 2001.
COSTA, M.A.; ISHIDA, K.; KAPLUM, V.; KOSLYK, E.D.A.; MELLO, J.C.P.; UEDA-NAKAMURA, T.; FILHO, B.P.D.; NAKAMURA, C.V. Safety evaluation of proanthocyanidin polymer-rich fraction obtained from stem bark of Stryphnodendron adstringens (barbatimão) for use as a pharmacological agent. Regul. Toxicol. Pharmacol., v.58, n.2, p.330-335, 2010.
DHOOGHE, L.; MESIA, K.; KOHTALA, E.; TONA, L.; PIETERS, L.; VLIETINCK, A.J.; APERS, A. Development and validation of an HPLC-method for the determination of alkaloids in the stem bark extract of Nauclea pobeguinii. Talanta, v.76, n.2, p.462-468, 2008.
EUROPEAN PHARMACOPOEIA. 7.ed. Strasbourg: Directorate of Quality of Medicines of the Council of Europe, 2011. 243 p.
FARMACOPEIA BRASILEIRA. 5.ed. Brasília: ANVISA, 2010. Available at: <http://www.anvisa.gov.br/hotsite/ cd_farmacopeia/index.htm.>. Accessed on: August 2012.
FRIEDMAN, M.; JURGENS, H.S. Effect of pH on the stability of plant phenolic compounds. J. Agric. Food Chem., v.48, n.6, p.2101-2110, 2000.
GRDINIC, V.; VUKOVIC, J. Prevalidation in pharmaceutical analysis. Part I. Fundamentals and critical discussion. J. Pharm. Biomed. Anal., v.35, n.3, p.489-512, 2004.
HERZOG-SOARES, J.D.; ALVES, R.K.; ISAC, E.; BEZERRA, J.C.B.; GOMES, M.H.; SANTOS, S.C.; FERRI, P.H. Atividade tripanocida in vivo de Stryphnodendron adstringens (barbatimão verdadeiro) e Caryocar brasiliensis (pequi). Rev. Bras. Farmacogn., v.12, suppl.1, p.1-2, 2002.
INTERNATIONAL CONFERENCE ON HARMONISATION. Validation of analytical procedures: text and methodology Q2B (R1). ICH, 2005. Available at: <http://www.ich.org/ fileadmin/Public_Web_Site/ICH_Products/Guidelines/ Quality/Q2_R1/Step4/Q2_R1__Guideline.pdf>. Accessed on: March 2012.
ISHIDA, K.; MELLO, J.C.P.; CORTEZ, D.A.G.; DIAS-FILHO, B.P.; UEDA-NAKAMURA, T.; NAKAMURA, C.V. Inluence of tannins from Stryphnodendron adstringens on growth and virulence factors of Candida albicans. J. Antimicrob. Chemother., v.58, n.5, p.942-949, 2006.
ISLER, A.C.; LOPES, G.C.; CARDOSO, M.L.C.; MELLO, J.C.P.; MARQUES, L.C. Development and validation of a LC-method for the determination of phenols in a pharmaceutical formulation containing extracts from Stryphnodendron adstringens. Quím. Nova, v.33, n.5, p.1126-1129, 2010.
LOPES, G.C.; BLAINSKI, A.; SANTOS, P.V.P.; DICIAULA, M.C.; MELLO, J.C.P. Development and validation of an HPLC method for the determination of epicatechin in Maytenus ilicifolia (Schrad.) Planch., Celastraceae. Rev. Bras. Farmacogn., v.20, n.5, p.789-795, 2010.
LOPES, G.C.; MACHADO, F.A.V.; TOLEDO, C.E.M.; SAKURAGUI, C.M.; MELLO, J.C.P. Chemotaxonomic s i g n i f i c a n c e o f 5 - d e o x y p r o a n t h o c y a n i d i n s i n Stryphnodendron species. Biochem. Syst. Ecol., v.36, n.12, p.925-931, 2008.
LOPES, G.C.; SANCHES, A.C.C.; NAKAMURA, C.V.; DIAS FILHO, B.P.; HERNANDES, L.; MELLO, J.C.P. Inluence of extracts of Stryphnodendron polyphyllum Mart. and Stryphnodendron obovatum Benth. on the cicatrisation of cutaneous wounds in rats. J. Ethnopharmacol., v.99, n.2-3, p.265-272, 2005.
LOPES, G.C.; SANCHES, A.C.C.; TOLEDO, C.E.M.; ISLER, A.C.; MELLO, J.C.P. Determinação quantitativa de taninos em três espécies de Stryphnodendron por cromatograia líquida de alta eiciência. Braz. J. Pharm. Sci., v.45, n.1, p.135-143, 2009.
LUIZE, P.S.; TIUMAN, T.S.; MORELLO, L.G.; MAZA, P.K.; UEDA-NAKAMURA, T.; DIAS-FILHO, B.P.; CORTEZ, D.A.G.; MELLO, J.C.P.; NAKAMURA, C.V. Effects of medicinal extracts on growth of Leishmania (L.) amazonensis and Trypanosoma cruzi. Braz. J. Pharm. Sci., v.41, n.1, p.1-10, 2005.
MELLO, J.C.P.; PETEREIT, F.; NAHRSTEDT, A. Flavan-3-ols and prodelphinidins from Stryphnodendron adstringens. Phytochemistry, v.41, n.3, p.807-813, 1996a.
MELLO, J.C.P.; PETEREIT, F.; NAHRSTEDT, A. Prorobinetinidins from Stryphnodendron adstringens. Phytochemistry, v.42, n.3, p.857-862, 1996b.
MELLO, J.C.P.; PETEREIT, F.; NAHRSTEDT, A. A dimeric proanthocyanidin from Stryphnodendron adstringens. Phytochemistry, v.51, n.8, p.1105-1107, 1999.
MISSOURI BOTANICAL GARDEN. Nomenclatural database. Available at: <http://mobot.mobot.org/W3T/Search/vast. html.>. Accessed on: December 2009.
NASCIMENTO, A.M.; CASTILHO, R.O.; BRANDÃO, M.G.L.; VIANNA-SOARES, C.D. Desenvolvimento
de método por CLAE para determinação de taninos
condensados deStryphnodendron adstringens. XXXI Encontro Anual da Sociedade Brasileira de Química: Águas de Lindóia, 2008. Available at: <http://sec.sbq. org.br/cdrom/31ra/resumos/T1757-2.pdf.>. Accessed on: March 2012.
REBECCA, M.A.; ISHII-IWAMOTO, E.L.; GRESPAN, R.; CUMAN, R.K.N.; CAPARROZ-ASSEF, S.M.; MELLO, J.C.P.; BERSANI-AMADO, C.A. Toxicological studies on Stryphnodendron adstringens. J. Ethnopharmacol., v.83, n.1-2, p.101-104, 2002.
SCHOFIELD, P.; MBUGUA, D.M.; PELL, A.N. Analysis of condensed tannins: a review. Anim. Feed Sci. Technol., v.91, n.1-2, p.21-40, 2001.
SERPE, F.P.; ESPOSITO, M.; GALLO, P.; SERPE, L. Optimisation and validation of an HPLC method for determination of polycyclic aromatic hydrocarbons (PAHs) in mussels. Food Chem., v.122, n.3, p.920-925, 2010.
SOUSA, N.C.; CARVALHO, S.; SPANÓ, M.A.; GRAF, U. Absence of genotoxicity of a phytotherapeutic extract from Stryphnodendron adstringens (Mart.) Coville in somatic and germ cells of Drosophila melanogaster. Environ. Mol. Mutag., v.41, n.4, p.293-299, 2003.
SOUZA, T.M.; SEVERI, J.A.; SILVA, V.Y.A.; SANTOS, E.; PIETRO, R.C.L.R. Bioprospection of antioxidant and antimicrobial activities in the bark of Stryphnodendron adstringens (Mart.) Coville (Leguminosae–Mimosoideae). Rev. Ciênc. Farm. Básica Apl., v.28, n.2, p.221-226, 2007.
ULLUCI, P.A.; BAILEY, B.A.; THOMAS, D.H.; ACWORTH, I.N. The spectro-electro array: a novel platform for the measurement of secondary metabolites in botanicals, supplements, and beverages. LC-GC North America, v.30. n.6, p.492-503, 2012.
WANG, R.; ZHOU, W.; WEN, R.H. Kinetic study of the thermal stability of tea catechins in aqueous systems using a microwave reactor. J. Agric. Food Chem., v.54, n.16, p.5924-5932.
2006.
WATERHOUSE, A.L.; PRICE, S.F.; MACCORD, J.D. Reversed-phase high-performance liquid chromatography methods for analysis of wine polyphenols. Methods Enzymol., v.299, p.113-121, 1999.
Received for publication on 13th September 2012