Efect of an Organo-Modiied Montmorillonite on the Barrier Properties of PET
Nanocomposites Using a Polyester Ionomer as a Compatibilizing Agent
Suel Eric Vidottia*, Anne Cristine Chinellatoa, Guo-Hua Hub, Luiz Antonio Pessanc
Received: October 04, 2016; Revised: March 15, 2017; Accepted: April 21, 2017
Poly(ethylene terephthalate)/organically modiied montmorillonite (PET/o-Mt) nanocomposites were prepared via melt intercalation in a twin-screw extruder using a polyester ionomer (PETi) as compatibilizer. The o-Mt content used was 0, 1, 3 or 5 wt% and the compatibilizer/o-Mt mass ratio was 0/1, 1/1 or 3/1. The main objective was to study the efects of the addition of o-Mt and compatibilizer on the barrier properties of PET/o-Mt nanocomposites. The nanocomposites showed a signiicant reduction in CO2 permeability of up to 50% when compared to the neat PET, without signiicant
change in the CO2 solubility revealing the importance of the difusional path imputed by the organoclay
on the overall permeation process. Water vapor permeability was reduced for all nanocomposites, achieving up to 30% reduction for the nanocomposite containing a compatibilizer/o-Mt mass ratio of 1/1. Overall, the nanocomposite containing 5 wt% of organoclay and compatibilizer/o-Mt mass ratio of 1/1 showed the best barrier properties.
Keywords: PET nanocomposite, Organoclay, Polyester ionomer compatibilizer, Barrier properties, Permeability
* e-mail: [email protected]
1. Introduction
The use of nano-scale illers has led to the development of polymer nanocomposites and has provided a potential alternative to conventional polymer composites.
Polymer-layered silicate nanocomposites prepared with an organically
modiied montmorillonite (o-Mt) are of increasing interest for packaging applications. These nanocomposites show
improved mechanical and barrier properties compared to
the corresponding neat polymer matrix and conventional composites due to the nano-scale reinforcement and the tortuous difusion path caused by the high aspect ratio of aluminosilicate layers1-5. In order to maximize these beneits it is necessary to achieve a high level of organoclay exfoliation, uniform distribution and appropriate orientation of clay platelets6-9.
Among various processes, the following two are considered as being commercially attractive for preparing
layered silicate based polymer nanocomposites: in situ polymerization and melt compounding10,11. The second one
is especially appealing because classical melt compounding equipment and standard processing conditions can be used. Depending on the nature of the components used (layered
silicate, organic modiier, polymer matrix and compatibilizer) and preparation process, three main types of composites
may be obtained: conventional composite and intercalated
or exfoliated nanocomposites10.
In conventional composites, the polymer is unable to intercalate silicate layers. Thus its properties are not very diferent from that of traditional microcomposites. Intercalated nanocomposites show a well-ordered multilayered structure
(alternating polymer and inorganic layers) in which polymer chains are inserted into the interlayer spaces between
individual silicate layers. Exfoliated nanocomposites are achieved when individual silicate layers are completely separated and uniformly distributed in the polymer matrix10.
Properties of intercalated and exfoliated nanocomposites are usually signiicantly improved compared to conventional
composites or the neat polymer.
However, it is not always possible to reach an intercalated
or exfoliated state of dispersion of layered silicate particles by melt compounding12. Optimal mixing conditions and
adequate surface treatment of silicates should be applied to prepare exfoliated nanocomposites12-16. The use of polymers containing polar functional groups and/or ionomers as compatibilizers also promotes the dispersion of silicates and may lead to intercalated and/or exfoliated nanocomposites17-21.
a Centro de Engenharia, Modelagem e Ciências Sociais Aplicadas, Universidade Federal do ABC
(CECS/UFABC), Avenida dos Estados, 5001, Bloco A, Torre 1, sala 618, Bairro Santa Terezinha, CEP: 09210-580, Santo André, SP, Brazil
b Laboratoire Réactions et Génie des Procédés (CNRS UMR 7274), Ecole Nationale Supérieure
des Industries Chimiques (LRGP/ENSIC), Université de Lorraine, 1 rue Grandville, BP 20451, Nancy F-54001, France
c Departamento de Engenharia de Materiais, Universidade Federal de São Carlos (DEMa/UFSCar),
The gas permeation in a homogeneous polymer matrix is governed by a mechanism of difusion and solubility. The difusion coeicient (D) describes the kinetic aspect of the transport whereas the solubility coeicient (S) relects the penetrant/polymer ainity and the thermodynamic aspect of the transport. In the case of a Fickian transport, the permeability coeicient (P) can be expressed by22:
This work was concerned with the preparation of poly(ethylene terephthalate)/organically modiied montmorillonite (PET/o-MT) nanocomposites via melt compounding, using a polyester ionomer as compatibilizer. The main objective was to study the efects of the concentrations of o-MT and compatibilizer on the barrier properties of these nanocomposites.
2. Experimental
2.1. Materials
The PET was obtained from Eastman Chemical (USA). It has an intrinsic viscosity of 0.78-0.84 dL/g and a melting point of 245-255ºC (DSC, ASTM E928). The polyester ionomer compatibilizer (PETi) was obtained from Kemira Chemical (Belgium). It was a sulfonated polyester ionomer with a commercial name of Gerol PS50. According to the technical data sheet of the suppliers, it was soluble in water and had a glass transition temperature of 45 ºC, a molar mass of about 60,000 g/mol and an ionomer content of 13 mol% (dimethyl isophthalate sodium sulfonate ionomer). The organoclay (o-MT) used in this study was Cloisite 20A
(d001 = 24.2 Å) supplied by Southern Clay Products (USA).
2.2. Preparation of nanocomposites
Nanocomposites were prepared using a co-rotating twin-screw extruder Clextral BC21 (twin-screw diameter = 25 mm and length-to-diameter ratio = 36) with a barrel temperature proile (from the feeding zone to the die) of 20, 255, 250, 240, 250, 235 and 240ºC. The screw speed and feed rate were 100 rpm and 3 kg/h, respectively. The screw proile used was described in a previous paper21.
Prior to compounding, the PET and PETi were dried for 24 hours at 100 and 60ºC, respectively. The o-MT content was 0, 1, 3 or 5 wt% of the total mass of the composite and the compatibilizer/o-Mt mass ratio was 0/1, 1/1 or 3/1. For each mixture, the components were pre-mixed mechanically at a prescribed ratio and then added to the extruder hopper. The designations of the nanocomposites are as follows: PET-xMyI with x and y indicating the wt% of the Mt and PETi compatibilizer, respectively.
The transmission electronic microscopy (TEM), diferential scanning calorimetry (DSC), CO2 gas sorption,
CO2 permeability and water vapor permeability analyses were
performed on thin ilms (~ 60 µm) prepared by compression molding at 260ºC under 3 ton for 2 min and then quickly
cooled in an iced water bath.
2.3. Characterization of nanocomposites
2.3.1. Nanocomposites morphology
For TEM analyses, PET/o-MMT nanocomposites ilms were microtomed at room temperature in the direction
.
( )
P
=
D S
1
A similar model has been considered to describe the gas
transport properties of composites in which impermeable illers are dispersed in a polymer matrix. Assuming that the iller does not absorb or conduct the penetrant, the local polymer matrix is not afected by the presence of the iller and the polymer/iller interactions are suiciently strong enough to avoid void formation at the interfaces, the gas solubility in the composite can be expressed as23:
(
)
( )
S
=
S 1
0-
z
2
where S0 is the penetrant solubility coeicient in the pure
polymer matrix and ϕ is the volumetric fraction of particles dispersed in the matrix.
In this approximation, the penetrant solubility does not depend on the morphological features of the phases. However, the difusion process of the penetrant is more complex. The particles act as impenetrable barriers so that the penetrant must follow an elongated (or tortuous) path in order to difuse through the composite24. The difusion rate
of the penetrant is slowed down and can be expressed as:
/
( )
D
=
D
0x
3
where D0 is the difusion coeicient in the neat polymer,
D the apparent difusion coeicient in the nanocomposites and τ the tortuosity.
For semi-crystalline polymers the permeation process is even more complex. Semi-crystalline polymers are discussed as materials consisting of two phases, namely the impermeable crystalline phase and the permeable amorphous matrix. The highly ordered sections hinder the dissolution of small gas molecules and delay difusion due to the tortuosity caused by the presence of crystalline regions, which are considered impermeable and act similarly to the iller25.
According to the simple composite theory, this tortuosity factor depends on the volume fraction of particles (ϕ), the
particle shape (aspect ratio) and the location and orientation
of the particles23,24. Combining equations 1 to 3 leads to the following expression for the relative composite permeability:
/
(
)/
( )
P P
0=
1
-
z
x
4
where P0 is the permeability coeicient in the neat polymer
perpendicular to the press surface using a Leica Reichert Ultracut S50 microtome with a Diatome ultra diamond knife. Samples of 30 to 50 nm thick were then analyzed using a JEOL 100CX Electron Microscope at 100 kV accelerating
voltage.
2.3.2. Thermal properties
A Perkin Elmer DSC Pyris 1 was used to analyze the thermal proiles of PET/o-Mt nanocomposites. Samples were heated from 30 to 290ºC at 10ºC/min, kept at 290ºC for 3 min, cooled to 30ºC at 10ºC/min and heated again to 290ºC under N2 atmosphere. The glass transition temperature (Tg)
reported in Table 1 were obtained during the irst heating. The melting temperatures (Tm), which correspond to the maximum of the endothermic peak, were obtained for the irst and second heating. The degree of crystallinity (Xc)
of the ilms was calculated using equation 5. The value of the melting enthalpy of 100% crystalline PET (∆Hm100%) corresponds to 140 J/g26.
variable pressure apparatus28. The CO
2 used was of analytical
grade. The temperature set at 35ºC and the area of the polymer ilm was 7.07 cm2. The upstream pressure was 2, 5
or 10 atm, respectively. The values of permeability (P) were expressed in Barrer [(cm3.(STP)cm/(s.cm2.cmHg) x 10-10]
and calculated using the following relationship:
( )
X
Hm
Hm
Hc
100
5
% c
PET cold
100
$
z
#
D
D
D
=
Q
-
V
where ∆Hm and ∆Hccold are the melting and cold
crystallization enthalpies of the samples in the irst heating, respectively; ϕPET is the mass percentage of the PET in the
nanocomposites.
2.3.3. Barrier properties
To measure the amount of CO2 sorbed at equilibrium (S)
in the neat PET and PET/o-Mt nanocomposites, an apparatus and a procedure similar to those described by Koros et al.27
were used. The sorption isotherms were obtained at 35ºC and the maximum pressure applied was 20 atm.
The CO2 permeability (P) of PET and PET/o-Mt
nanocomposites were measured using a constant volume/
Table 1. Glass transition temperature (Tg), cold crystallization temperature (Tcc), crystallization temperature (Tc), melting temperature in the
1st (Tm 1) and 2
nd (Tm
2) heating and relative crystallinity for the irst (Xc1) and second heating (Xc2) for PET and PET/o- Mt nanocomposites.
Sample Tga (ºC) Tc
c
a (ºC) Tm
1
a (ºC) Tca (ºC) Tm
2
a (%) Xc 1
b (%) Xc 2
b (%)
PETi 60 - - -
-PET 75 125 249 178 248 6.75 ± 0.97 27.74 ± 0.12
PET-1M 74 117 249 197 247 12.71 ± 0.06 32.92 ± 0.16
PET-1M1I 69 115 250 203 250 14.17 ± 0.14 34.18 ± 0.34
PET-1M3I 69 120 250 197 250 10.37 ± 0.21 32.71 ± 0.65
PET-3M 74 115 249 196 249 24.91 ± 0.37 32.98 ± 0.49
PET-3M3I 63 117 248 199 248 19.92 ± 0.60 33.51 ± 1.01
PET-3M9I 62 119 248 195 248 19.26 ± 1.16 35.28 ± 2.12
PET-5M 63 117 249 197 249 25.10 ± 0.63 33.23 ± 0.83
PET-5M5I 64 118 249 199 250 16.86 ± 0.84 32.52 ± 1.63
PET-5M15I 63 120 249 194 249 21.97 ± 2.20 34.64 ± 3.46
a Standard deviation ± 1 ºC.
b Values obtained according to equation 5.
.( )
. .
. .
( )
P
A p
m l V
5 171493
10
6
II
1
10
=
u
where mII = permeation rate (moles/s), l = ilm thickness,
V= molar volume, A = permeation area and p1 = upstream
pressure.
The difusion coeicient (D) was calculated from the
permeability (P) and sorption (S) data using the equation 1.
The nanocomposites water vapor permeability was measured by a microgravimetric method based on ASTM E E96/E96M - 1029. The parameters were calculated using equations 7 and 8:
Vu
( )
WVT
=
tA
G
7
( )
P
=
WVT
S
#
e
8
where G = mass variation (g), t = time (h), A= permeation
area (m2), WVT = rate of water vapor transmission (g/m2h),
e = ilm thickness (m), S = water vapor pressure saturation at the temperature of the experiment (mmHg).
3. Results and Discussion
3.1. Nanocomposites morphology
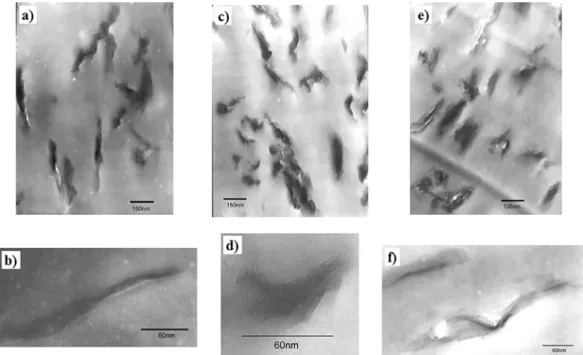
containing 1 and 3 wt% of o-Mt. For that reason, the TEM micrographs for those nanocomposites were not showed in this section. The main indings are presented to facilitate the correlation with the barrier properties of the materials. Figure 1 (a) - (f) shows the TEM micrographs of the nanocomposites containing 5 wt% of organoclay. All the nanocomposites presented regions of intercalated o-MMT layers. Moreover, the o-MMT particles were better dispersed in nanocomposites containing PETi. Overall, they were smaller and randomly distributed in the PET matrix21.
The TEM micrographs indicated the formation of intercalated structure for all nanocomposites. The nanocomposites prepared using the PETi compatibilizer also showed some regions with partial exfoliation.
A complete study of morphology of PET/organoclay nanocomposites using a polyester ionomer as a compatibilizing agent was developed in a previous work21.
3.2. Thermal properties
Figure 2 shows the DSC thermograms curves for the neat PET and PET/o-Mt nanocomposites containing 5wt% of the o-Mt. The DSC thermograms showed a similar trend for the nanocomposites containing 1 and 3 wt% of o-Mt. Nevertheless, there were small changes in the peak intensity and location. For that reason, the DSC thermograms for the nanocomposites containing 1 and 3 wt% of o-Mt were not
showed in this section.
The DSC data for the neat PET and PET/o-Mt nanocomposites are shown in Table 1.
PET/o-Mt nanocomposites showed a decrease in the glass transition temperature (Tg) compared to the neat
PET. The systems with the compatibilizer showed a more signiicant reduction due, probably, to the fact that the Tg of the compatibilizer was lower than that of PET matrix (Table 1). The nanocomposites also showed a decrease in the cold crystallization peaks (Tcc). Some systems showed
slight variations in the melt temperature (Tm1 and Tm2). All
the nanocomposites showed an increase in the crystallization
temperature (Tc) when compared to the neat PET. This behavior is more evident for the nanocomposites with a compatibilizer/organoclay ratio of 1/1 (Table 1, Figure 2 b). The fact that both the values of Tm and the shape of the melting peak of the PET/o-Mt nanocomposites remained almost unchanged compared to those of neat PET indicates that the organoclay did not afect the perfection and size of the crystals in the polymer matrix30. On the other hand, it had a nucleating efect, as observed by the increase of Tc for all nanocomposites. A gradual increase in the relative crystallinity (Xc), compared to neat PET, could also be seen. Xc1 values were used as the crystallinity degree to calculate
nanocomposites and neat PET barrier properties because the ilms used at permeation and sorption measurements were
not annealed prior to test.
3.3. Barrier properties
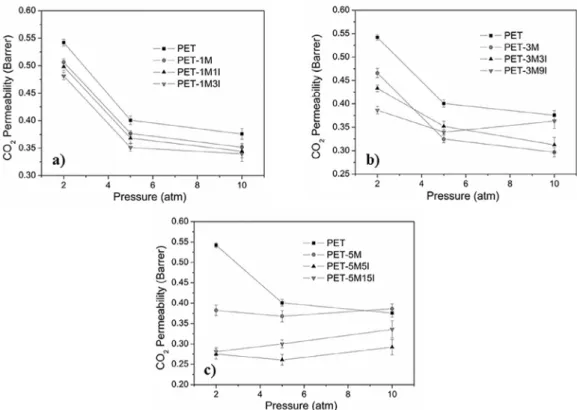
Figures 3 (a), (b) and (c) show the CO2 gas permeability
of PET nanocomposites. The CO2 gas permeability of
PET/o-Mt nanocomposites was much smaller than that of neat PET. For samples with 3 wt% of organoclay the permeability decreased gradually with a maximum reduction of 30% at 2 atm while for samples with 5 wt% of organoclay the maximum reduction was about 50%. The organoclay incorporation itself
Figure 2. DSC thermograms for the PET and PET/o-Mt nanocomposites containing 5 wt% of organoclay. (a) 1st heating,
(b) cooling and (c) 2nd heating.
Figure 3. Efect of the compatibilizer concentration on the CO2 gas permeability of the PET nanocomposites. (a) 1wt%, (b)
led to reduction in permeability. Moreover, this reduction
was more observable in samples where the organoclay was
better dispersed (intercalation and/or exfoliation), i.e. in the compatibilized samples as revealed by TEM analyses.
The nanocomposites are multiphase systems that present complex transport properties due to the co-existence of phases having diferent permeability, spatial arrangements and interactions with the polymer matrix. The dispersed phase (silicate) can be considered as being impermeable. The polymeric phase (biphasic system amorphous/crystalline) can be considered as being permeable (amorphous phase)
and impermeable (crystalline regions)28.
For the nanocomposites described in this paper, many factors act simultaneously afecting the CO2 permeability.
The clay, as described previously, can be considered as an impermeable phase, reducing the overall PET permeability. Another efect brought by the clay addition is the increase in crystallinity (nucleating efect), as observed by DSC. The crystallites are also considered as impermeable regions and together with the clay layers help enhance the tortuous difusion path that the gas molecules have to go through during permeation, according to the Nielsen model31. Another factor to be considered is the permeability at the interfaces:
polymer/ionomer, polymer/clay, clay/ionomer and polymer/
clay/ionomer that are diferent from that of the pristine PET matrix. Therefore all the above considerations should be taken into account in the analysis of the permeability values obtained.
It is interesting to notice that the nanocomposites
containing higher amounts of compatibilizer (3M9I, PET-5M5I and PET-5M15I) showed an increase in permeability at higher CO2 pressures (Figure 3). This behavior is an
indication of polymer matrix plasticization. On the other hand, plasticization was not observed in the neat PET and
in the others nanocomposites. In these samples a decrease
in permeability with the increase in the CO2 pressure was
observed. This behavior can be associated to the hydrostatic compression of the polymer matrix by the high permeant pressure or due to saturation of the polymer matrix. The plateau observed for the permeability values obtained at higher CO2 pressure corroborates to these ideas, for the
samples where no plasticization phenomenon was observed28.
As observed, the nanocomposites containing 5 wt% of organoclay exhibited better barrier properties, i.e., more signiicant reduction in CO2 permeability, compared with those
containing less organoclay. Therefore, the nanocomposites containing 5 wt% of o-Mt were chosen for the CO2 sorption
study. Figure 4 shows CO2 sorption isotherms at 35ºC.
The sorption isotherms show a similar behavior up to
10 atm., i.e. the penetrant concentration increased linearly
with its partial pressure, typical of a Henry’s law sorption behavior. At higher CO2 pressures, there was a change in
behavior for neat PET and PET-5M15I. Those samples showed a larger improvement in the equilibrium concentration at
higher pressures, indicating that the polymer matrix could have been plasticized by the penetrant (CO2).
This efect can be related to the interaction (solubility) between the gas and the polymer matrix. The CO2 gas shows
high condensability in the polymer matrix and consequently high solubility due to its low critical temperature (31ºC), making plasticization possible28. Besides that, at higher gas
pressures, the enhanced local concentration of CO2 could
have resulted in an increase of the matrix free volume facilitating the mobility of polymer chains, leading to a further increase in the CO2 solubility, namely, plasticization. It is
important to point out that the samples containing 0 and 5% of compatibilizer did not present any sign of plasticization indicating that the o-Mt dispersion efect to add diiculties
to the permeation process prevailed.
The solubility coeicient (S) of the penetrant in the neat PET and its nanocomposites containing 5 wt% of the organoclay at 2, 5, 10 and 15 atm pressures and 35ºC were calculated by equation 9 considering the equilibrium concentration (Ceq) of the permeant as a function of the
partial pressure (p). The results are presented in Table 2:
Figure 4. CO2 sorption isotherms at 35°C for the neat PET and its
nanocomposites containing 5 wt% of the organoclay.
(
)/
(
Henry s law
’
)
( )
S
=
d C
eqdp
9
Table 2 shows a slight diference in the value of the CO2
solubility coeicient among the samples in the pressure range studied. Many factors can contribute to the changes in the CO2 solubility of the PET/o-Mt nanocomposites. For
(at equilibrium concentration) as observed by Galvani and
Pessan32. On the other hand, the polar groups contribute to
the better dispersion of the organoclay (intercalation and/ or partial exfoliation), as revealed by TEM, increasing the impermeable regions in the polymer matrix and so reducing the local concentration of sorbed gas.
The presence of PETi at lower amounts (up to 5%) provides higher sorption values than those of neat PET and those of PET-5M. It is probably due to its high polarity that enables a better interaction between polymeric matrix and permeant. But when used in excess (more than 5%) the efect is the opposite. This behavior can be explained by the Restricted Mobility Model proposed by Eisenberg33. According to this model ionomers presents small amounts of ionic aggregates deined as “multiplets” dispersed at the polymeric matrix. Those aggregates are formed due to the electrostatic forces associated to their ionic portions and have restrict mobility around its center.
Increasing the amount of PETi in the composite increases its relative ionic portion. This fact raises the chances to the aggregates to be formed and consequently lowers the amount of ions available to interact with the permeant molecules, leading to lower sorption values that cannot be sustained when high pressures of penetrants are used.
Table 3 shows the apparent difusion coeicient values (D) calculated from the solubility coeicient (S) and permeability (P) experimental values (equation 1) for the nanocomposites containing 5 wt% of organoclay at diferent
compatibilizer concentration.
when the organoclay was incorporated in the PET. This is consistent with the literature3,10,34. The presence of the polyester ionomer compatibilizer ampliies this efect due to better o-Mt intercalation and/or exfoliation, as demonstrated by WAXS, TEM and rheological analyses21. This efect, in
addition to the increase of PET crystallinity (impermeable phase) induced by organoclay, resulted in a decrease in the apparent difusion coeicient (Table 3) and led to a decrease in permeability (Figure 3).
Table 4 summarizes the values of the CO2 permeability
for the PET/o-Mt nanocomposites at diferent upstream pressures, calculated from equation 6.
Table 2. CO2 solubility coeicient (S) values for the neat PET and PET nanocomposites with 5 wt% of the organoclay at 35ºC.
Sample S (cm2atm3/cm3.atm) S (cm5atm3/cm3.atm) S (cm10atm3/cm3.atm) S (cm15atm3/cm3.atm)
PET 1.07 1.03 1.02 1.83
PET-5M 1.09 0.89 0.83 0.81
PET-5M5I 1.15 1.08 1.06 1.05
PET-5M15I 0.81 0.81 0.80 1.50
Table 3. Values of CO2 solubility coeicient (S), permeability (P) and
difusion coeicient (D) of the PET/o-Mt nanocomposites at 2 atm. Sample S (cm3/cm3.atm) P (Barrer) D (10-10 cm2/s)
PET 1.07 0.54 38.5
PET-5M 1.09 0.38 26.6
PET-5M 5I 1.15 0.27 18.2
PET-5M 15I 0.81 0.28 26.4
According to Table 3, the solubility coeicient (S) of the nanocomposites containing 5wt% of the organoclay was slightly diferent than that of neat PET. Therefore, the nanocomposites decrease in CO2 permeability could
be attributed to this slight diference and most importantly to a signiicant decrease in the difusion path of the CO2
Table 4. CO2 permeability of PET and PET/o-Mt nanocomposites
at diferent upstream pressures.
Sample PermeabilityCO2 (2 atm)
CO2
Permeability (5 atm)
CO2
Permeability (10 atm)
PET 0.542 ± 0.006 0.401 ± 0.008 0.376 ± 0.010
PET-1M 0.506 ± 0.006 0.377 ± 0.005 0.352 ± 0.007
PET-1M1I 0.498 ± 0.007 0.368 ± 0.009 0.344 ± 0.012
PET-1M3I 0.481 ± 0.007 0.351 ± 0.007 0.340 ± 0.0014
PET-3M 0.466 ± 0.010 0.325 ± 0.008 0.297 ± 0.010
PET-3M3I 0.433 ± 0.007 0.352 ± 0.011 0.312 ± 0.016
PET-3M9I 0.387 ± 0.008 0.340 ± 0.005 0.363 ± 0.016
PET-5M 0.382 ± 0.013 0.368 ± 0.014 0.386 ± 0.012
PET-5M5I 0.275 ± 0.012 0.261 ± 0.013 0.292 ± 0.019
PET-5M15I 0.281 ± 0.010 0.300 ± 0.010 0.336 ± 0.021
Overall, the nanocomposites showed significant reduction in CO2 permeability when compared to the neat
PET. This reduction mainly resulted from four factors: the intercalation/exfoliation of the organoclay (physical barrier), the matrix solubility changes as a result of the presence of the compatibilizer (permeant solubility in the matrix), the hydrostatic compression of the polymer matrix by the high pressure of the permeant and polymer matrix crystallinity.
The factors mentioned above that inluence the CO2
permeability of the nanocomposites also inluence their water vapor permeability. Moreover, for the water vapor permeability there is a trade-of between the apparent difusion coeicient (D) and solubility (S). On the one hand, the presence of the PET ionomer compatibilizer decreases D due to better organoclay dispersion (intercalation and/ or partial exfoliation). On the other hand, S is increased because water is very soluble in the compatibilizer. Both efects dictate the overall permeability of water vapor in the PET/o-Mt nanocomposites.
4. Conclusions
This work was aimed at studying the inluence of using a modiied montmorillonite on the barrier properties of PET nanocomposites using a polyester ionomer (PETi) as compatibilizer. Overall, for the nanocomposites studied in this paper, the incorporation of the organoclay increases the difusional path of penetrant (CO2, water vapor) leading to
permeability reduction.
The compatibilizer (PETi) improves the organoclay dispersion and so reduces the CO2 permeability. On the
other hand, at higher concentrations, the PETi increases the solubility of the penetrant in the polymer matrix due to its polar groups and consequently increases the permeability compared to the results obtained for lower pressures of CO2. At low CO2 pressures the organoclay dispersion is the
major factor that afects permeability. Besides that, at higher pressures, the penetrant’s solubility takes an important role in permeability. The incorporation of the compatibilizer to the PET/o-Mt system led to a decrease of up to 49% in CO2
permeability (for the sample PET5M5I).
The water vapor permeability in the nanocomposites was also reduced compared to that of the neat PET. The highest diminution was about 28% and was obtained for the samples PET5M and PET5M5I. A further increase in
the compatibilizer/o-Mt ratio resulted in an increase in water vapor permeability, due probably to the solubility of water in the compatibilizer. The PET/o-Mt nanocomposite containing 5 wt% organoclay and 5 wt% compatibilizer showed the most signiicant reduction both in CO2 and water
vapor permeability.
The results indicate that the permeation mechanism is, as well known, highly inluenced by the matrix/penetrant pair but also that the penetrant pressure can invert the importance of isolated contribution of sorption/difusion process even when the system studied is submitted to the incorporation of a physical barrier for the penetrants, as is the case of the o-Mt.
5. Acknowledgements
The authors would like to thank CAPES for the inancial support, Mr. J-M Hiver for WAXS measurements, Dr. N.M. Larocca for TEM analyses, PPG-CEM/UFSCar, DEMa/ UFSCar and LRGP/ENSIC for research facilities.
6. References
1. Zanetti M, Lomakin S, Camino G. Polymer layered silicate
nanocomposites. Macromolecular Materials and Engineering.
2000;279(1):1-9.
2. Ray SS, Okamoto M. Polymer/layered silicate nanocomposites: a review from preparation to processing. Progress in Polymer Science. 2003;28(11):1539-1641.
3. Picard E, Espuche E, Fulchiron R. Efect of an organo-modiied montmorillonite on PLA crystallization and gas barrier properties.
Applied Clay Science. 2011;53(1):58-65.
4. Ghanbari A, Heuzey MC, Carreau PJ, Ton-That MT. Morphology and properties of polymer/organoclay nanocomposites based on poly(ethylene terephthalate) and sulfopolyester blends.
Polymer International. 2013;62(3):439-448.
5. Seethamraju S, Ramamurthy PC, Madras G. Performance of an ionomer blend-nanocomposite as an efective gas barrier material for organic devices. RSC Advances. 2014;4(22):11176-11187.
6. Shah RK, Krishnaswamy RK, Takahashi S, Paul DR. Blown ilms of nanocomposites prepared from low density polyethylene and a sodium ionomer of poly(ethylene-co-methacrylic acid).
Polymer. 2006;47(17):6187-6201.
7. Hu GH, Hoppe S, Feng LF, Fonteix C. Nano-scale phenomena
and applications in polymer processing. Chemical Engineering Science. 2007;62(13):3528-3537.
8. Vermogen A, Masenelli-Varlot K, Séguéla R, Duchet-Rumeau J, Boucard S, Prele P. Evaluation of the Structure and Dispersion in Polymer-Layered Silicate Nanocomposites. Macromolecules.
2005;38(23):9661-9669.
9. Issaadi K, Habi A, Grohens Y, Pillin I. Efect of the montmorillonite intercalant and anhydride maleic grafting on polylactic acid structure and properties. Applied Clay Science. 2015;107:62-69.
Table 5. Water vapor permeability (WVP) of the PET/o-Mt
nanocomposites.
Sample Water vapor permeability WVP
(10-10 (g/Pa.s.m)) Reduction (%)
PET 2.77 ± 0.03
-PET-1M 2.59 ± 0.02 6.5
PET-1M 1I 2.57 ± 0.03 7.2
PET-1M 3I 2.54 ± 0.04 8.3
PET-3M 2.38 ± 0.03 14.1
PET-3M 3I 2.35 ± 0.04 15.2
PET-3M 9I 2.44 ± 0.05 11.9
PET-5M 2.01 ± 0.02 27.4
PET-5M 5I 1.98 ± 0.06 28.5
10. Alexandre M, Dubois P. Polymer layered-silicate nanocomposites: preparation, properties and uses of a new class of materials.
Materials Science and Engineering: R: Reports.
2000;28(1-2):1-63.
11. Cho JW, Paul DR. Nylon 6 nanocomposites by melt compounding.
Polymer. 2001;42(3):1083-1094.
12. Vaia RA, Jandt KD, Kramer EJ, Giannelis EP. Kinetics of Polymer
Melt Intercalation. Macromolecules. 1995;28(24):8080-8085.
13. Dennis HR, Hunter DL, Chang D, Kim S, White JL, Cho JW, et al. Efect of melt processing conditions on the extent of exfoliation in organoclay-based nanocomposites. Polymer.
2001;42(23):9513-9522.
14. Fornes TD, Yoon PJ, Hunter DL, Keskkula H, Paul DR. Efect of organoclay structure on nylon 6 nanocomposite morphology
and properties. Polymer. 2002;43(22):5915-5933.
15. Frounchi M, Dourbash A. Oxygen Barrier Properties of Poly(ethylene terephthalate) Nanocomposite Films. Macromolecular Materials and Engineering. 2009;294(1):68-74.
16. Tsai TY, Lin MJ, Chuang YC, Chou PC. Efects of modiied Clay on the morphology and thermal stability of PMMA/
clay nanocomposites. Materials Chemistry and Physics.
2013;138(1):230-237.
17. Barber GD, Calhoun BH, Moore RB. Poly(ethylene terephthalate) ionomer based clay nanocomposites produced via melt extrusion.
Polymer. 2005;46(17):6706-6714.
18. Ammala A, Bell C, Dean K. Poly(ethylene terephthalate) clay nanocomposites: Improved dispersion based on an aqueous
ionomer. Composites Science and Technology.
2008;68(6):1328-1337.
19. Chinellato AC, Vidotti SE, Hu GH, Pessan LA. An acrylic acid modiied polypropylene as a compatibilizing agent for the intercalation/exfoliation of an organically modiied
montmorillonite in polypropylene. Journal of Polymer Science Part B: Polymer Physics. 2008;46(17):1811-1819.
20. Dini M, Mousavand T, Carreau PJ, Kamal MR, Ton-That MT. Microstructure and properties of poly(ethylene terephthalate)/ organoclay nanocomposites prepared by water-assisted extrusion: Efect of organoclay concentration. Polymer Engineering & Science. 2014;54(8):1879-1892.
21. Vidotti SE, Chinellato AC, Hu GH, Pessan LA. Preparation of poly(ethylene terephthalate)/organoclay nanocomposites using
a polyester ionomer as a compatibilizer. Journal of Polymer Science Part B: Polymer Physics. 2007;45(22):3084-3091.
22. Comyn J. Polymer Permeability. Dordrecht: Springer Netherlands;
1985.
23. Picard E, Vermogen A, Gérard JF, Espuche E. Barrier properties of nylon 6-montmorillonite nanocomposite membranes prepared by melt blending: Inluence of the clay content and dispersion
state: Consequences on modelling. Journal of Membrane Science. 2007;292(1-2):133-144.
24. Choudalakis G, Gotsis AD. Permeability of polymer/clay
nanocomposites: A review. European Polymer Journal.
2009;45(4):967-984.
25. Koros WJ, Hellums MW. Transport properties. In: Encyclopedia of polymer science and engineering. New York: John Wiley &
Sons; 1989. p. 724-802.
26. Wunderlich B. Thermal Analysis of Polymeric Materials. Berlin/
Heidelberg: Springer-Verlag; 2005.
27. Koros WJ, Paul DR, Rocha AA. Carbon dioxide sorption and
transport in polycarbonate. Journal of Polymer Science Part B: Polymer Physics. 1976;14(4):687-702.
28. Chinellato AC, Vidotti SE, Hu GH, Pessan LA. Compatibilizing efect of acrylic acid modiied polypropylene on the morphology and permeability properties of polypropylene/organoclay
nanocomposites. Composites Science and Technology.
2010;70(3):458-465.
29. ASTM International. ASTM E96/E96M - 10 Standard test Methods for Water Vapor Transmission of Materials; West
Conshohocken: ASTM International; 2010. p. 1-12. 30. Vidotti SE, Chinellato AC, Boesel LF, Pessan LA. Poly(Ethylene
Terephthalate)-Organoclay Nanocomposites: Morphological, Thermal and Barrier Properties. Journal of Metastable and Nanocrystalline Materials. 2004;22:57-64.
31. Nielsen LE. Models for the Permeability of Filled Polymer Systems. Journal of Macromolecular Science: Part A - Chemistry.
1967;1(5):929-942.
32. Galvani F, Pessan LA. Efects of Addition of a Polyester Ionomers in the Structure and Crystallinity of Poly(ethylene terephthalate) (PET). In: 7o Congresso Brasileiro de Polímeros; 2003 Nov 9-13; Belo Horizonte, MG, Brazil.
33. Eisenberg A. Ionic forces in polymers. In: Fortschritte der Hochpolymeren-Forschung. Berlin/Heidelberg: Springer-Verlag;
1967. p.59-112.