Evaluation of a method based on image analysis to
obtain shape parameters in crushed sand grains
Avaliação de um método baseado em análise de
imagens para obtenção de parâmetros de forma
em grãos de areia de britagem
a Faculdade de Engenharia e Arquitetura, Universidade de Passo Fundo, Passo Fundo, RS, Brasil.
Received: 20 Oct 2014 • Accepted: 28 May 2015 • Available Online: 13 Oct 2015
Abstract
Resumo
The objective of this paper is to evaluate a method based on image analysis to obtain shape parameters in crushed sand grains. There is no consensus about standards and rules for testing aggregates, the lack of methodology to prepare and conduct tests may produce incorrect results, which do not satisfactorily represent the aggregate characteristics. One way to perform these analyzes is the use of images obtained with mag-nifying glasses or similar equipment. To contribute to this, three experiments were prepared with samples of crushed sand from the city of Passo Fundo. The ixed and evaluated parameters were: samples preparation, zoom used for image acquisition and number of grains representative of the shape parameters. The results were statistically analyzed and signiicant diferences were obtained to the shape factor regarding the ixed pa-rameters, except for the number of grains needed to characterize it, which difers from the currently literature used by academic studies. According to this work it is possible to realize that it is necessary to standardize the tests for shape analysis to eliminate errors generated by the interpretation of incorrect results, which may have been generated by changes in the methodology for conducting the tests.
Keywords: crushed sand, crushed sand grain shape, image analysis.
Esse trabalho avalia um método de análise de imagens para obtenção de parâmetros de forma em grãos de areia. Avaliando-se os ensaios utilizados em trabalhos cientíicos, pode-se considerar a não existência de um consenso nos parâmetros utilizados para avaliação da forma dos grãos de agregados miúdos, ressalta-se que a falta de metodologia deinida para a realização dos ensaios pode gerar resultados equivocados, que não representem satisfatoriamente as características dos agregados. Uma das maneiras de realizar essas análises trata-se da utilização de análise de imagens obtidas a partir do uso de lupas ou equipamentos semelhantes. Para contribuir nesse sentido, foram preparados três experimentos, com amostras de areia de britagem da cidade de Passo Fundo. Os parâmetros ixados foram a preparação das amostras, os au-mentos utilizados para aquisição das imagens e o número de grãos representativos dos parâmetros de forma. Os resultados dos experiau-mentos elucidaram a necessidade de estudos mais aprofundados a respeito da padronização do ensaio. E comprovaram a necessidade da padroniza-ção dos ensaios para análises de forma em agregados miúdos. Os dados obtidos foram analisados estatisticamente e obtiveram-se diferenças signiicativas para o fator de forma em relação aos parâmetros ixados, exceto em relação ao número de grãos necessários para caracterizá-lo, o que difere da bibliograia atualmente utilizada por trabalhos acadêmicos. Com o presente trabalho pode-se perceber que existe a necessidade de padronizar os ensaios para análises de forma, de modo a eliminar erros gerados pela interpretação de resultados equivocados, que podem ter sido gerados por pequenas variações na metodologia utilizada para a realização dos ensaios.
Palavras-chave: areia de britagem, forma dos grãos de areia de britagem, análise de imagens.
A. G. GOLDONI a
L. M. PANDOLFO a
A. P. GOMES a [email protected]
D. FOLLE a [email protected]
M. S. MARTINS a [email protected]
A. PANDOLFO a
1. Introduction
Many studies have concluded that the aggregates used in con-cretes and mortars are not just inert materials. Among the vari-ous functions performed by them there are illing voids, contrib-uting to a continuous grading curve of solids, restricting plastic shrinkage, etc.; there is a consensus that these aggregates are responsible for several of these properties, whether they are in fresh or hardened state. These materials are present in sig-niicant proportions in concretes and mortars – in the latter they can correspond to up to 80% of the total mass of the mixture (CINCOTTO, CARNEIRO [1]).
Compared with the aggregate obtained with crushing processes, natural sand has always been the main minute aggregate used for manufacturing mortars and concretes. According to some authors, such as Mehta and Monteiro [2] this preference for natural sand comes from its grains, which are rounder, and from its low content of powder material. This low content of ine material decreases the mixture consumption of water, improving some of the key proper-ties of concrets, such as mechanical and cracking resistance. The fact that the uncontrolled exploitation of natural sand in quar-ries and rivers is an activity that caused environmental degrada-tion in many regions generates the need to search for alternative materials. Crushed sand has for years showed itself as a solution to the problem of exponential increases in transportation costs of natural sand, a material which is increasingly diicult to obtain in large centers.
For years, several authors have studied the properties of natural sand and its inluence in concrets and mortars. For crushed sand, the studies are more recent. Among the properties of sand there are granulometric and morphologic characteristics, surface tex-ture, and others derived from these, such as the compactness and the swelling coeicient. The main properties addressed in these papers are the granulometric composition and the compactness, and generally little relevance is given to the grain shape, since traditional studies do not normally carry out characterization tests for shape and texture. There is a consensus in literature that the grains from aggregates generated by crushing feature shape and surface texture diferent from those of aggregates from natural ori-gin. With the use of crushed sand, the study of shape and texture of large aggregates becomes more important to allow sorting, ob-serving the changes and identifying the inluence of form in the properties of materials produced with it.
The main factors which inluence the grain shape of an aggregate are its original rock and the process of fragmentation the mate-rial went through. In relation to the crushing process, several com-panies employ advanced technological crushers, and processes that improve the shape of the grains, to obtain aggregates with better quality and performance. Moreover, it can be airmed that, frequently, the crushed sand angular form is a justiication for its bad performance in relation to the consumption of cement and wa-ter. With precise tools and in-depth studies of its inluence, it is believed to be possible to deine the real importance of the form in the performance of concrete and mortars.
Normally, the evaluation of the aggregates is centered in the fea-tures of granulometry and ineness; this, according to Chaves [3] and Silva [4], is considered one of the main limitations to gauging the real inluence of sand in mortars and concretes. The same au-thors also commented on the lack of simple and fast methods to
analyze the shape and to quantify the characteristics of the grains. Since there are no national standards for testing the characteriza-tion of form in minute aggregates, each author uses a diferent method for sample preparation, thus, possibly, not giving margin for signiicant results. It is still questioned whether these difer-ences regarding tests in works that study the form of minute ag-gregates generate diferences in results and, if so, if it is possible to compare these works.
Therefore, gaps, in methods for determining the shape, still ex-ist, justifying this work. Among the issues to be clariied for the understanding of aggregate grain shape are: if there is an efect regarding the type of sample preparation, which should be the in-creases used in image obtention and, especially, what would be the required number of grains to be used.
1.1 Objective
This study intends to analyze the results obtained in an analysis method of sand grain shape characterization, checking their vari-ability with image capture changes (augmentation), grain organiza-tion and grain number.
2. Methodology
2.1 Selection and preparation of sand
The sand which was used to obtain the images for this work was collected in the city of Passo Fundo, in Rio Grande do Sul, and it matches the type most widely used in the region. Among the sample preparation steps were: collecting, washing, drying in a heater, sample reducing and sand sifting in order to separate it into granulometric fractions.
The sand was washed in a 0.6 mm sieve, resulting in fractions used in this work, corresponding to 0.6 mm, 1.2 mm and 2.4 mm grains. Heater drying took place during 24 hours, and sample re-ducing was performed with a sample splitter, obtaining 10g of sand to the confection of each blade.
2.2 Deinition of the number of necessary grains
Equation 1 was used to calculate the number of grains:
(1)
2
Er
2
t
*
CV
2n
=
x2Where:
2
t
x2 = Signiicance value from the Student’s T table.CV
= Coeicient of variationEr
= relative error2.3 Grain preparation for image collection
seeking to put the larger grain dimension in the frame. The ran-domly arranged examined grains were released on a glass plate at a constant height of approximately 3 cm. The sand was then divided into the 3 fractions of sieves in regular series (2.4 mm 1.2 mm; 0.6 mm).
2.4 Obtention and analysis of images
This phase was preceded by the resolution selection and in-creases (zoom) appropriate for the analysis of images. The equipment used for this research was a magnifying glass of model XTL-101, with a zoom ranging between (0.7 and 4.5) times, direct and indirect lighting possibility and intensity ad-justment, in addition to a support for a digital camera, which processes the images in digital format for computer analysis. The next stage was to obtain the images with the magnifying glass and the LABView software. At the time of collection, mul-tiple conigurations were tested, such as brightness, contrast and saturation. The objective was to obtain a standardization of the process and to speciically eliminate some distortions on the grain edges, a recurrent problem in images obtained with a digital camera. The edges feature a diferent color from the rest of the grain, a fact that can cause them not to be processed by the image analysis program as the grain limit.
Similarly, another important adjustment required was the choice of the lighting to be used in the image collection: direct lighting, indirect lighting or both at the same time; it was also necessary to determine the intensity that would result in better deinition at the time of the capture.
The obtention of the images for calculating the parameters of grain shape in crushed sand was made under the conditions of ideal brightness, saturation, contrast and lighting.
Parameters of shape calculation were preceded by an image treatment and by using an image analysis program. The pro-gram, used in this work, was the Image J program found in the World Wide Web.
Image analysis procedure consists of the following steps: n Changing the format of the original image to 8 bits;
n Closing the edges of the open grains with a program command; n Filling the grains that will be measured with a determined color; n Painting the background with a diferent color;
n Obtaining a bicolor design, which serves as basis for the pro-gram to automatically attain values of area, perimeter and cross-sectional dimension of grains;
n Applying the equations 2, 3 and 5 to calculated form parameters.
(2)
max4
d
A
D
d
E
c c=
p
=
Where:
E: sphericity;
Dc=dmax: diameter of the smallest circle circumscribed in the grain,
which corresponds to the maximum diameter or Feret’s diameter, directly measured in grain projection (mm);
dc: diameter corresponding to the projection area of the grain,
cal-culated from the area of the circle (Acircle) using Equation (3):
(3)
4
)
(
2c círculo
d
A
=
p
×
\
p
A
d
c=
4
Where:
A: the projection area of the grain (mm2), measured directly on the
two-dimensional projection image of the grain.
(4)
( )
2max
4
d
A
Ar
p×
=
p
Where:Ar: rounding;
Ap: projection of grain area, measured directly on the image of
grain (mm2);
Ac: area of the circle circumscribed in the grain, calculated with
equation (5):
(5)
4
)
(
2 maxd
A
c=
p
×
Where:
dmax: maximum diameter or Feret’s diameter, also measured on the
projection of grain (mm2).
(6)
2
4
P
A
F
forma=
p
Where:
A: area of grain projection, measured directly on the image of grains (mm2);
P: perimeter of the projection of grain, measured directly on the image of grains (mm).
n To evaluate the inluence of sample preparation, images of the three fractions of sand were obtained: (2.4 - 1.2 - 0.6) mm, cap-tured in two arrangements, randomly positioned and oriented. The choice was related to the fact that it is diicult to orient the smaller fractions (0.3 mm, 0.15 mm and 0.075 mm);
n To assess the inluence of the zoom, the fraction 1.2 mm was chosen, for its possibility of being photographed with a larger number of increases without any harm to the visualization. In-creases of (0.7-1.5-3.0) times were used.
n To evaluate the number of grains, the 0.6 mm fraction was chosen; being the smallest fraction, it enabled to capture more grains per image and therefore resulted in fewer images, which perfected the work.
3. Presentation and examination
of the experimental results
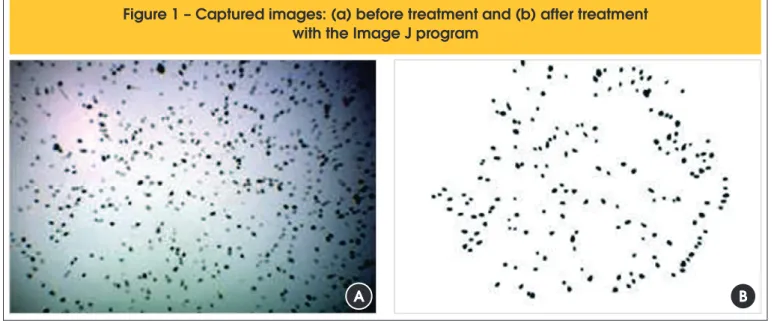
After the application of the image analysis method, the appear-ance of the observations can be seen in Figure 1, both before and after the treatment described in the method. The images with this coniguration permitted to obtain the results used in the statistical analysis.
3.1 Inluence of sample preparation
Figure 2 presents the images of the 0.6 mm fraction grains ran-domly distributed (a) and oriented (b). A small diference can be noted, which could be attributed to the fact that the oriented grains can be placed with their greatest dimension in the frame.
The average results of rounding, sphericity and form factor ob-tained for the three parameters studied are shown in table 1, as well as the standard deviation and coeicient of variation (CV). Evaluating the coeicient of variation presented in table 1, it is ob -served that the rounding is the parameter with the highest values. This can be related to the fact that the parameter takes into ac-count the square of the maximum observed diameter, thus any variation in measure generates a greater diference.
In variance analysis, the form factor was the only parameter to show signiicant diference between the oriented and random samples, as it can be observed in the value obtained with the F test in table 2. It is believed that the signiicant efect of sample preparation can be attributed to the perimeter of the grains, the only information that is not taken into account in the equations that determine rounding and sphericity. Thus, it can be airmed that the measure-ment of the perimeter is the main elemeasure-ment subjected to variability, for as previously stated there have been distortions at the edges that may not have been eliminated entirely, making it harder for the program to recognize the image captured by the camera.
3.2 Inluence of the applied increases
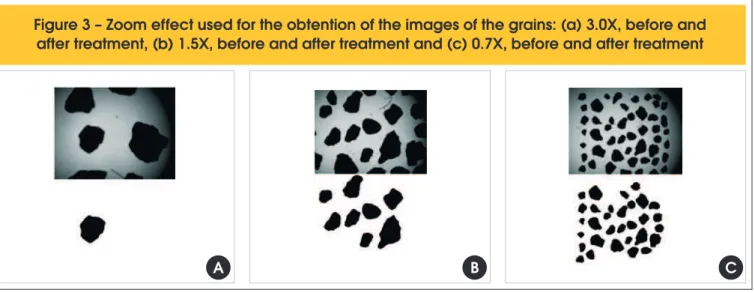
To evaluate the inluence of the increases (zoom) used to obtain the images of the grains, the 1.2 mm fraction was selected, since it presented the best framing with the chosen increases. The ad-opted increases were of (0.7-1.5-3.0) times. Figure 3 presents the pictures of the grains of chosen fraction captured with difer -ent increases.
The average results obtained for the three form factors calculated are shown in table 3.
The study initiated with the idea of working with a minimum of 30
A
B
A
B
Figure 1 – Captured images: (a) before treatment and (b) after treatment
with the Image J program
A
B
A
B
grains, but since some grains were not recognized by the program during the image treatment, the number of grains that could be used in the statistical analysis was limited to 18. The coeicient of varia-tion had higher values to those seen in the preparavaria-tion analysis, but similar values to those observed in the analysis of grain number, be-ing the roundbe-ing the value that presented most diferences.
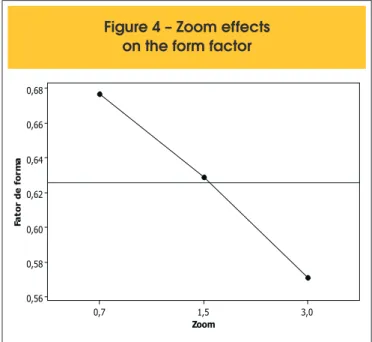
Observing table 4, it can be noticed that, once again, only in the form factor the zoom had a signiicant efect: the form factor de-creases as the zoom inde-creases, as shown in Figure 4.
This can be explained by the increase in the level of detail of the
grain contour with the highest zooms, increasing the value of the perimeter and, thus, reducing the value of the form factor. This does not occur for sphericity and rounding.
3.3 Inluence of the number of grains
Using Equation 1, as suggested by Bussab and Morettin [5], with a standard conidence level of 95%, a standard deviation of ap-proximately 0.1, and 0.01 precision, the representative number of 386 grains was obtained. This number approached the 400 grains
Table 1 – Forms factors calculated to evaluate the influence
of sample preparation - 30 grains
Fraction Grains Ar s CV
(%) E s
CV
(%) Ff s CV (%)
2.4 mm oriented 30 0.67 0.09 14 0.82 0.06 7 0.61 0.07 11
2.4 mm random 30 0.63 0.10 15 0.79 0.06 8 0.63 0.05 7
1.2 mm oriented 30 0.66 0.11 16 0.81 0.07 8 0.65 0.08 8
1.2 mm random 30 0.62 0.10 16 0.79 0.06 8 0.64 0.06 9
0.6 mm oriented 30 0.66 0.09 14 0.81 0.06 7 0.65 0.06 9
0.6 mm random 30 0.66 0.08 12 0.81 0.05 6 0.67 0.04 6
Ar: rounding (dimensionless); E: sphericity (dimensionless), Ff: form factor (dimensionless); s: standard deviation (dimensionless); CV: coefficient of variation (dimensionless).
Table 2 – Variance analysis for the form factor – influence of sample preparation
Treatments Degrees of
freedom
Sum of the squares
Average of the
squares F P
Significance level
Orientation 2 0.101058 0.050529 9.54 0.000 S
Error 51 0.270159 0.005297 – – –
Total 53 0.371216 – – – –
Factor F or Test F = square mean of treatment/square mean of error; P: Probability or Value-p: from Student’s distribution t.
Figure 3 – Zoom effect used for the obtention of the images of the grains: (a) 3.0X, before and
after treatment, (b) 1.5X, before and after treatment and (c) 0.7X, before and after treatment
used by Persson [6], Araújo [7] and Tristan [8] in their experiments for form analysis.
The calculation resulted in a relatively high number, which in prac-tice demands a lot of time to obtain the images. Considering a relative error of 0.02, the value would remain around 90 grains, a number that this study aimed to decrease. It was then decided to work with a reduced number of thirty grains to enable the analysis. To evaluate this and facilitate the analysis, reducing the demanded time, it was designed an experiment that evaluated the inluence of the number of grains analyzed in the calculated form parameters. To evaluate the inluence of the number of grains used, the 1.2 mm fraction was chosen, for it was the one which presented the best framings with the applied increases. The average results obtained for the three form factors calculated are shown in table 5.
Once more, the standard deviation and the coeicient of variation are greater for rounding, and have the same value for sphericity and the form factor.
The analysis of variance showed that the number of grains adopt-ed has no signiicant efect on any of the form parameters, which might be attributed to the tendency of population distribution nor-mality. The sampling seemed to well represent the population – the quartile dosage of the material appears to have helped, so that it became diicult not to generate a signiicant sample.
Table 3 – Form parameters calculated to evaluate the influence of different increases – 18 grains
Increase Grains Ar s CV (%) E S CV (%) Ff s CV (%)
0.7x 18 0.67 0.13 20% 0.82 0.09 11% 0.68 0.07 11%
1.5x 18 0.60 0.11 18% 0.77 0.07 9% 0.63 0.07 11%
3.0x 18 0.65 0.14 21% 0.80 0.09 11% 0.57 0.08 13%
Ar: rounding; E: sphericity, Ff: form factor; s: standard deviation; CV: coefficient of variation.
Table 4 – Analysis of variance for the form factor
Treatments Degrees of
freedom
Sum of the squares
Average of the
squares F P
Significance level
Fraction 2 0.101058 0.050529 9.54 0.000 S
Error 51 0.270159 0.005297 – – –
Total 53 0.371216 – – – –
Factor F or Test F = square mean of treatment/square mean of error; P: Probability or Value-p: from Student’s distribution t.
Table 5 – Form factors calculated for samples with different numbers of grains
Grains Ar s CV (%) E s CV (%) Ff s CV (%)
30 0.65 0.11 18% 0.80 0.07 9% 0.62 0.08 12%
60 0.63 0.11 17% 0.79 0.07 9% 0.60 0.07 12%
90 0.66 0.09 14% 0.81 0.06 10% 0.62 0.06 10%
Ar: rounding; E: sphericity, Ff: form factor; s: standard deviation; CV: coefficient of variation.
Figure 4 – Zoom effects
on the form factor
3,0 1,5
0,7 0,68
0,66
0,64
0,62
0,60
0,58
0,56
Zoom
Fa
to
r
de
fo
rm
4. Conclusions
It can be stated that the form analysis of minute aggregates re-quires standardization, so that its results might not be inluenced by the method of image obtention, especially regarding the in-creases adopted in the process.
In sample preparation and in augmentation choice, it can be ob-served that the form factor was the only afected parameter, and that the perimeter seems to inluence this atypical result. Depend-ing on the number of pixels that the edge of the grain presents, it is believed that the program reads inaccurate or even incorrect values, regardless of the number of grains.
In relation to the sample size, it can be noted that the number of around 400 grains cited by the studied authors can be decreased, since the form factors corresponding to 30, 60 and 90 grains showed no signiicant diference in their values.
Considering the measured parameters, the one which presented the most problems related to the image analysis method was the form factor – with variations in the sample preparation and the im-age ampliication, values that do not realistically represent the true characteristic of the sand being measured were obtained.
When it comes to pointing a parameter which is best for the anal-ysis, the rounding and sphericity, which are not afected by the method employed, are indicated.
It is suggested to extend the experiments to other sand fractions and to analyze all the results, therefore obtaining the interaction regarding all the factors involved in the analysis.
There is also the need of applied experiments to indicate what can be the indicated value of shape variation parameters for sand, con-crete and mortars.
5. References
[1] CINCOTTO, M. A.; SILVA, M. A. C.; CASCUDO, H. C. Ar-gamassas de revestimento: características, propriedades e métodos de ensaio. Boletim Técnico 68 do Instituto de Pes-quisas Tecnológicas, São Paulo, 1995.
[2] MEHTA, P.K.; MONTEIRO, P.J.M. Concreto: microestrutura, propriedades e materiais. São Paulo: Pini, 2008.
[3] CHAVES, A. P. Estado da arte da produção de areia de brita-gem. In: SUFFIB - SEMINÁRIO: O USO DA FRAÇÃO FINA DE BRITAGEM, 2, 2005, São Paulo. Anais... São Paulo: [s.n.], 2005. [4] SILVA, N. G. Argamassa de revestimento de cimento, cal e
areia britada de rocha calcária. 2006. Dissertação (Mestrado em Engenharia/Construção Civil) - Universidade Federal do Paraná, Curitiba, 2006.
[5] BUSSAB, W.; MORETTIN, P.A. Estatística Básica. Editora Atual. São Paulo, 1993.
[6] PERSSON. Anna-Lena. Image analysis of shape and size of ine aggregates. Engineering Geology, Elsevier Science Ltd, v.50, 1998.
[7] ARAÚJO, G. S. Estudo dos parâmetros texturais das are-ias para argamassas de revestimento através da análise de imagens. 2001. Dissertação (Mestrado em Engenharia Civil)- Universidade Federal do Espírito Santo, Vitória, 2001. [8] TRISTÃO, F. A. Inluência dos parâmetros texturais das