scenarios. This procedure leads to a highly combinatorial analysis, especially when dealing with a high number of components under complex systems. Consequently, there is a lack of understanding about how different magnitudes of failure probabilities affect the system reliability.
The present work addresses this problem by iden-tifying mathematical patterns presented by simple structures (series and parallel systems). Equations for reliability estimation are first developed for a small number of components and thereafter expanded to systems with a larger number of components. The effect of different open and short failure probabilities over the reliability profiles is then discussed as the number of components is increased. In addition, this study presents a nonlinear optimization programming model aimed at allocating non-identical components in scenarios facing budget constraints and limited number of components.
The remaining of this paper is organized as follows. Section 2 gives a basic description of reliability litera-ture focused on three-state component systems, while Section 3 presents the proposed approach. Section 4 depicts the numerical examples, followed by a brief conclusion in Section 5.
1
Introduction
Reliability is part of everyone’s life, but when some component fails then its role is felt the most. These failures can either happen in situations that do not result in serious problems (when a TV set fails) or in scenarios where a failure leads to severe results, as for instance airplane accidents or bridge collapses. In order to better understand how these failures take place and to prevent such occurrences, several reliabi-lity studies have been performed in different areas to project, develop and maintain components to perform satisfactorily during a defined period of time. Among these reliability issues, the one known as Multi-state System Reliability has received considerable attention. Multi-state systems consist of units that present one working state and two or more failed states with diffe-rent failure modes. In the case of two failure modes (called three-state system), these are usually defined as open and short modes.
Systems composed of three-state components with identical probabilities of failure can be easily analyzed in terms of reliability and optimization. However, this is not the case for three-state systems with different proba-bilities of open and short failure modes; these require the description of all of the system’s possible failure
Michel José Anzanello
Abstract
Reliability evaluation of systems composed of non-identical multi-state compo-nents is a challenging task due to the highly combinatorial nature of the problem. The outcome is a lack of understanding regarding the reliability behavior of a system when components with different magnitudes of failure probabilities are considered, especially when extra components are added. The present work addresses this prob-lem by presenting a simplified approach to analyze variations on reliability profiles of series and parallel systems composed of non-identical three-state components. In addition, this work presents an optimization model for allocation of non-identical components under financial and physical restrictions. The model performed satis-factorily in terms of robustness when different magnitudes of failure probabilities were tested.
Keywords: Non-identical components. Multi-state systems. Component allocation.
allocation in three-state series and parallel systems
state systems can be found in Levitin (2007), Levitin and Amari (2008), and Hausken and Levitin (2009).
The second major area of work has to do with the opti-mization problem. Optiopti-mization procedures become vital in scenarios where a required reliability level has to be achieved under certain constraints, usually related to cost or physical issues. The optimization of series-parallel systems of identical components was studied by Page and Perry (1988) through the development of an open-mode reliability polynomial, which tests several alternative confi-gurations for equivalence and identifies the best structure to be adopted. However, such approach is not applicable to systems composed of non-identical components.
Levitin and Lisnianski (2001) proposed a method to optimize multi-state systems based on the combination of a universal generating function (UGF) and a genetic algorithm (GA). This methodology intends to efficiently estimate the reliability of series-parallel systems with different failure probabilities and can be used in several types of optimization related problems (e.g., structure optimization, optimal expansion of an existing system and maintenance optimization). Also using GA techniques, Levitin (2002a) has suggested an algorithm to identify the optimal structure of systems composed of different open and short failure probability devices; the approach followed a series-parallel configuration. In addition, an optimization heuristic for maximizing the reliability of multi-state weighted voting systems based on a defined number of components with known reliability properties was suggested in Ramirez-Marquez (2008).
Focused on systems where the use of redundancy is required, Levetin et al. (1998) proposed an optimization approach based on the integration of UGF and GA; the first tool provides a fast multi-state system reliability assessment, while the second one is used as an optimiza-tion tool. The redundancy in multi-state systems, however, does not strictly follow the traditional rule of adding several components in parallel until the desired level of reliability is obtained. In fact, there is an ideal number of redundant components that leads to maximum reliability, and the addition of extra units is worthless. Expressions for estimating the ideal number of identical redundant components for different structures can be obtained in Elsayed (2006). An interesting heuristic for redundancy allocation of multi-state components under a series-pa-rallel structure was also proposed by Ramirez-Marquez and Coit (2004b), while Tian et al. (2008) presented an optimization model for a series-parallel system to simul-taneously obtain the best component state distribution and best redundancy for each stage.
Multi-state structures following the k-out-of-r-from-n: F configurations were analyzed by Levitin (2002b; 2003) using a “sliding-window” approach, as follows: consider n
ordered multi-state elements with different failure modes and with a performance rate associated to each mode. The system fails if the sum of rates of consecutive elements is lower than a threshold. The sliding-window scans the
2
Three-state systems
Reliability is usually defined as the probability that a system, product or component will perform its designed function during a certain period of time, when opera-ting under specified environmental conditions. A vast literature focused on reliability concepts and estima-tion (KAPUR; LAMBERSON, 1977; O’CONNOR, 1985; CHING et al., 2005; ELSAYED, 2006; VIERTL, 2008; NEIL et al., 2008), optimization, allocation and redundancy (COIT; SMITH, 1995; MAJETY et al., 1999; KUO, 2000; ELEGBEDE; CHU, 2003; RAMIREZ - MARQUEZ et al., 2004a, 2008, AZAIEZ; BIER, 2007; LIANG et al., 2008) has emerged in recent years. Intense effort has also been devoted to the multi-state problem (LISNIANSKI; LEVITIN, 2003; ROCCO; MUSELLI, 2005; RAMIREZ-MARQUEZ; COIT, 2004b, 2005; RAMIREZ-MARQUEZ et al., 2006a, 2006b; TIAN et al., 2008; RAMIREZ- MARQUEZ; LEVITIN, 2008).
A multi-state device presents a normal functioning state and two or more failure states. Devices with two failure modes are defined as three-state components, and these are usually referred to as open and short modes. This terminology originates from electrical circuits, typi-cally represented by diodes and rheostats. A diode allows the current flow in only one direction, blocking it from coming back in an opposite direction. Such a device can operate properly, or fail by blocking the current in the forward direction, or fail by permitting the current to backward (PAGE; PERRY, 1988; ELSAYED, 2006).
Reliability evaluation of three-state component systems is conceptually more complex than that of systems with bina-ry-state components, even when considering identical units. Major efforts performed in this field seem to be focused on (i) the development of methods to evaluate the reliability of systems composed of identical and non-identical compo-nents, and (ii) on the optimization of a system reliability subjected to structural constraints (LEVITIN; LISNIANSKI, 2001; RAMIREZ-MARQUEZ; LEVITIN, 2008).
multi-Similarly, Equation 4 depicts the reliability expression for a system consisting of four components in series.
4 1 2 3 4 1 2 3 4
1 2 1 3 1 4 2 3 2 4
3 4 1 2 3 1 2 4 1 3 4
2 3 4 1 2 3 4
1 o o o o s s s s
o o o o o o o o o o
o o o o o o o o o o o
o o o o o o o
R q q q q q q q q
q q q q q q q q q q
q q q q q q q q q q q
q q q q q q q
= − − − − − +
+ + + + +
− − − −
+
(4)
By comparing Equations 2, 3 and 4, we infer that each additional component affects the reliability expression in two ways: (i) by adding one last row describing the open failure of all n components; and (ii) by increasing the number of combinations in each previous row according
to n
m
, where n is the number of total components and m is the number of failed components in each row, from 1 to n. Note that the reliability equation presents a single term describing the short failure mode, indicating that the system can only fail in such mode if all n components fail. For convenience, this term is presented in the first line of the reliability equation.
The set of equations for a parallel system can be simi-larly developed, switching the positions of qioand qisin the equations above.
3.2 Expansion of small structures into larger structures
A simple approach here is to construct sequential sprea-dsheet tables and perform the combinations of component failure probabilities. Therefore, we follow the pattern exem-plified in Equations 2 to 4 that describe the reliability of systems with 2, 3, and 4 components in series, respectively. These combinations are easily implemented in a spreadsheet environment, since the combination level l (due to the addi-tion of component l) uses the numerical values calculated on the l-1 combination level (previous table) for its estimation. Logical spreadsheet functions for concatenation are used for merging the tables and spreading the formulation to subse-quent tables. Alternative computational tools could be used. Every level of combination (e. g., qio, qioqjo, qioqjoqko,…) is obtained in a separate table that generates a positive or negative numerical value according to the level of that combination. We note that combinations based on an even number of components (e.g., qioqjo) generate posi-tive values, while odd combinations (e.g., qio, qioqjoqko) generate negative values. The final reliability (R) is obtained by adding the numerical values of all combina-tions (tables) to the unitary value.
This step is concluded by analyzing the effect of diffe-rent ratios of open and short failure probabilities (qo/qs) on the reliability profiles as the number of components is increased. For the proposed analysis, qio and qo/qs are to be defined by the decision-maker and qis appears as a function of those probabilities.
order of elements and identifies the order responsible for the highest reliability. As for the k-out-of-n configuration, recent approaches to the multi-state problem can be found in Chen and Yang (2005), and Li and Zuo (2008a, 2008b).
3
Approach to evaluate reliability of
three-state systems with non-identical
components
The approach proposed herein to evaluate the reliabi-lity of non-identical three-state components is as follows: (i) analyze the mathematical expressions that estimate the reliability of systems comprising a small number of components; (ii) expand such expressions to larger confi-gurations, and analyze the effect of different ratios of open and short failure probabilities on reliability patterns as the number of components is increased; and (iii) apply a nonli-near programming model aiming to optimize the allocation of non-identical components under project restrictions. These steps are better explained in the following sections.
It is important to mention that the approach is described based on a series structure; the parallel configuration can be easily derived by switching open and short failure probabilities in the reliability equations.
3.1 Analysis of reliability pattern of series systems composed of a small number of non-identical components
This step initially describes the modes that induce a series system composed of few components to fail. Consider a system composed of 2 components (labeled as 1 and 2); the following events conduct the system to failure: (i) component 1 fails open; or (ii) component 2 fails open; or (iii) both components fail short. The reliability expres-sion listing such events is expressed in Equation 1.
2 1 ( 1o 2o 1s 2s)
R = −P x +x +x x (1)
where xio and xis denote the probability of component i to fail in open or short mode, respectively, and R is the system reliability. Equation (1) can be mathematically expanded, and terms xio and xis substituted by qioand qis,
respecti-vely, for convenience. In addition, pi + qio + qis = 1, where
pi is the probability of component i work properly. These manipulations lead to Equation 2, which is depicted in two lines to make the identification of patterns easier.
2 1 1o 2o 1s 2s 1o 2o
R = −q −q −q q +q q (2)
In the case of having three components in series, possible failure modes are described as performed in previous case. Appropriate manipulations and substitu-tions lead to Equation 3.
3 1 2 3 1 2 3
1 2 1 3 2 3 1 2 3
1 o o o s s s
o o o o o o o o o
R q q q q q q
q q q q q q q q q
= − − − − +
of each candidate component are depicted in Figure 1, as well as the maximum budget and qo/qs. The output iden-tifies the components to be assembled (1 = in, 0 = out), reliability and cost of the optimal system. In this example, components 1, 6 and 8 lead to the optimal solution for a scenario under a budget limitation of $ 23. The solution leads to a reliability of 0.996.
4
Numerical examples
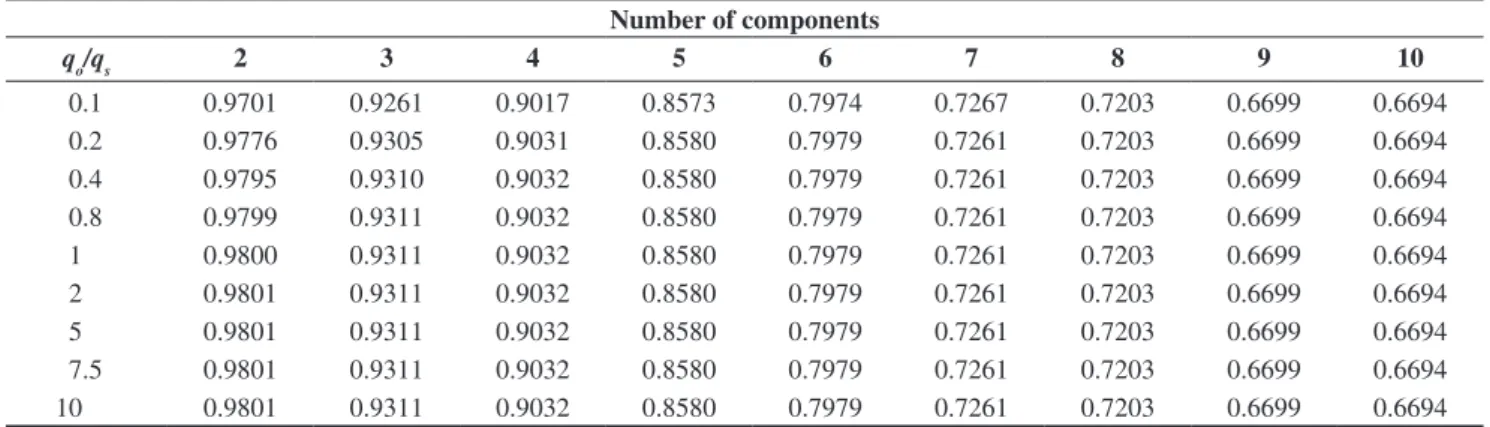
The open failure probabilities of 10 components were randomly generated under a uniform distribution in the interval [0.0005, 0.1], as in Table 1, and inserted into the formulation described in Section 3.2. Components followed the order they were labeled (i.e., an analysis of 3 compo-nents is based on units 1, 2 and 3), but their order can be easily modified by replacing the initial probabilities. Table 2 displays the reliability variation under different values of qo/ qs as the number of components is increased up to 10 units. In this scenario, qis is a function of qio and qo/qs.
The addition of three-state components decreases the reliability of the system (as depicted in Table 2), follo-wing the normal behavior of a series system as extra units are included. However, the decreasing rate is reduced as additional components are considered, and the reliability asymptotically tends to 0.66 for structures with 10 or more components. This is due (i) to the magnitude of qio
used in this analysis (different values would lead to diffe-rent final reliabilities), and (ii) to the fact that qio’s are the key terms for explaining variations on the reliability of a series system, but only the values of qis are subjected to changes in the manner this analysis was structured.
A profile relating reliability and number of components is not recommended here, since the profiles would be comple-tely overlapped as displayed in Table 2. That implies that different qo/qs do not modify the reliability pattern.
Table 3 provides the results of an identical analysis performed for a parallel system based on the same values of qio and qo/qs. In opposition to the series system, the ratio qo/qs significantly affects the reliability of the parallel configuration as the number of components is increased. The strong effect of qo/qs is justified by the influence of qis
on the reliability of parallel systems. Similarly to the series structure, adding three-state components does not increase system reliability (which differs from the normal behavior of parallel systems composed of two-state components as extra units are added). For two-state components, redun-dant units lead to reliability increase in any circumstance (unless components with smaller reliabilities are added).
Figure 2 displays reliability patterns as non-identical components are added following the same qo/qs values from the previous case. The higher the qo/qs the smaller the reliability variation.
In order to evaluate the effect of the magnitude of failure probabilities over the reliability profiles, Table 4 brings a new set of qio(with higher failure probabilities than those
3.3 Nonlinear programming model for allocation of non-identical components under restrictions
The purpose here is to maximize the reliability expression generated in Section 3.2. Consider we have n alternative multi-state components with different failure probabilities and costs to be assembled in a series system with k components (k < n). The task is to choose these k components regarding budget restrictions and limited number of units to be used. Equation 5 illustrates a closed expression of the reliability function to be optimized for a series structure (which indeed summarizes the tables generated in Section 3.2), where qio
and qis denote the probability of component i to fail in open or short mode, respectively.
A binary decision variable xi is used to identify the components to be chosen, where 1 indicates that compo-nent i should be used or else 0. Note that the decision variable must be included in all possible combina-tions generated by n candidate components. For modeling a parallel system, qio and qis switch positions in Equation 5.
1 1
max n (1 ) n xi
i io is
i i
x q q
= =
∏ − −∏ (5)
When using a spreadsheet with an optimization tool to solve the problem, it is necessary to manually link the combination cells to the respective binary variables. Using the first two levels of probability combinations (i.e., qio and qioqjo) is a good alternative when the optimi-zation tool presents restrictions on the number of decision variables. This is a plausible assumption, since high levels of combinations are generated by the multiplica-tion of many small terms. However, such approximamultiplica-tion does not ensure optimal allocation.
The total cost of the system to be assembled is subjected to the budget constraint in Equation 6.
1
n
i i i
x c C
=
∑ ≤ (6)
where xi is the binary variable indicating whether compo-nent i is included in the system, ci is the cost of component
i and C is the total available budget.
The number of components in the final system is subjected to the constraint in Equation 7.
1
n
i i
x k
=
∑ = (7)
where xi is defined as before and k is the total number of components to appear in the final system.
For exemplification purposes, Figure 1 depicts the interface of this model in a spreadsheet; What’s Best® 8.0
examples, and the results for the series system are presented in Table 5 and Figure 3. The failure probabi-lities tested here seem to induce slight modifications on the reliability of a two-component system. This behavior differs from the identical reliability patterns generated for 2 components in Table 2, when smaller probabilities of in Table 1), randomly generated according to a uniform
distribution in [0.08, 0.25]. A smaller range of qo/qs values is herein adopted to obey the relationship pi + qio + qis = 1, where pi is the probability of component i to work properly.
An analysis based on the second set of failure probabi-lities was performed following the approach of previous
Table 1. Open failure probabilities for 10 components.
Component 1 2 3 4 5 6 7 8 9 10
qo 0.01 0.01 0.05 0.03 0.05 0.07 0.09 0.008 0.07 0.0007
Table 2. Reliability pattern of a series system under different qo/qs and number of components. Number of components
qo/qs 2 3 4 5 6 7 8 9 10
0.1 0.9701 0.9261 0.9017 0.8573 0.7974 0.7267 0.7203 0.6699 0.6694 0.2 0.9776 0.9305 0.9031 0.8580 0.7979 0.7261 0.7203 0.6699 0.6694 0.4 0.9795 0.9310 0.9032 0.8580 0.7979 0.7261 0.7203 0.6699 0.6694 0.8 0.9799 0.9311 0.9032 0.8580 0.7979 0.7261 0.7203 0.6699 0.6694
1 0.9800 0.9311 0.9032 0.8580 0.7979 0.7261 0.7203 0.6699 0.6694
2 0.9801 0.9311 0.9032 0.8580 0.7979 0.7261 0.7203 0.6699 0.6694
5 0.9801 0.9311 0.9032 0.8580 0.7979 0.7261 0.7203 0.6699 0.6694
7.5 0.9801 0.9311 0.9032 0.8580 0.7979 0.7261 0.7203 0.6699 0.6694
10 0.9801 0.9311 0.9032 0.8580 0.7979 0.7261 0.7203 0.6699 0.6694
Table 3. Reliability of a parallel system for different levels of qo/qs and number of components.
Number of components
qo/qs 2 3 4 5 6 7 8 9 10
0.1 0.8099 0.4050 0.2835 0.1417 0.0425 0.0010 0.0005 0.0000 0.0000 0.2 0.9024 0.6769 0.5753 0.4315 0.2805 0.1542 0.1480 0.0960 0.0950 0.4 0.9505 0.8318 0.7694 0.6732 0.5554 0.4304 0.4218 0.3480 0.3474 0.8 0.9751 0.9142 0.8799 0.8249 0.7527 0.6681 0.6614 0.6035 0.6030
1 0.9800 0.9311 0.9032 0.8580 0.7979 0.7261 0.7203 0.6699 0.6694
2 0.9899 0.9653 0.9508 0.9270 0.8946 0.8543 0.8509 0.8211 0.8202
5 0.9959 0.9860 0.9801 0.9703 0.9567 0.9395 0.9380 0.9249 0.9248
7.5 0.9972 0.9907 0.9867 0.9801 0.9710 0.9593 0.9583 0.9494 0.9493
10 0.9979 0.9930 0.9900 0.9851 0.9782 0.9694 0.9686 0.9618 0.9618
presented, based on the nonlinear formulation described in Section 3.3. These simulations were performed in a spreadsheet using What’s Best 8.0 as the optimization tool, and the decision variables were set to assume binary values (1 and 0) using a Branch and Bound method.
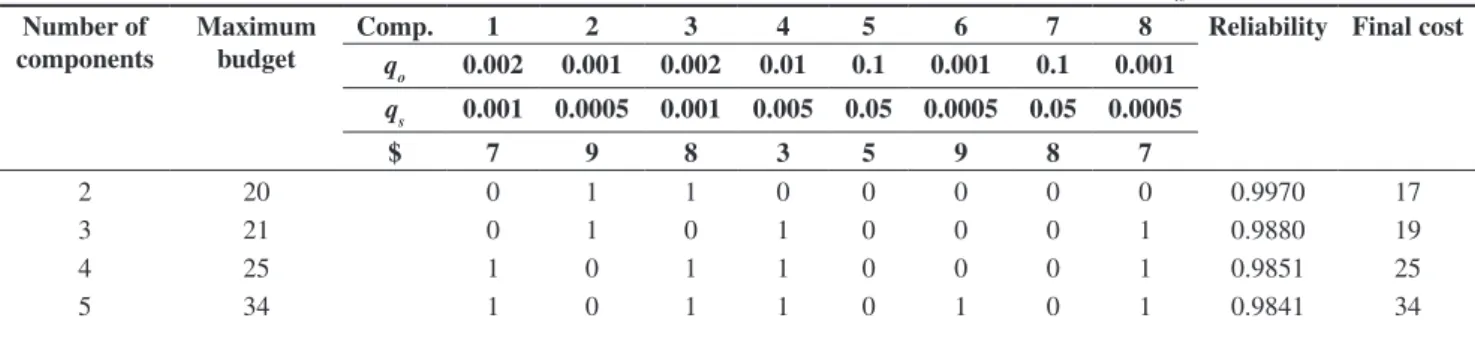
Consider a list of 8 non-identical three-state candidate components to be allocated in a series system, under diffe-rent limitations of budget and number of components. The upper highlighted region of Table 7 brings the failure probabilities and costs of each component (randomly generated), while the first two columns on the left present size and budget restrictions for each simulation. The center of the same Table identifies the chosen components failure were tested. For the remaining scenarios, different
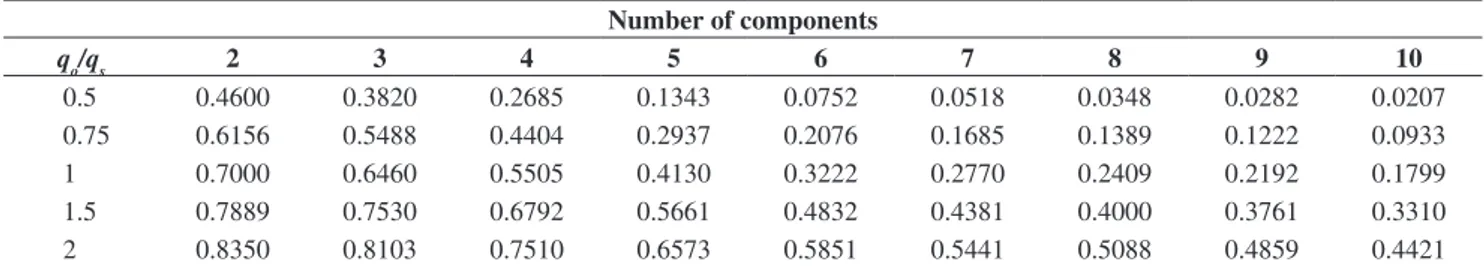
qo/qs do not lead to significant differences (Figure 3). For a parallel structure, different values of qo/qs produced significantly different profiles, as depicted in Table 6 and Figure 4. At this point, it is important to mention that, were the analysis structured based on qs/ qo instead of qo/qs, the results regarding both series and parallel structures would have presented opposite behavior. Such analysis was not performed to avoid repetition of the procedures.
In order to complete the numerical examples, some scenarios regarding the optimal allocation of three-state components with non-identical failure probabilities are
Table 6. Reliability of the parallel system for different qo/qs values and number of components (second set of qio).
Number of components
qo/qs 2 3 4 5 6 7 8 9 10
0.5 0.4600 0.3820 0.2685 0.1343 0.0752 0.0518 0.0348 0.0282 0.0207 0.75 0.6156 0.5488 0.4404 0.2937 0.2076 0.1685 0.1389 0.1222 0.0933
1 0.7000 0.6460 0.5505 0.4130 0.3222 0.2770 0.2409 0.2192 0.1799
1.5 0.7889 0.7530 0.6792 0.5661 0.4832 0.4381 0.4000 0.3761 0.3310
2 0.8350 0.8103 0.7510 0.6573 0.5851 0.5441 0.5088 0.4859 0.4421
Table 5. Reliability of series system for different qo/qs and number of components (second set of qio).
Number of components
qo/qs 2 3 4 5 6 7 8 9 10
0.5 0.6400 0.6320 0.5460 0.4107 0.3212 0.2767 0.2408 0.2192 0.1799 0.75 0.6844 0.6433 0.5499 0.4128 0.3221 0.2770 0.2409 0.2192 0.1799
1 0.7000 0.6460 0.5505 0.4130 0.3222 0.2770 0.2409 0.2192 0.1799
1.5 0.7111 0.6474 0.5507 0.4131 0.3222 0.2770 0.2409 0.2192 0.1799
2 0.7150 0.6478 0.5508 0.4131 0.3222 0.2770 0.2409 0.2192 0.1799
0.1 0.2 0.3 0.4 0.5 0.6 0.7
0 2 4 6 8 10 12
Number of components
Reliability
qo/qs = 0.5 qo/qs = 1 q o/qs = 2
Figure 3. Reliability of a series system under different qo/qs and number of components for the second set of qio.
Table 4. Second set of open failure probabilities (qio).
Component 1 2 3 4 5 6 7 8 9 10
qo 0.1 0.2 0.1 0.15 0.25 0.22 0.14 0.13 0.09 0.18
0.0 0.1 0.2 0.3 0.4 0.5 0.6 0.7 0.8 0.9 1.0
0 2 4 6 8 10 12
Number of components
R
e
lia
b
ili
ty
qo/qs = 10 qo/qs = 1 q o/qs = 0.2
Table 7. Allocations under different restrictions generated by the nonlinear optimization model (first set of qio). Number of
components
Maximum budget
Comp. 1 2 3 4 5 6 7 8 Reliability Final cost
qo 0.002 0.001 0.002 0.01 0.1 0.001 0.1 0.001 qs 0.001 0.0005 0.001 0.005 0.05 0.0005 0.05 0.0005
$ 7 9 8 3 5 9 8 7
2 20 0 1 1 0 0 0 0 0 0.9970 17
3 21 0 1 0 1 0 0 0 1 0.9880 19
4 25 1 0 1 1 0 0 0 1 0.9851 25
5 34 1 0 1 1 0 1 0 1 0.9841 34
Table 8. Allocations under different restrictions generated by the nonlinear optimization model (second set of qio).
Number of components
Maximum budget
Comp. 1 2 3 4 5 6 7 8 Reliability Final cost
qo 0.05 0.02 0.1 0.001 0.06 0.14 0.0007 0.03 qs 0.025 0.01 0.05 0.0005 0.03 0.07 0.0004 0.015
$ 3 9 8 7 5 4 8 4
2 20 0 0 0 1 0 0 1 0 0.9983 15
3 21 0 0 0 1 0 0 1 1 0.9684 19
4 25 1 0 0 1 0 0 1 1 0.9199 22
5 34 1 1 0 1 0 0 1 1 0.9015 31
Figure 4. Reliability of parallel system under different levels of qo/ qs and number of components for the second set of qio.
0.0 0.1 0.2 0.3 0.5 0.4 0.6 0.7 0.8
0 2 4 6 8 10 12
Number of components
Reliability
q
o/qs = 2 qo/qs = 1 qo/qs = 0.5
for each system (1 = in and 0 = out), while the right side of the Table depicts the final reliability and cost of such a system. For instance, consider a system consisting of 4 components to be built under total cost of $ 25; the set of components 1, 3, 4 and 8 is the optimal solution, genera-ting a final reliability of 0.9851 and cosgenera-ting $ 25.
In order to evaluate the robustness of the optimization model, a second simulation was performed considering the same number of components and budget restrictions, but with higher failure probabilities and different costs from those in Table 7. The final results for this second set of simulations are depicted in Table 8, which follows the same organization of Table 7. The model performed well, identifying the best option in all tested scenarios (additional simulations regarding parallel systems are not displayed due to space limitations).
5
Conclusion
Reliability analysis of systems composed of non-identical three-state components can be extensively time consuming and confusing, due to the highly combinatorial nature of the problem. This limitation leads to a lack of understanding regarding the way components with different magnitudes of failure probabilities affect the system. This study presented a simplified approach to estimate the reliability of such systems. Reliability expressions for systems comprised of few components are first analyzed, and their equations are then extended to systems with higher number of compo-nents in a spreadsheet. Different failure probabilities and ratios of such probabilities are tested and variations on relia-bility profiles are assessed as the number of components is increased. A nonlinear optimization programming is also suggested to identify the optimal allocations of non-iden-tical components under physical and financial restrictions.
We conclude that series systems are highly sensitive to variations on qio (probability of open failure), while parallel structures are strongly affected by modifications on qis
Future studies will be focused on detecting reliability patterns of more complex structures, such as series-parallel and series-parallel-series systems, and subsequent implementation of optimization models to identify the best component allocation for these structures. The use of alternative computational tools will also be tested, espe-cially when dealing with systems consisting of elevated number of non-identical components.
Finally, the integration of such formulation with an optimization solver proved to be robust and precise for identifying the best set of non-identical components for allocation in series and parallel systems characterized by limitations of budget and number of components. The implementation of that formulation in the spreadsheet is straightforward and the calculations are fast even when using a Branch and Bound approach.
AZAIEZ, M.; BIER, V. Optimal resource allocation for security in reliability systems. European Journal of Operational Research, Netherlands, v. 181, n. 2, p. 773-786, 2007. CHEN, Y.; YANG, Q. Reliability of two-stage weighted-k-out-of-n
systems with components in common. IEEE Transactions on Reliability, Colorado, v. 54, n. 3, p. 431-440, 2005.
CHING, J.; AU, S.; BECK, J. Reliability estimation for dynamical systems subject to stochastic excitation using subset simulation with splitting. Computers Methods in Applied Mechanics and Engineering, Netherlands, v. 194, n. 12-16, p. 1557-1579, 2005.
COIT, D.; SMITH, A. Optimization approaches to the redundancy allocation problem for series-parallel systems. PROCEEDINGS OF THE FOURTH INDUSTRIAL ENGINEERING RESEARCH CONFERENCE, Philadelphia, 1995.
ELEGBEDE, A; CHU, C. Reliability allocation through cost minimization. IEEE Transactions on Reliability, Colorado, v. 52, n. 1, p. 106-111, 2003.
ELSAYED, E. Reliability engineering. 2 ed. New Jersey: Elsayed A., 2006.
HAUSKEN, K.; LEVITIN, G. Minmax defense strategy for complex multi-state systems. Reliability Engineering & System Safety, London, v. 94, n. 2, p. 577-587, 2009.
Metodologia simplificada para análise de confiabilidade e
alocação de componentes não-idênticos com
3 modos de falha em sistemas em série e paralelo
Resumo
Sistemas compostos por componentes não-idênticos com múltiplos modos de falha demandam expressões comple-xas para estimativa de confiabilidade, tendo em vista o elevado número de combinações necessárias para descrição dos eventos que conduzem o sistema a falhas. Como consequência, a variação dos perfis de confiabilidade provocada por distintas magnitudes de probabilidades de falhas não é de claro entendimento, especialmente ao considerar-se a inclusão de novos componentes não-idênticos ao sistema. Este artigo apresenta uma abordagem simplificada para estimar níveis de confiabilidade em sistemas em série e paralelo, compostos por componentes não-idênticos com 3 modos de falha. Um modelo não-linear para otimizar a alocação de tais componentes em sistemas submetidos a restrições de projeto também é apresentado. Os resultados obtidos mostram que o modelo proposto é robusto quando diversas magnitudes de probabilidades de falhas são consideradas.
Palavras-chave: Componentes não-idênticos. Componentes com múltiplos modos de falha. Alocação de componentes.
JENNEY, B.; SHERWIN, D. Open and short circuit reliability of systems of identical items. IEEE Transactions on Reliability, Colorado, v. 35, n. 5, p. 532-538, 1986.
KAPUR, K.; LAMBERSON, L. Reliability in engineering design. New York: Wiley & Sons, 1977.
KUO, W. An annotated overview of system-reliability optimization. IEEE Transactions on Reliability, Colorado, v. 49, n. 2, p. 176-187, 2000.
LEVITIN, G. Block diagram method for analyzing multi-state systems with uncovered failures. Reliability Engineering & System Safety, London, v. 92, n. 6, p. 727-734, 2007.
LEVITIN, G. Linear multi-state sliding-window systems. IEEE Transactions on Reliability, Colorado, v. 52, n. 2, p. 263-269, 2003.
LEVITIN, G. Optimal allocation of elements in a linear multi-stat sliding window system. Reliability Engineering & System Safety, London, v. 76, n. 3, p. 245-254, 2002b.
LEVITIN, G. Optimal series-parallel topology of multi-state system with two failure modes. Reliability Engineering & System Safety, London, v. 77, n. 1, p. 93-107, 2002a.
LEVITIN, G.; LISNIANSKI, A. A new approach tho solving problems of multi-state system realiability optimization. Quality and Reliability Engineering International, London, v. 17, n. 2, p. 93-104, 2001.
RAMIREZ-MARQUEZ, J.; COIT, D. A heuristic for solving the redundancy allocation problem for multi-state series-parallel systems. Reliability Engineering & System Safety, London, v. 83, n. 3, p. 341-349, 2004b.
RAMIREZ-MARQUEZ, J.; COIT, D. Composite importance measures for multi-state systems with multi-state components. IIE Transactions on Quality and Reliability Engineering, Philadelphia, v. 87, n. 2, p. 517-529, 2005.
RAMIREZ-MARQUEZ, J.; COIT, D.; KONAK, A. Redundancy allocation for series-parallel systems using a max-min approach. IIE Transactions on Quality and Reliability Engineering, Philadelphia, v. 36, n. 9, p. 891-898, 2004a.
RAMIREZ-MARQUEZ, J.; COIT, D.; TORTORELLA, M. A generalized state based path vector approach for multi-state two-terminal reliability. IIE Transactions on Quality and Reliability Engineering, Philadelphia, v. 38, n. 6, p. 477-488, 2006b.
RAMIREZ-MARQUEZ, J.; LEVITIN, G. Algorithm for estimating reliability confidence bounds of multi-state systems. Reliability Engineering & System Safety, London, v. 93, n. 8, p. 1231-1243, 2008.
RAMIREZ-MARQUEZ, J.; ROCCO, C.; ASSEFA, B.; COIT, D.; TORTORELLA, M. New insights on multi-state component criticality and importance. Reliability Engineering & System Safety, London, v. 9, n. 1, p. 894-904, 2006a.
ROCCO, C.; MUSELLI, M. Approximate multi-state reliability expressions using a new machine learning technique. Reliability Engineering & System Safety, London, v. 89, n. 3, p. 261-270, 2005.
TIAN, Z.; ZUO, M.; HUANG, H. Reliability-redundancy allocation for multi-state series-parallel systems. IEEE Transactions on Reliability, Colorado, v. 57, n. 2, p. 303-310, 2008.
VIERTL, R.On reliability estimation based on fuzzy lifetime data. Journal of Statistical Planning and Inference, Netherlands, v. 139, n. 5, p. 1750-1755, 2008.
LEVITIN, G.; AMARI, S. M. Multi-state systems with multi-fault coverage. Reliability Engineering & System Safety, London, v. 93, n. 11, p. 1730-1737, 2008.
LI, W.; ZUO, M. Optimal design of multi-state weighted -out-of- systems based on component design. Reliability Engineering & System Safety, London, v. 93, n. 11, p. 1673-1681, 2008. LI, W.; ZUO, M. Reliability evaluation of multi-state weighted
k-out-of-n systems. Reliability Engineering & System Safety, London, v. 93, n.1, p. 160-167, 2008.
LIANG, J.; MOURELATOS, Z.; TU, J. A single-loop method for reliability-based design optimization. International Journal of Product Development, London, v. 5, n. 1-2, p. 76-92, 2008. LISNIANSKI, A.; LEVITIN, G. Multi-state system reliability
assessment, optimization and applications. New Jersey: World Scientific, 2003. Series on Quality, Reliability and Engineering Statistics.
MAJETY, S; DAWANDE, M.; RAJGOPAL, J. Optimal reliability allocation with discrete cost-reliability data for components. Operations Research, London, v. 47, n. 6, p. 899-906, 1999. NEIL, M.; TAILOR, M. MARQUEZ, D.; FENTON, N.; HEARTY,
P. Modelling dependable systems using hybrid Bayesian networks. Reliability Engineering & Systems Safety, London, v. 93, n. 7, p.933-939, 2008.
O’CONNOR, P. Practical reliability engineering. 2 ed. New York: Wiley & Sons, 1985.
PAGE, L.; PERRY, J. Optimal “Series-Parallel” Networks of 3-State Devices. IEEE Transactions, v. 37, n. 4, p. 388-394, 1988.
PAGE, L.; PERRY, J. Reliability of networks of three-state devices. Microelectronics Reliability, London, v. 27, n. 1, p. 175-178, 1987.
RAMIREZ-MARQUEZ, J. Holistic reliability analysis of weighted voting systems from a multi-state perspective. IIE Transactions on Quality and Reliability Engineering, Philadelphia, v. 40, n. 2, p. 122-132, 2008.
About the authors
Michel José Anzanello
Department of Industrial and Systems Engineering, Rutgers University, Piscataway, NJ 08854-8018, USA,
e-mail: [email protected]