Relationship between the Dietary Fibre Consumption and the Level of
Knowledge
Viktória Szűcs
1, Júlia Harangozó
1and Raquel P. F. Guiné
21
National Agricultural Research and Innovation Centre – Food Science Research Institute, Budapest, Hungary
2
CI&DETS/Escola Superior Agrária do Instituto Politécnico de Viseu, Viseu, Portugal
Abstract.
Frequent consumption of dietary fibres can have favourable effect in the prevention and treatment of several diseases. Despite of these positive effects, Hungarian consumption of dietary fibre, as well as fruits and vegetables are below the recommended levels. Thus the aim of this study was to analyse the fibre consumption habits, the related level of knowledge, as well as the recognition of the potential information sources to ensure authentic information about dietary fibres. For this purpose a questionnaire survey was completed with the help of 303 Hungarian participants in 2014. Results showed that participants with higher level of consumption of fruits and vegetables had higher level of knowledge about dietary fibres. Even though respondents were aware of the positive health effects of dietary fibre, their consumption habits do not reflect that. Internet was proved as a utilized and preferred information source, so stressing of the authentic websites for the consumers about dietary fibres is an outstanding task. Results indicated that regarding the multiple beneficial effects of dietary fibres, for the supporting of mindful consumer decisions accurate and reliable information must be ensured for consumers, as well as authentic sources have to be designated.Keywords:
dietary fibre, questionnaire survey, consumption, knowledge.1. Introduction
According to the definition of the CODEX Alimentarius Commission ‘dietary fibre means carbohydrate polymers with ten or more monomeric units, which are not hydrolysed by the endogenous enzymes in the small intestine of humans’ [1]. A number of scientific studies confirm the important role of dietary fibre consumption in the reducing of certain diseases like cancer, diabetes, obesity and coronary heath diseases [2], [3]. There are considerable differences between the recommendations about the dietary fibre consumption worldwide [3]. According to the World Health Organization (WHO), the average adult should eat 25g of fibre per day [4]. Depending on the latest published representative dietary survey, Hungarian consumers’ fibre consumption was below the recommended value [5]. However the reference amount could be easily ensured by the proper consumption of fruits and vegetables. Even though there are number of recommendations for the adequate fruit and vegetable consumption (e.g. ‘5 a day’ [6]), the National Institute for Food and Nutrition Science (Hungary) propagates to eat ‘3 times 3 different’ fruit and vegetable [7]. For the prevention of chronic diseases such as heart disease, cancer, diabetes and obesity, as well as for the prevention and alleviation of several micronutrient deficiencies, especially in less developed countries WHO recommends to consume a minimum of 400 g of fruit and vegetables per day (excluding potatoes and other starchy tubers) [4], which exceeds the average Hungarian consumption (around 234g per day [8]).
Corresponding author. Tel.: + 36(1)796-0423; fax: +36(1)7960449. E-mail address: [email protected]
International Proceedings of Chemical, Biological and Environmental Engineering, Vol. 86 (2015) DOI: 10.7763/IPCBEE. 2015. V86. 14
The present study intended to analyse Hungarian consumers’ fibre consumption habits, their connected knowledge level, as well as the recognition of the potential information sources in order to ensure authentic information.
2. Materials and Methods
During the research work a self administered questionnaire was developed and filled out in 2014. The data collection resulted in 303 validated questionnaires obtained via Internet.
Results of the questionnaire survey were analysed with the help of the SPSS 22 Statistical software (mean, Skewness, ANOVA, frequency, Chi2 test). Ranking of the information sources were evaluated with Friedman test and Post hoc analysis with Wilcoxon signed-rank tests was conducted with the application of a Bonferroni correlation.
Considering the Hungarian fruit and vegetable consumption recommendation (‘3 times 3 different’ a day) participants were separated into three groups according to their consumption habits. Members of the ‘extreme low’ group (N= 165) consume fruit and vegetables less than two times a day, while the elements of the ‘low’ group (N= 86) more than two times but less than three times. Fruit and vegetable intake of the ‘adequate’ group (N= 52) meets the recommendation or even exceeds it. Regarding the differences among the groups (p≤ 0.05) it can be said that there were more respondents with university degree in the ‘adequate’ group, and there were more young participants (18-24 years) in the ‘extreme low’ group (Table 1). Members of the ‘adequate’ group just occasionally eat outside from home and almost never eat fast food. Furthermore eating of whole grain products (e.g. whole-wheat bread, whole-wheat pasta) was typical of them.
Table 1: Socio-demographic distribution of the fibre consumer groups
Extreme low Low Adequate Total
N % N % N % N % Gender 165 54.5 86 28.4 52 17.2 303 100.0 Female 119 72.1 60 69.8 38 73.1 217 71.6 Male 46 27.9 26 30.2 14 26.9 86 28.4 Age 165 54.6 86 28.5 51 16.9 302 100.0 1824 years 97 58.8* 37 43.0 13 25.5 147 48.7 25-34 years 46 27.9 30 34.9 16 31.4 92 30.5 35-44 years 14 8.5 7 8.1 10 19.6 31 10.3 Over 45 years 8 4.8 12 14.0 12 23.5 32 10.6
Highest level of education 165 54.5 86 28.4 52 17.2 303 100.0
Secondary school or lower 78 47.3 40 46.5 14 26.9 132 43.5 University degree 87 52.7 46 53.5 38 73.1* 171 56.4
Living environment 165 54.5 86 28.4 52 17.2 303 100.0
Rural 23 13.9 11 12.8 7 13.5 41 13.5
Urban 142 86.1 75 87.2 45 86.5 262 86.5
*Adjusted Residual > 2
3. Results and Discussion
3.1.
Knowledge about Dietary Fibres
Knowledge of the group members was not unambiguous about dietary fibres. The sources of fibre and its’ two groups (soluble, insoluble) were partly known. Significant difference among the groups was found according to the knowledge of the WHO recommendation. Participants of the ‘adequate’ group knew this reference better than the others. High positive Skewness rate (> 1, which means the left skew of the distribution curve) show that members of the ‘adequate’ group mainly disagreed with the statement that ‘whole foods have less fibre than non-whole foods’ (Table 2).
Table 2: Knowledge about dietary fibres regarding the level of their consumption
Extreme low Low Adequate
Mean SD Skew. Mean SD Skew. Mean SD Skew.
Only vegetable foods have fibre. 2.68 1.370 0.324 2.93 1.493 -0.138 2.58 1.564 0.332 Foods of animal origin such as meat,
eggs and dairy products contain no fibres (unless added).
2.78 1.350 0.160 3.07 1.445 -0.053 2.94 1.602 0.008
According to the WHO, the average
adult should eat 25g of fibre per day. 3.47
b 0.894 -0.495 3.56ab 1.047 -0.535 3.87a 0.991 -0.853
Whole foods (e.g. pasta, rice, bread, cereal) have less fibre than non-whole
foods.
2.24 1.265 0.759 2.21 1.423 0.748 1.88 1.308 1.314
The unpeeled fruits have less fibre than
peeled ones. 2.27 1.359 0.660 2.21 1.390 0.772 2.18 1.519 0.864 Dietary fibres are classified into soluble
and insoluble. 3.32 1.121 -0.162 3.48 1.135 -0.683 3.69 1.197 -0.440 1: strongly disagree, 5: strongly agree
Mean utilities with different superscript letters within a row (a, b, c) differ significantly (p≤ 0.05)
3.2.
Relationship between Fibre and the Variety of Foods
Results of the statements about the relationship between fibre and the different foods were in line with the previous results (Table 2) that most of the participants – mainly members of the ‘adequate’ group – knew correctly that dietary fibre might originate from both vegetable and animal foods. It is important to note that the legumes high fibre content was known the best by the participants (Skewness < -1, which means the right skew of the distribution curve). Members of the lower consumer groups were not able to decide that dietary fibres have calories or not. Furthermore respondents linked higher fibre consumption to the people living in rural areas. Probably it was due to the fact that while in the rural area people are able to grow fruits and vegetables, inhabitants of cities can purchase them just in the grocery (Table 3).
Table 3: Relationship between fibre and the variety of foods
Extreme low Low Adequate
Mean SD Skew. Mean SD Skew. Mean SD Skew.
Dietary fibre comes only in vegetable foods. 2.65 1.300 0.285 2.78 1.450 0.089 2.62 1.586 0.363 Dietary fibre comes only in animal foods. 1.73a 0.842 0.787 1.57ab 0.744 1.070 1.42b 0.667 1.323 Dietary fibre may originate in vegetable and animal foods. 3.58 1.269
-0.751 3.45 1.436
-0.527 3.81 1.373 -0.727 Dietary fibres have calories, and so they provide energy to the
organism when ingested. 3.48
a 1.272
-0.470 3.42
b 1.278
-0.523 2.87
c 1.495 0.093
Legumes (e.g. peas, beans), cereals and fruits are foods that
are very rich in dietary fibre. 4.24 0.862 -1.057 4.35 0.991 -1.645 4.48 0.939 -2.010 The average consumption of dietary fibres is higher in urban
areas than in rural areas. 1.99 0.883 0.561 1.95 0.866 0.424 2.29 1.126 0.597 1: strongly disagree, 5: strongly agree
Mean utilities with different superscript letters within a row (a, b, c) differ significantly (p≤ 0.05)
3.3.
Relationship between Fibre Consumption and Diseases
Members of all groups – mainly participants of the ‘adequate’ group – were agreed with the favourable health effects of dietary fibres (Skewness < -1). The connection of the fibre consumption and the prevention and/or treatment of different diseases like constipation (Skewness < -1), obesity, level of cholesterol, cardio-vascular diseases and diabetes were known by the respondents. However the positive effect of them regarding breast cancer and vision problems was not clear (Table 4).
3.4.
Sources of Information
Evaluation of the information sources showed that ‘internet’ was significantly the most frequently used channel for the members of the ‘lower’ groups. However for the participants of the ‘adequate’ cluster ‘magazines and books’ had similar importance as the ‘internet’. Probably this can be due to the fact that more participants having university degree belong to this group, who prefer reading related books and journals. It is unfavourable result that ‘health centres, hospitals’ and ‘school’ was a less potential source for the groups followed by the ‘radio’ (Table 5).
Table 4: Relationship between fibre consumption and diseases
Extreme low Low Adequate
Mean SD Skew. Mean SD Skew. Mean SD Skew.
Eating dietary fibres in appropriate amounts can prevent and/or treat diseases.
4.13 b 0.905 -1.004 4.19ab 0.861 -1.165 4.48a 0.874 -2.045
Fibres can prevent and/or treat cardio-vascular diseases.
3.83 0.888 -0.718 3.84 1.027 -0.731 3.92 0.967 -0.789
Fibres can prevent and/or treat cholesterol. 3.85 0.901 -0.606 3.92 0.973 -0.619 3.81 1.121 -0.907 Fibres can prevent and/or treat bowel cancer. 3.85c 1.037 -0.600 4.21b 0.813 -0.674 4.33a 1.024 -1.506 Fibres can prevent and/or treat obesity. 3.92b 0.927 -0.435 4.14ab 0.935 -0.992 4.25a 1.046 -1.492 Fibres can prevent and/or treat breast cancer. 2.77 1.086 0.152 2.65 1.146 0.243 3.10 1.192 -0.048 Fibres can prevent and/or treat constipation. 4.29 0.969 -1.387 4.50 0.837 -1.913 4.46 1.056 -2.074 Fibres can prevent and/or treat vision problems. 2.81 1.109 0.202 2.67 1.127 0.175 3.06 1.092 -0.212 Fibres can prevent and/or treat the deficiency of
vitamins and minerals.
3.52 1.243 -0.556 3.74 1.180 -0.760 3.50 1.146 -0.366
Fibres can prevent and/or treat diabetes. 3.42 1.105 -0.382 3.72 1.042 -0.569 3.87 1.103 -0.818 1: strongly disagree, 5: strongly agree
Mean utilities with different superscript letters within a row (a, b, c) differ significantly (p≤ 0.05)
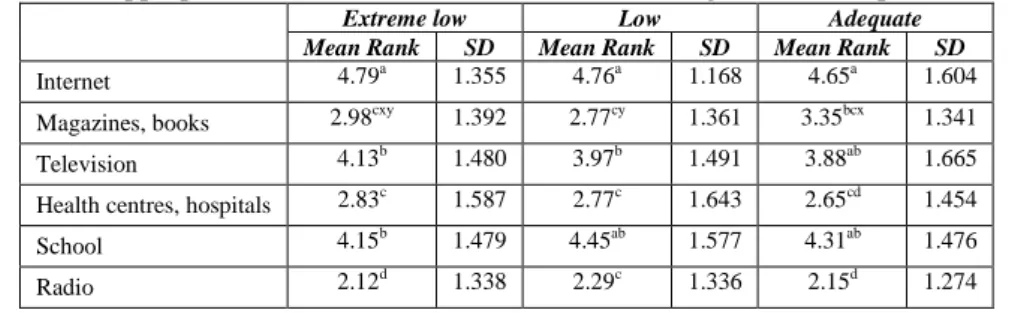
Ranking of the information sources according to their appropriateness to encourage the consumption of dietary fibre emphasizes again the outstanding importance of ‘internet’. However the ‘television’ and the ‘school’ were considered as proper, while ‘radio’ judged as the less suitable information channel for the communication about dietary fibres (Table 6).
Table 5: Information source about dietary fibre
Extreme low Low Adequate
Mean Rank SD Mean Rank SD Mean Rank SD
Internet 4.81a 1.414 5.02a 1.389 4.92a 1.266
Magazines, books 3.98bcy 1.596 4.22bxy 1.367 4.67ax 1.294
Television 3.64b 1.419 3.59bc 1.560 3.29b 1.564
Health centres, hospitals 3.32bcd 1.837 2.90cd 1.645 2.85bc 1.539
School 3.04d 1.493 2.72d 1.386 2.90b 1.498
Radio 2.23e 1.267 2.55d 1.436 2.37c 1.372
1: the least important, 6: the most important
Mean utilities with different superscript letters within a column (a, b, c) and with different superscript letters within a row (x, y, z) differ significantly (p≤
0.05)
Table 6: The most appropriate sources of communication to encourage the consumption of dietary fibre
Extreme low Low Adequate
Mean Rank SD Mean Rank SD Mean Rank SD
Internet 4.79a 1.355 4.76a 1.168 4.65a 1.604
Magazines, books 2.98cxy 1.392 2.77cy 1.361 3.35bcx 1.341 Television 4.13b 1.480 3.97b 1.491 3.88ab 1.665 Health centres, hospitals 2.83c 1.587 2.77c 1.643 2.65cd 1.454
School 4.15b 1.479 4.45ab 1.577 4.31ab 1.476
Radio 2.12d 1.338 2.29c 1.336 2.15d 1.274
1: the least important, 6: the most important
Mean utilities with different superscript letters within a column (a, b, c) and with different superscript letters within a row (x, y, z) differ significantly (p≤ 0.05)
4. Conclusion
Relationship between the dietary fibre consumption and the level of knowledge was proved by the study. Level of knowledge was higher with increasing the consumption frequency. However this was mainly a tendency, because it was not verified significantly in all cases. Participants with university degree belonged to the ‘adequate’ group (higher level of knowledge), while young respondents (18-24 years) to the ‘extreme low’ category (low level of knowledge).
importance to the role of fibres in the treatment and prevention of certain diseases, the level of intake was too low. Internet was found to have an important source of information for the respondents so stressing of the authentic websites for the consumers about dietary fibres is an outstanding task.
It is important to note that the fruit and vegetable consumption habits were not satisfying in case of the respondents. This can be due to the fact that data collection was during the autumn/winter season when the fresh fruit and vegetable consumption of the Hungarian population is restricted. So the repetition of the study and taking into consideration of the season-dependency can help to explore further connections.
Considering the multiple beneficial effects of dietary fibres, for the supporting of mindful consumer decisions accurate and reliable information must be ensured for consumers; furthermore authentic sources have to be designated.
5. Acknowledgements
This work was prepared in the ambit of the multinational project from CI&DETS Research
Centre (IPV - Viseu, Portugal) with reference PROJ/CI&DETS/2014/0001. The work was
supported by AGR_PIAC_13-1-2013-0084 project.
6. References
[1] J. M. Jones. CODEX-aligined dietary fiber definitions help to bridge the ‘fiber gap’. Nutrition Journal. 2014, 13: 1-10.
[2] C. W. C. Kendall, A. Esfahani, D. J. A. Jenkins. The link between dietary fibre and human health. Food
Hydrocolloids. 2010, 24: 42-48.
[3] J. Gray. Dietary fibre. ILSI Europe, 2006.
[4] World Health Organization. Diet, nutrition and the prevention of chronic diseases. Report of a Joint WHO/FAO Expert Consolation. WHO Technical Report Series 916, Geneva, 2003.
[5] M. Szeitz-Szabó, L. Bíró, Gy. Bíró, J. Sali. Dietary survey in Hungary, 2009. Part I. Macronutrients, alcohol,
caffeine, fibre. Acta Alimentaria. 2011, 40(1): 142-152.
[6] Joint FAO/WHO. Fruit and vegetables for health. Report of a Joint FAO/WHO Workshop, 1-3 September 2004, Kobe, Japan.
[7] Naponta 3x3. http://www.3x3.hu/programrol
[8] KSH. Statistical Yearbook of Hungary, 2013. Hungarian Central Statistical Office, 2014.
[9] C. A. C. Marthino, A. C. Correira, F. M. J. Gonçalves, J. L. Abrantes, R. Caevalho, R. P. F. Guiné. Study about the knowledge and attitudes of the Portuguese population about food fibres. Current Nutrition & Food Science. 2013, 9: 180-188.