Leveraged Buyout Spreads:
A Focus on Loan Maturity
Trabalho Final na modalidade de Dissertação apresentado à Universidade Católica Portuguesa
para obtenção do grau de mestre em Finanças
por
João Pedro Jesus
sob orientação de
Prof. Doutor Ricardo Manuel Cunha Prof. Doutor Paulo Alexandre Pimenta Alves
Católica Porto Business School, Universidade Católica Portuguesa Abril 2018
Abstract
This thesis investigates the determinant factors concerning pricing of loans in LBOs, the term structure of these loans, and determinants of loans maturity, using a sample of 1,196 syndicated loan deals closed from 2000 to 2016. Our results suggest differences in spreads and pricing processes in market-based versus bank-based financial systems as well as in the U.S. versus W.E. EV/EBITDA proved to not have great impact in spreads. Furthermore, the convex relationship found in previous literature [Sorge and Gardanecz (2008), Marques et al. (2015) and Pinto et al. (2016)] could be flattened with the relationship between spread and maturity/EBITDA multiple, with just a slight slope (diverging through the different sub-samples). Results indicate number of tranches, firm size, rentability and deal location to impact maturity in LBOs loans.
Resumo
Este trabalho final de mestrado investiga os fatores determinantes para definir o preço de empréstimos em operações LBO, a estrutura destes empréstimos e os determinantes da maturidade nestes mesmos empréstimos, utilizando uma amostra com 1,196 empréstimos sindiados negociados entre 2000 e 2016. Os resultados obtidos sugerem diferenças nos spreads e nos processos de atribuição de preço para as diferentes sub-amostras, nomeadamente nos sistemas financeiros market-based versus bank-based, como também nas regiões de Estados Unidos (U.S.) versus Europa Oeste (W.E.).
A variável EV/EBITDA provou não ter um impacto muito significativo nos spreads. A relação de convexidade entre o spread e a maturidade observada em literatura prévia (Sorge and Gardanecz , 2008, Marques et al., 2015 e Pinto et al. , 2016) foi suavizada com a relação entre o spread e uma variável criada representante da Maturidade/Múltiplo de EBITDA, com apenas um ligeiro declive (que diverge nas diferentes sub-amostras). Os resultados indicam que o número de transações, o tamanho da empresa, a rentabilidade e a localização do devedor têm impacto a maturidade dos empréstimos com propósito de LBO.
Índice
Abstract ... iii
Índice ... vii
Índice de Figuras... x
Índice de Tabelas ... xii
1.Introduction ... 17
2. Literature Review ... 20
2.1 What is a LBO? ... 17
2.2 First LBO Boom………..21
2.3 2000's Crisis and Second LBO Boom………..21
2.4 The Financial System……….22
2.5 Deal location and Regulation………...23
2.6 Pricing Determinants……….24
2.7 Determinants of Syndicated Loans Spreads………...25
3. Research Question ... 26
4. Data and Sample Selection ... 27
4.1 Data Description ... 27
4.2 Variables of the Model ... 30
4.2.1 Dependent Variable... 30
4.2.2 Independent Variables ... 30
4.2.2.1 Microeconomic Independent Variables ... 30
4.2.2.2 Macroeconomic Independent Variables ... 32
4.3 Descriptive Statistics………..33
4.4 Preliminary Analysis……….34
6. Results ... 39
6.1 LBO loans pricing in integrated markets……… …...39
6.2 Determinants of spreads………...42
6.3 Relationship spreads vs Maturity/EBITDA multiple………...44
7. The impact of acquired firm's characteristics on spreads and pricing processes………46
7.1 Univariate Analysis ... 46
7.2 Multivariate Analysis ... 49
8. Determinants of Maturity………53
9. Summary and Conclusions……….56
Índice de Figuras
Índice de Tabelas
Table 1: Distribution of the full sample of loans in LBOs by year, borrower’s
nationality and industry………..29
Table 2: Contractual characteristics of syndicated loans in LBOs……….34
Table 3: Definition of variables, expected sign, and findings………36
Table 4: Regression analyses of the determinants of credit spreads……….41
Table 5: Descriptive statistics for target firms………..48
Table 6: Regression analyses of the determinants of credit spreads: the impact of acquired firms’ characteristics………....51
1. Introduction
A leveraged buyout is comprehended as the acquisition of a company using a high percentage of borrowed money and a small portion of capital.
This thesis studies the determinants of leveraged buyout spreads, using a sample of 1,196 deals extended in U.S. and W.E., closed between 2000 and 2016, with focus on adding to the previous studies a better insight of the relationship between this spreads with the maturity and EBITDA Multiple(EV/EBITDA1). Previous studied topics on LBO’s like the influence
of the location of the borrower (U.S. versus W.E2), the legal systems
implemented on the borrower country(common law versus civil law), the financial system or the term structure of loan spreads , but will not be the main topic of the thesis. After the first LBO Boom, which occurred in the 1980’s, pricing the determinants of spreads in these buyouts became an interesting topic for academics. To date, there are only two empirical works trying to study the determinants of syndicated loan spreads. One focuses on the impact of private equity firms’ bank relationships on the terms of their syndicated loans (Ivashina and Kovner, 2011), and Colla et al. (2012) using a final sample of 238 transactions closed between 1997 and 2005, study the leverage and pricing of debt in LBO’s.
This masters final assignment tries to find if when added EBITDA multiple (EV/EBITDA) under maturity the relationship between spreads and maturity flattens, making the hump-shaped found in the previous literature (Sorge and Gadanecz, 2008, Marques et al., 2015, and Pinto et al., 2016) disappear. We
1 EV/EBITDA represents the Enterprise Value under Earnings before interest taxes depreciations and
amortizations
also do an analysis of the determinants of spreads in syndicated loans in LBOs, as well as for the firms’ characteristics of it. Finally, we try to find what are the determinants of maturity.
This thesis results indicate that loans in LBOs closed in market-based and bank-based financial systems are influenced by common pricing factors, even deals extended to U.S. and W.E. have different pricing processes. Furthermore, we could indeed flatten the hump-shape of the relationship between spreads and maturity, with satisfactory results, although not perfect. Finally, we find some of the determinants of maturity, however, the results are far from the expected, requiring future research to help explain it’s determinants.
Concerning the organization of this thesis, in Section 2 is presented a literature review of LBO loans. Section 3 presents the main research questions. Section 4 provides a data description and sample selection, as well as a descriptive and preliminary analysis to the financial characteristics on syndicated loan deals in LBOs. Section 5 describes the methodology and presents the model used. Section 6 has an analysis of the results obtained for the determinant of spreads and the study of spread vs maturity and multiple relationship. Section 7 presents the description and analysis on the impact of the acquired firms’ characteristics on spreads an pricing processes. Section 8 provides a brief analysis of maturity determinants results and finally Section 9 concludes the thesis with the main conclusions taken from this study.
2. Literature Review
2.1 What is a LBO
A leveraged buyout is comprehended as the acquisition of a company using a high percentage of borrowed money, Rosenbaum and Pearl (2009) state that in a LBO transaction debt typically consists 60% to 70% of the financing structure. The debt used to finance these deals is majorly a senior and secured loan, arranged by a bank or an investment bank. Leveraged Buyouts also have a portion of junior, unsecured debt (Demiroglu and James, 2007 and Standard and Poors, 2008), usually financed through high yield bonds (junk bonds) or “mezzanine debt”.
LBOs are usually conducted due to three main reasons, most frequently, taking a public company into private, spin-off a portion of an existing business by selling it or transfer private property. This deals only happens when the promoters expect to receive a significant gain (Kaplan, 1989a).
There is a substantial amount of studies based on LBO’s from the 1980s, that concludes that leveraged transactions create value (Kaplan, 1989a, 1989b, Opler and Titman, 1993 and Renneboog and Simons, 2005). Authors identify the source of this gains, when substituting equity for debt in LBOs, coming from: (i) benefits of tax shields; (ii) nurturing the effects of leverage; (iii) better governance mechanisms.
Damodaran (2008) points out three disadvantages for the use of debt – (i) possibility of bankruptcy, (ii) agency costs, (iii) lost of future financing possibilities. Kaplan and Stromberg (2009) also present some disadvantages of
LBOs, stating that LBOs take the tax benefits and information, but were not creating economic value.
2.2 First LBO Boom
Leveraged buyouts got everyone’s attention in the 80’s with the increased leveraged buyouts activity through the decade, Jensen (1989) predicted that the emerging leveraged buyout firms would eventually become the dominant corporate organizational form, arguing that private equity itself joint with the concentrated ownership stakes in its portfolio companies, lean and efficient organization with minimal superior costs and all the high-powered incentives for private equity firm professionals. Jensen (1989) finds these structures to be defined superior to those of the typical public firm with dispersed shareholders, low leverage, and weak corporate governance. After the junk bond market crash and a large number of well-known leveraged buyouts failing to survive, resulting in default and bankruptcy, most of LBO public companies disappeared by the beginning of the next decade, leaving a feeling that Jensen (1989) was mildly wrong in his predictions.
2.3 2000’s Crisis and Second LBO Boom
Shivdasani and Wang (2011) stated that a leveraged buyout boom occurred between 2004 and 2007, coinciding with an exponential growth in collateralized debt obligations (CDOs). In the period of 2007-2008 the financial crisis brought Collateralized loan obligations (CLOs), (resulting in a decline of LBO activity once again) which banks utilized to finance LBO loans with collateralized loan
obligations (CLO), which are similar to CDOs but backed by loans. Worldwide private equity firms in leveraged buyouts were financed by CLOs (Benmelech and Dlugosz, 2009)
After a period of low activity in LBO acquisitions, the world experienced a second LBO boom in the mid-2000’s, as the U.S. economy raised strong, hitting a record amount of capital utilized in private equity. This wave of LBO’s rivaled, or even overtook, the 1980’s LBO boom, the stock market
2.4 The Financial System
The financial system goal is to access and put together funds from investors and exchange these funds amid investors and borrowers through regulated markets and intermediaries (Moody’s Investor Service, and Standard and Poor’s, Boot and Thakor, 1997, and Chakraborty et al., 2006). There are two types of financial system, which are market-based and bank-based. These financial systems have an important role due to the benefits and disadvantages of each financing decision, and therefore have the possibility of impacting the leverage level of a LBO as well as the cost of debt. In corporate finance, the ability of a firm to finance itself through external funds and to grow through corporate governance is affected by the financial activities organization (Chakraborty and Ray, 2006). Boot and Thakor (1997) assume that “agents within a bank can cooperate and coordinate their actions, whereas agents in a market compete”. Banks can be associated with project selection, identifying potential entrepreneurs and monitoring firms, while in a market-based financial system a deal is closed without a relationship between the borrower and the sponsor, and no control from the lender (Chakraborty et al., 2006).
Beck and Levine (2002) provide evidence that financing new projects that require high leverage is more effective when recurring to banks, since banks can bind to additional funding, when necessary, during the development of the project, besides the public information revealed in a market-based can have a bigger impact on stock prices during the process of the LBO.
Financial systems are not the only factor that is important, the legal system proved to be important as well, Allen and Gale (1999) pointed out that law controls the restrictions used on securities, the type of contracts and the governance mechanism for the firm, all being extremely relevant. Earlier studies from La Porta et al. (1997) indicated that countries with better legal protections could enable higher external finance with better conditions, with a higher value and broader capital markets. Later on, La Porta et al. (1998) enriched his research on legal protections finding common law countries to protect better its investors more than countries with civil law.
Gatti et al. (2013) claim that loans for projects in countries with stronger creditor rights, lower economic and political risks to have lower spreads. According to Colla et al. (2012) the bond markets play an important role in the capital structure of LBOs and consequently the type of the financial system. Deals in common law countries have a higher concentration of junior leverage and lower senior leverage.
2.5 Deal location and Regulation
Carey and Nini (2007) study the differences in interest rate spreads on syndicated loans to corporate borrowers, finding that syndicated loan credit spreads are significantly smaller in Europe than U.S., the author also refers that
this difference in spreads is not justified by differences in the borrower, loan and lender characteristics. There is a huge concentration of the transactions in syndicated loan credit spreads in the biggest markets, such as New York, Hong Kong, which lead to a larger home bias.
Another important determinant to be aware of is the type of law in the country where the transaction is dealt. There are common law countries, like U.S. and U.K, and for the rest of W.E. countries, they are on a civil law. Colla et al. (2012) find higher spreads in common law countries, 32 to 58 bps higher, justified by the use of a higher amount of junior debt by common law countries.
2.6 Pricing Determinants
Barclay and Smith (1995) demonstrate evidence confirming that regulated firms issue more long-term debt since regulation controls the underinvestment problem. A strong relationship between firm size and debt maturity is also present due to big firms issuing more long-term debt than the small firms, it was also identified a positive relationship between firm financial bond rating and debt maturity.
Sorge and Gadanecz (2004) found an important determinant of loan pricing, the interest rates.
Colla et al. (2012) study the structure and pricing of debt in LBOs, using a sample of 238 LBOs in the period of time between 1997 and 2008, of which 1,006 individual debt tranches are included. The author tested spreads at a tranche level proving that they increase with maturity. There is evidence that when macroeconomic factors are present, they can be used to explain tranche spreads since these increase with equity volatility and credit spreads, which goes accordingly to previous research made by Campbell and Taskler (2003). In
addition, it is proven that market conditions have a positive impact on the cost of LBO debt; longer maturity tranches have higher spreads; loan covenants decrease spreads and the size of the loan is not considered significant.
Ivashina and Kovner (2011), using a sample of 1,590 loans financing private equity sponsored leveraged buyouts between 1993 and 2005, study the advantage of private equity in LBO firms and relationship banking. The authors prove that lowering the information asymmetry, through repeated interactions between borrower and sponsor, has significant advantages for the sponsored one. It is proven that a higher bank relationship between a lead bank and an LBO firm results in lower loan spreads, this means that LBO firms can benefit from a lower cost of lending(covenants) and better loan terms than the LBO firms being sponsored by a lead bank with few or none previous transactions, since the asymmetry of information is reduced.
2.7 Determinants of Syndicated Loan Spreads
Kleimeier and Megginson (2000) find a positive relationship between spread and maturity for all syndicated loans, besides project finance. The authors find the direct relationship between the loan size, maturity, country risk, the country risk, the use of covenants in the loan contract and currency risk.
Ivashina and Kovner (2011) find that stronger bank relationships and higher potential for the cross-selling result in better loan terms when controlling for bank and LBO firm fixed effects.
In the literature about Project Finance loans, the authors determine PF loan pricing not having a positive function of maturity and loan size. Sorge and Gadanecz (2008), Marques et al. (2015) and Pinto et al. (2016) find that whereas spreads for both investment-grade and speculative-grade bonds are a positive
linear function of maturity, both studies demonstrate a ‘hump-shaped’ term structure in PF loans.
3. Research Question
In this section, we present our main research questions and respective explanation.
From the literature review of the previous section, some questions were raised. First, it is intended to study what maturity of syndicated loans in LBO’s are function of. Hence, is the study we try
What are the determinants of maturity in syndicated loans in LBO’s?
Next, it is intended to study if we can flatten the hump-shaped relationship between spreads and maturity using the EBITDA multiple under maturity. Sorge and Gadanecz (2008), Marques et al. (2015) and Pinto et al. (2016) find that a hump-shaped relationship between spread and maturity exists. We extend the analysis, observing spread relation to EBITDA multiple under maturity.
Furthermore, we study some determinants of spreads that will not be included as main analysis.
This chapter will explain how the database was assembled; the definition for what each variable stands for and their respective expected outcome, formed through analysis of previous literature; and to demonstrate a descriptive statistics and preliminary analysis of the sample used.
4.1 Data Description
The sample used subsists of individual loans extracted from Dealscan database – provided by Thomson Reuters LPC – covering the 2000-2016 period. The sample provides information about the micro characteristics of the loan and bond offers (e.g, transaction size, tranche size, maturity, currency, pricing, rating, type of interest rate) and of the sponsored (e.g, name, nationality, industry sector. Dealscan database contributes with detailed historical information on virtually the entire population of syndicated loans closed in international capital markets. Only loans with a deal specific purpose code of “leveraged buy-out” are used.
The macroeconomic variables were obtained from Datastream, which includes variables such as the level of interest rates, market volatility, and slope of the yield curve.
In this analysis, Dealscan data and Datastream data were complemented by hand-matching firms identification code in both databases by using the target name.
Finally, to study the impact of EBITDA multiple on LBO spreads, we included data from Damodaran database on U.S. and W.E. EBITDA multiples (e.g., EV/EBITDA, EV/EBIT, EV/EBITDARD). The data taken from Damodaran database was matched through Standard Industrial Classification (SIC Code).
The process was done manually, since the database provided had only industry name as an identifier, and many industries had minor variations of its name. In Damodaran database, there is available industry EBITDA multiples fo firms with positive EBITDA only and for “All firms”, we excluded multiples for
firms with only positive EBITDA since it is found negative EBITDA firms on the sample, therefore we use multiples suitable for “All firms”.
Our final sample includes 1,196 LBO loans closed between 2000 and 2016 worth $1,097,829 million. We are going to define this sample as the “full sample”, being the unit of observation a single deal.
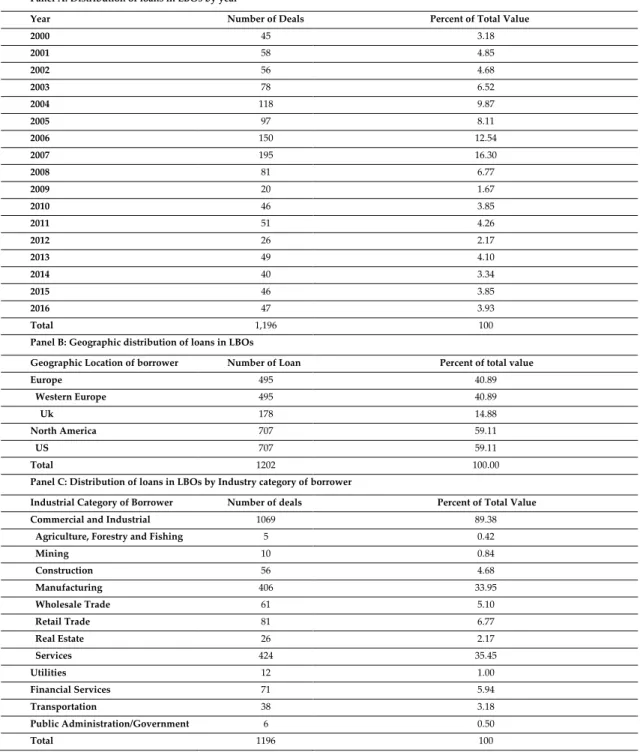
Table 1 demonstrates the distribution of loans in LBOs by year, borrower’s nationality and industry. Panel A represents the number of deals per year, we can observe a high concentration of deals between 2004 and 2007, dropping impressively after the 2007 financial crisis, 2007 is the most significant year in the sample representing 16.30 percentage points of the full sample, a huge percentage for a year in a 17 years sample.
Panel B indicates the borrower’s nationality. This sample covers only U.S. and W.E. region. We analyze 495 W.E. loans, corresponding to 40.89 percentage points of the sample, which 178 were located in the U.K. The majority of the sample (59.11 percentage points) represents 707 syndicated loans from U.S. borrowers.
Finally, in Panel C we can observe the distribution of the syndicated loans in LBOs by industrial category. Commercial and industrial category leads in number of loans, being the three major sub-category’s services (424 deals), manufacturing (406 deals) and retail trade (81 deals).
Table 1 Distribution of the full sample of loan deals in LBOs by year, borrower’s nationality and industry
Table 1 describes the distribution of the full sample of loan deals in LBOs across time (Panel A), borrower’s nationality (Panel B), and industry (Panel C). The first column details the number of deals while the second column displays the percentage of total value of deals.
Panel A: Distribution of loans in LBOs by year
Year Number of Deals Percent of Total Value
2000 45 3.18 2001 58 4.85 2002 56 4.68 2003 78 6.52 2004 118 9.87 2005 97 8.11 2006 150 12.54 2007 195 16.30 2008 81 6.77 2009 20 1.67 2010 46 3.85 2011 51 4.26 2012 26 2.17 2013 49 4.10 2014 40 3.34 2015 46 3.85 2016 47 3.93 Total 1,196 100
Panel B: Geographic distribution of loans in LBOs
Geographic Location of borrower Number of Loan Percent of total value
Europe 495 40.89 Western Europe 495 40.89 Uk 178 14.88 North America 707 59.11 US 707 59.11 Total 1202 100.00
Panel C: Distribution of loans in LBOs by Industry category of borrower
Industrial Category of Borrower Number of deals Percent of Total Value
Commercial and Industrial 1069 89.38
Agriculture, Forestry and Fishing 5 0.42
Mining 10 0.84 Construction 56 4.68 Manufacturing 406 33.95 Wholesale Trade 61 5.10 Retail Trade 81 6.77 Real Estate 26 2.17 Services 424 35.45 Utilities 12 1.00 Financial Services 71 5.94 Transportation 38 3.18 Public Administration/Government 6 0.50 Total 1196 100
4.2 Variables of the Model
This section will present an analysis and denotation of the variables used in the model. Starting with the explained variable and then the explanatory variables, divided into macroeconomics independent variables and microeconomic independent variables.
4.2.1 Dependent Variable - Spread
Spread represents spread paid to the borrower over LIBOR plus the facility
fee(AISD). AISD was used by Maskara (2010) as a dependent variable for its capability of holding an interest rate of the loan paid by the borrower to the lender. AISD has the disadvantage of not representing the full economic cost of credit(fees), although Berg et al. (2015) suggests the ‘total-cost-of-borrowing’(TCB), which accounts for fees and spreads.
4.2.2 Independent Variables
4.2.2.1 Microeconomic Independent Variables
Maturity denotes the maturity of the loan in years. This variable helps us to
understand how maturity influences the spread and the slope of the curve between this relationship (Kleimeier and Megginson, 2000; Colla et al. ,2012; Gatti et al. ,2013; Ivashina and Kovner ,2011; Marques et al. ,2015)
Log transaction size denotes the natural log of the loan transaction size.
Pinto et al. (2016) use this variable to understand the determinants of spreads, the variable has an expected negative relationship with the dependent variable.
Number of tranches is the number of loans per deal. Maskara (2010) points
that riskier borrowers benefit from tranching syndicated loans having lower credit spreads than similar non-tranched loans.
Term loan denotes a dummy variable that takes value of 1 if the loan is a term
loan and 0 if it is a credit line. Berg et al. (2015) finds a possible way of computing “total- cost-off-borrowing”.
Fixed Rate denotes a dummy variable that takes value of 1 if the loan has a
credit rating and 0 otherwise. According to Sorge and Gadanecz (2008) study, the majority of bonds are fixed rate while loans are priced over floating base rate. The usage of fixed rate instead of floating rate has a significant discount on the pricing because of the insurance of the future interest rates of floating rate.
Currency Risk denotes a dummy variable that takes value of 1 if the loan is
denominated in a currency that is different from the borrower home country. Kleimeier and Megginson (2000) point out the relationship between loan spreads and currency risk such as other variables. The currency risk has a significantly negative impact on the dependent variable.
EBITDA Multiple denotes the EV/EBITDA Ratio of the borrower. Colla et al.
(2011) confirm the significant role that practitioners refer as EBITDA multiples in LBO lending (Rosenbaum and Pearl, 2009), additionally, market-to-book and cash flow volatility are also significant determinants of capital structure, according to previous evidence provided by studies on public firms.
4.2.2.2 Macroeconomic Independent Variables
Country risk denotes the country credit rating at close of SP’s. This variable
measure from 1 for the countries with lowest risk(AAA=1) to 22 for the countries of higher risk.
Corielli et al (2012) finds a strong correlation between the SP’s measures and the alternative) monthly data compiled by the International Country risk guide of the country risk rank provided by Europeans).
Volatility denotes The Chicago Board Options Exchange Volatility index
(VIX). VIX mirrors market estimate of future volatility. A significant and positive relationship between market volatility and spreads is pointed out by Colla et al. (2012). Marques et al. (2015), studying project finance credit spreads finds an insignificant relationship.
5yTB-3mTB denotes the yield curve slope. It was obtained as the difference
between U.S. five year Treasury Bond and the U.S. three month treasury bond. Marques et al. (2015) find spread and the yield curve is associated with lower spreads.
Common law denotes a dummy variable that takes value of 1 if the loan is
extended to a borrower located in a country with a common law legal regime and 0 otherwise. Colla et al. (2012) results indicate that loans settled in countries with a common law legal system are associated with higher spreads than civil law countries.
Market-Based denotes a dummy variable that takes value of 1 if the loan is
extended to a borrower located in a country with market-based law legal regime and 0 otherwise.
Crisis denotes a dummy variable that takes value of 1 if the closing date
belongs to the crisis period and 0 otherwise. An increase in spreads for loans in PF was noticed by Marques et al. (2015), having has cause the 2007-2008 financial crisis and the subsequent European sovereign debt crisis.
4.3 Descriptive Statistics
In this section, we can observe an analysis, for the full sample, regarding the performance of the variables of interest, including the contractual characteristics of loans in LBOs.
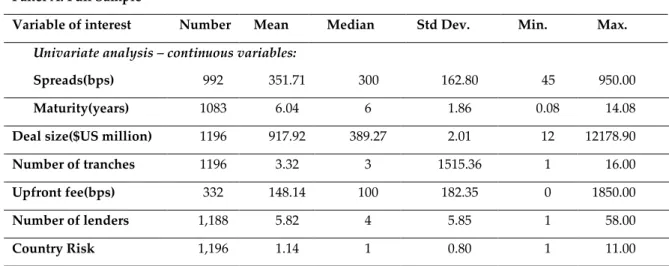
Panel A represents the full sample, consisting of 1,196 deals used in the regression analysis. The mean (median) of spreads is 351.71 bps (300 bps) and the mean (median) for maturity is 6.00 years. Each deal has on average 3.32 tranches (number of trances), the mean of deal size is $917.92 million and each loan as on average 5.82 lenders (sponsors). The country risk mean (median) is 1.14(1) indicating that the spread of each loan has on average a credit rating of AAA=Aaa=1. The probability of a loan being term loan instead of a credit line is 63.46%. The probability of existing currency risk in a LBO syndicated loan is 7.94%, which is low. There is also an extremely low (1.49%) probability of having a fixed rate loan, and they are very secured by 97.25% of the time in the sample.
Table 2: Contractual characteristics of syndicated loans in LBOs
Panel A: Full Sample
Variable of interest Number Mean Median Std Dev. Min. Max.
Univariate analysis – continuous variables:
Spreads(bps) 992 351.71 300 162.80 45 950.00
Maturity(years) 1083 6.04 6 1.86 0.08 14.08
Deal size($US million) 1196 917.92 389.27 2.01 12 12178.90
Number of tranches 1196 3.32 3 1515.36 1 16.00
Upfront fee(bps) 332 148.14 100 182.35 0 1850.00
Number of lenders 1,188 5.82 4 5.85 1 58.00
Country Risk 1,196 1.14 1 0.80 1 11.00
Univariate analysis – dummy variables
N. of issues with data available N. of issues with dummy = 1 % of total available data Term loan 1,196 759 63.46 Currency Risk 1,196 95 7.94 Fix Rate 1,007 15 1.49 Secured 1,055 1,026 97.25
Table 2 presents summary statistics for the full sample of loans in LBOs.
4.4 Preliminary Analysis
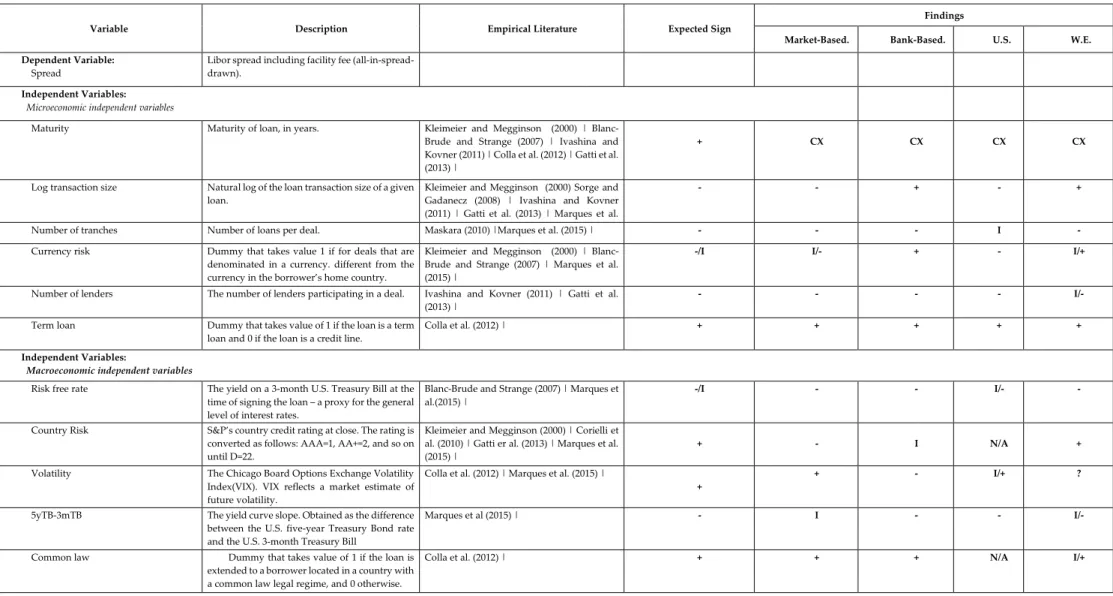
We do an estimation of the expected sign for each variable in our sample divided into two sub-samples (Market-based versus Bank-Based financial systems and U.S. versus W.E.), as shown in Table 3.
In the microeconomic independent variables, the only variable that is expected to have an insignificant impact on the spread is Fixed Rate. Volatility and Common law also are expected to have an insignificant impact on the spread, regarding macroeconomic variables. Concerning the Acquired firms’ characteristics, all the
variables except Fixed assets to total assets are expected to have an insignificant impact.
Maturity has a convex relationship for all the sub-samples having a significant impact on the spreads.
Regarding sub-sample U.S., the variables Number of tranches, Log total assets, Debt to total assets and Short-term debt to total debt have an insignificant impact on spread. The sub-sample W.E. had a diverging impact on the insignificant variables for U.S. sub-sample, having an impact on the spread. Although, the variables Fixed rate, Common Law, Market-Based, Log total assets, Debt to total assets, Market to book ratio, Return on assets have an insignificant impact on the spread. It is only expected for the acquired firms’ characteristics to only have impact on the spread for the sub-samples market-based and U.S.
Table 3: Definition of variables, expected sign, and findings
Variable Description Empirical Literature Expected Sign
Findings
Market-Based. Bank-Based. U.S. W.E.
Dependent Variable:
Spread
Libor spread including facility fee (all-in-spread-drawn).
Independent Variables: Microeconomic independent variables
Maturity Maturity of loan, in years. Kleimeier and Megginson (2000) | Blanc-Brude and Strange (2007) | Ivashina and Kovner (2011) | Colla et al. (2012) | Gatti et al. (2013) |
+ CX CX CX CX
Log transaction size Natural log of the loan transaction size of a given loan.
Kleimeier and Megginson (2000) Sorge and Gadanecz (2008) | Ivashina and Kovner (2011) | Gatti et al. (2013) | Marques et al. (2015) |
- - + - +
Number of tranches Number of loans per deal. Maskara (2010) |Marques et al. (2015) | - - - I -
Currency risk Dummy that takes value 1 if for deals that are denominated in a currency. different from the currency in the borrower’s home country.
Kleimeier and Megginson (2000) | Blanc-Brude and Strange (2007) | Marques et al. (2015) |
-/I I/- + - I/+
Number of lenders The number of lenders participating in a deal. Ivashina and Kovner (2011) | Gatti et al. (2013) |
- - - - I/-
Term loan Dummy that takes value of 1 if the loan is a term loan and 0 if the loan is a credit line.
Colla et al. (2012) | + + + + +
Independent Variables:
Macroeconomic independent variables
Risk free rate The yield on a 3-month U.S. Treasury Bill at the time of signing the loan – a proxy for the general level of interest rates.
Blanc-Brude and Strange (2007) | Marques et al.(2015) |
-/I - - I/- -
Country Risk S&P’s country credit rating at close. The rating is converted as follows: AAA=1, AA+=2, and so on until D=22.
Kleimeier and Megginson (2000) | Corielli et al. (2010) | Gatti er al. (2013) | Marques et al. (2015) |
+ - I N/A +
Volatility The Chicago Board Options Exchange Volatility Index(VIX). VIX reflects a market estimate of future volatility.
Colla et al. (2012) | Marques et al. (2015) |
+
+ - I/+ ?
5yTB-3mTB The yield curve slope. Obtained as the difference between the U.S. five-year Treasury Bond rate and the U.S. 3-month Treasury Bill
Marques et al (2015) | - I - - I/-
Common law Dummy that takes value of 1 if the loan is extended to a borrower located in a country with a common law legal regime, and 0 otherwise.
(continued)
Variable Description Empirical Literature Expected Sign Findings
Market-based Bank-B.ased U.S. W.E
Dependent Variable:
Spread
Libor spread including facility fee (all-in-spread-drawn).
Independent Variables:
Microeconomic variables
Market-Based Dummy that takes value of 1 if the loan is extended to a borrower located in a country with a market-based financial system, and 0 otherwise.
N/A N/A N/A N/A I/+
Crisis Dummy equal to 1 if the closing date belongs to the crisis period, and 0 otherwise
Colla et al.(2012) | Marques et al.(2015) | + + + + +
EV/EBITDA Industry EBITDA Multiple ? ? ? ? ?
Independent Variables: Acquired firms’ characteristics
Log total assets Maturity of loan, in years. Kleimeier and Megginson (2000) | Blanc-Brude and Strange (2007) | Ivashina and Kovner (2011) | Colla et al. (2012) | Gatti et al. (2013) |
- I I I I
Debt to total assets Natural log of the loan transaction size of a given loan.
Kleimeier and Megginson (2000) Sorge and Gadanecz (2008) | Ivashina and Kovner (2011) | Gatti et al. (2013) | Marques et al. (2015) |
? I/+ I/+ I/+ I/+
Short-term debt to total debt Number of loans per deal. Maskara (2010) |Marques et al. (2015) | + I I I I
Fixed assets to total assets Dummy that takes value 1 if for deals that are denominated in a currency different from the currency in the borrower’s home country.
Kleimeier and Megginson (2000) | Blanc-Brude and Strange (2007) | Marques et al. (2015) |
- - - I/- -
Market to book ratio The number of lenders participating in a deal. Ivashina and Kovner (2011) | Gatti et al. (2013) | - - I/- I/- I/-
Return on assets Dummy that takes value of 1 if the loan is a term loan and 0 if the loan is a credit line.
Colla et al. (2012) | - I I I I
. The following characters mean: - = negative impact on spread | + = positive impact on spread | I = insignificant impact on spread | ? = sign cannot be clearly determined | CX = convex relationship | N/A = not applicable.
5. Methodology
A 1,196 deals sample, closed during the 2000-2016 period, was selected for the study of the pricing determinants in LBOs. In this database, there is present observations of the same variables for different countries, firms, financial systems and law enforcements at different points across time, allowing to analyze and have a better control of heteroscedasticity and less collinearity.
We use an OLS regression with the following model, to estimate the determinants of loan pricing:
(1) 𝑆𝑝𝑟𝑒𝑎𝑑𝑖 = 𝛼 +𝛽1𝑀𝑎𝑡𝑢𝑟𝑖𝑡𝑦𝑖 +𝛽2𝐿𝑜𝑔 𝑡𝑟𝑎𝑛𝑠𝑎𝑐𝑡𝑖𝑜𝑛 𝑠𝑖𝑧𝑒𝑖 + 𝛽3𝐿𝑜𝑔 𝐿𝑜𝑎𝑛 𝑠𝑖𝑧𝑒 𝑡𝑜 𝑑𝑒𝑎𝑙 𝑠𝑖𝑧𝑒𝑖 +𝛽4𝑁𝑢𝑚𝑏𝑒𝑟 𝑜𝑓 𝑡𝑟𝑎𝑛𝑐ℎ𝑒𝑠𝑖 +𝛽5𝐶𝑢𝑟𝑟𝑒𝑛𝑐𝑦 𝑅𝑖𝑠𝑘𝑖 +𝛽6𝑁𝑢𝑚𝑏𝑒𝑟 𝑜𝑓 𝑙𝑒𝑛𝑑𝑒𝑟𝑠𝑖
+𝛽7𝐹𝑖𝑥𝑒𝑑 𝑟𝑎𝑡𝑒𝑖 +𝛽8𝑇𝑒𝑟𝑚 𝑙𝑜𝑎𝑛𝑖 + 𝛽9𝑅𝑖𝑠𝑘 𝑓𝑟𝑒𝑒 𝑟𝑎𝑡𝑒𝑖 +𝛽10𝐶𝑜𝑢𝑛𝑡𝑟𝑦 𝑅𝑖𝑠𝑘𝑖 + 𝛽11𝑉𝑜𝑙𝑎𝑡𝑖𝑙𝑖𝑡𝑦𝑖 + 𝛽12𝑇𝐵5𝑦 −𝑇𝐵3𝑚𝑖 +𝛽13𝐶𝑟𝑖𝑠𝑖𝑠𝑖 + 𝛽14EBITDA Multiple𝑖 + 𝜀𝑖
This model aims to help find the effect of EBITDA Multiple in the study of spread determinants, as well as the differences between spreads from the different sub-samples (Market-Based vs Bank-Based and U.S. vs W.E.), as well as helping to study further the term structure of this spreads.
6. Results
In this section, we analyze the results from our OLS regressions comparing to the previous literature.
6.1 Results of the regression analysis
6.1.1 Pricing of loans in integrated markets
In order to examine if the spreads on loans closed in Market-based and Bank-based financial systems we used the first equation displayed in chapter 5, we distinguish this two financial systems using a dummy variable that takes value of 1 for observations in a market-based financial system and 0 when they are extended to a bank-based financial system. We also add a control variable to separate legal systems impact, a dummy variable designed as common law, which takes value of 1 if loans are extended to common law countries and 0 if loans are extended to civil law countries. The regression has a control for fixed effects for region and industry.
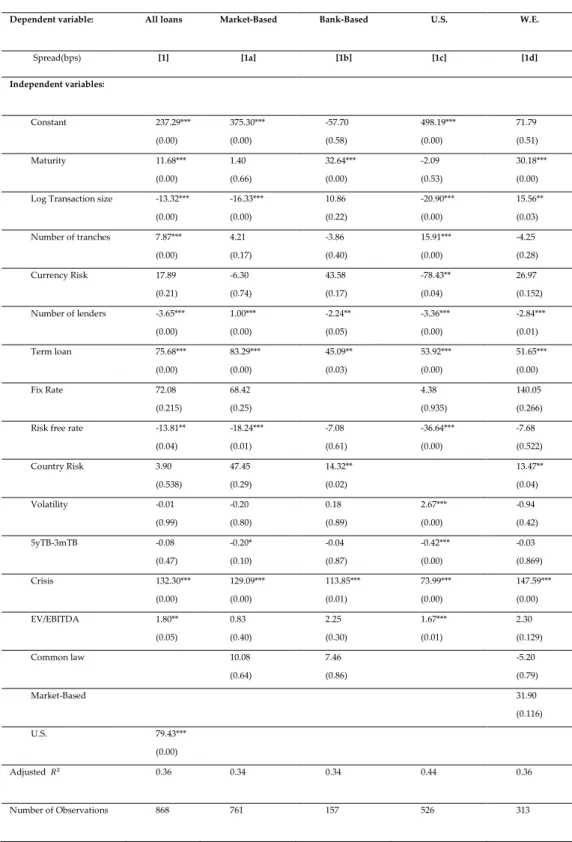
In Table 4 we can find the regression analysis of the determinants of credit spreads for the previously mentioned model. In the first column we have the regression for all loans of our sample (U.S. and W.E. loans), where we include a U.S. dummy variable, then divided into sub-samples: (model [1a]) Market-based financial systems; (model [1b]) Bank-Based financial systems; (model [1c]) U.S.; (model [1d]) W.E. We control for fixed-effects variables region and industry in all these estimations.
The results of model [1], estimation for a sample of 868 deals (526 deals extended to U.S. borrowers and 313 deals extended to W.E. borrowers), suggest that loans extended to U.S. borrowers have higher credit spreads (79.43 bps) than
loans extended to W.E. borrowers. An increase of 1 unit in EV/EBITDA doesn’t have much impact on spreads for this sample, increasing the spreads by 1.80 bps while other variables remain constant.
Regarding sub-samples (model [1c] and model [1d]), this result does not change. EV/EBITDA continues to have an insignificant impact on credit spreads, showing a positive relationship of 1.67 bps in model [1c] and a positive relationship of 2.30 bps in model [1d]. In model [1d], the variable common law was created to represent U.K., which is unexpected to have a negative impact on credit spreads, since common law countries are associated to higher spreads.
Table 4: Regression analyses of the determinants of credit spreads
Dependent variable: All loans Market-Based Bank-Based U.S. W.E.
Spread(bps) [1] [1a] [1b] [1c] [1d] Independent variables: Constant 237.29*** (0.00) 375.30*** (0.00) -57.70 (0.58) 498.19*** (0.00) 71.79 (0.51) Maturity 11.68*** (0.00) 1.40 (0.66) 32.64*** (0.00) -2.09 (0.53) 30.18*** (0.00) Log Transaction size -13.32***
(0.00) -16.33*** (0.00) 10.86 (0.22) -20.90*** (0.00) 15.56** (0.03) Number of tranches 7.87*** (0.00) 4.21 (0.17) -3.86 (0.40) 15.91*** (0.00) -4.25 (0.28) Currency Risk 17.89 (0.21) -6.30 (0.74) 43.58 (0.17) -78.43** (0.04) 26.97 (0.152) Number of lenders -3.65*** (0.00) 1.00*** (0.00) -2.24** (0.05) -3.36*** (0.00) -2.84*** (0.01) Term loan 75.68*** (0.00) 83.29*** (0.00) 45.09** (0.03) 53.92*** (0.00) 51.65*** (0.00) Fix Rate 72.08 (0.215) 68.42 (0.25) 4.38 (0.935) 140.05 (0.266) Risk free rate -13.81**
(0.04) -18.24*** (0.01) -7.08 (0.61) -36.64*** (0.00) -7.68 (0.522) Country Risk 3.90 (0.538) 47.45 (0.29) 14.32** (0.02) 13.47** (0.04) Volatility -0.01 (0.99) -0.20 (0.80) 0.18 (0.89) 2.67*** (0.00) -0.94 (0.42) 5yTB-3mTB -0.08 (0.47) -0.20* (0.10) -0.04 (0.87) -0.42*** (0.00) -0.03 (0.869) Crisis 132.30*** (0.00) 129.09*** (0.00) 113.85*** (0.01) 73.99*** (0.00) 147.59*** (0.00) EV/EBITDA 1.80** (0.05) 0.83 (0.40) 2.25 (0.30) 1.67*** (0.01) 2.30 (0.129) Common law 10.08 (0.64) 7.46 (0.86) -5.20 (0.79) Market-Based 31.90 (0.116) U.S. 79.43*** (0.00) Adjusted 𝑅2 0.36 0.34 0.34 0.44 0.36 Number of Observations 868 761 157 526 313
Table 4 presents the results of OLS regressions analyzing the determinants of loan credit spread. Model [1] reflects the sample of 1,196 deals with specific purpose code of “leveraged buy-out”. Models [1a] and [1b] separates the 1,196 deals sample into the estimation for borrowers extended market-based deals and borrowers extended to bank-based deals. Models [1c] and [1d] are estimated for two sub-samples created according to whether the borrower is located in U.S. or the W.E. Common law equals 1 if the loan is extended to a borrower in a common law country, and 0 otherwise. For each independent variable, the first row reports the estimated coefficient and the second row reports the p-value. Coefficients were estimated based on heteroskedasticity-consistent standard errors clustered by deal. ***, ** and * denote statistical significance at the 1%, 5% and 10% levels, respectively. We controlled for industry and loan type fixed-effects. For a definition of the variables, see Section 4 or Table 4
6.1.2 Determinants of spreads for the sample
This section will analyze the characteristics that affect credit spread in our samples.
Back to Table 5, models [1a] and [1b] display loan pricing regression results for a sample of 761 deals extended to borrowers in market-based and 167 deals extended to borrowers in bank-based financial systems. In models [1c] and [1d] we have present the impact of common pricing factors on credit spreads for loans extended to U.S. borrowers with a sample of 526 deals and a sample of 313 deals for loans extended to W.E. borrowers.
Maturity shows a positive relationship to spreads, except for the U.S. sub-sample (model [1c]), a loan extended to W.E. borrower is suggested to have an increase on the credit spreads of 30.18 bps per year longer than the mean, while a loan extended to a U.S. borrower will decrease 2.09 bps per year longer than the mean.
Concerning Log transaction size, we observe a negative relationship of 20.90 bps in the U.S. sub-sample contrasting to a positive relationship of 15.56 bps in the W.E. sub-sample. Loans extended to bank-based are more concentrated in larger deals, leading to banks applying a higher spread to compensate the larger portion in bank loan portfolios.
The number of tranches impact in credit spreads is positive for Market-based financial system influencing spread by 4.21 bps. The same relationship is observed in the U.S. sub-sample where this impact is more visible with a positive relationship on the spread of 15.91 bps. In the Bank-based sub-sample, there is a negative relationship of 3.86, which is not very significant, and in the W.E. sub-sample, there is also a negative relationship of 4.25 bps in spread.
Currency risk is significant in the U.S. representing a negative relationship of 78.43 bps for loans closed in other currency than $US, this relationship is softer
on Market-based financial systems having a negative impact of just 6.30bps. The impact is positive in Bank-based and W.E. samples.
The number of lenders has a significant and negative impact on all samples except for Market-Based sub-sample, where a positive relationship of 1.00 bps is observed. The number of lenders is associated with risk default since the higher is the number of lenders the lower is the risk of default.
Regarding Term Loan all the coefficients are positive and significant for all the sub-samples, indicating a higher spread in term loans when compared to credit lines.
The Risk free rate has a negative impact on all sub-samples, the most relevant one is in the U.S. sub-sample having an impact of 36.64 bps on spread. On the other hand Country Risk estimation has a positive impact in loans for all samples, being significant in Bank-based and W.E. sub-sample.
Volatility is significant and positive in U.S. sub-sample increasing spreads in 2.67 bps. Our coefficient of the yield curve slope (5yTB-3mTB) is significant for the U.S. sample as well, impacting negatively spread in 0.42 bps.
The variable crisis, which identifies the 2007-2008 financial crisis period and the subsequent European sovereign debt crisis, has a significant impact for loans in LBOs. It is possible to observe a positive relationship in all the sub-samples, for example the W.E. sub-sample has a positive impact on spreads of 147.59 bps. EV/EBITDA has a positive and significant impact in the U.S. sub-sample, when the industry EBITDA multiple increases it’s value in 1 unit while other variables remain constant spreads go up by 1.67 bps.
Finally, common law variable has not been found significant in any sub-samples, as well as the variable market-based implying that the financial systems in the W.E. sub-sample have no impact on spread.
It is possible to conclude that borrowers located in U.S. and market-based financial systems have in general lower loan credit spreads when compared to
bank-based financial systems and W.E. We find a negative relationship with spread in all sub-samples for risk free rate, and maturity, log transaction size, currency risk, number of lenders and yield curve slope (5yTB-3mTB), all have a negative impact in U.S. borrowers extended loans.
6.1.3
The term structure of spreads
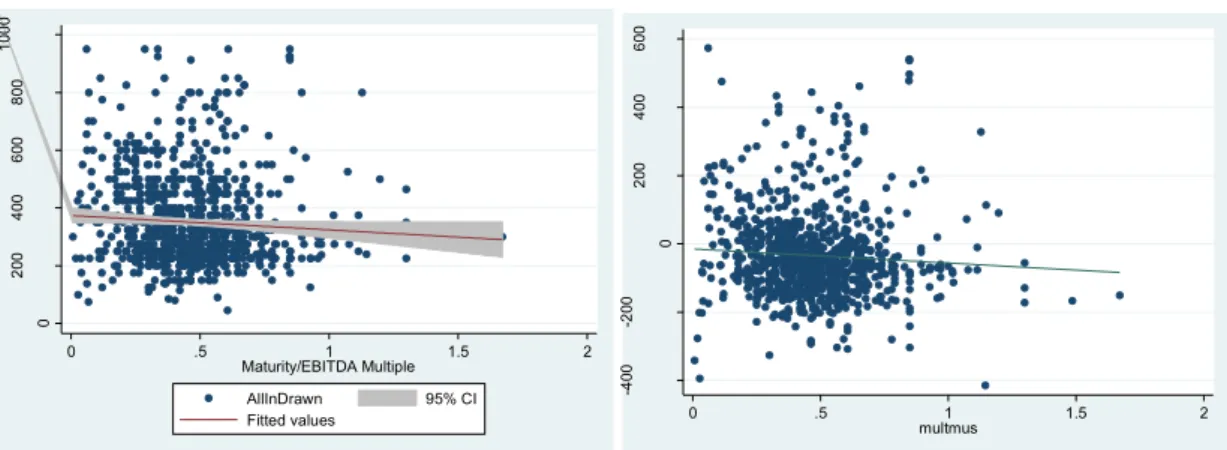
Recently, Sorge and Gadanecz (2008) and Marques et al. (2015) identified a hump-shape term structure of credit spreads for project finance loans, explained by the lack of liquidity in the short-term and the liquidity risk increase of spreads in the long-term, which can also be similar and applied to LBO loans. In this section we try to study further this evidence, by observing the relationship between spreads and maturity/multiple, and see if this
hump-shape becomes flat.
We could observe that in the sample “All loans” the relationship between spread and our maturity/EBITDA multiple is negative, but flat, with just a slight slope . The same relationship is found in the U.S. sample. In the W.E. sub-sample the relationship is positive, although it is still flatter than the relationship between spread and maturity and has a slight slope.
Figure 1: The term structure of credit spreads
Term structure of credit spreads – All loans
Term structure of credit spreads – Loans extended to U.S. borrowers
Term structure of credit spreads – Loans extended to W.E. borrowers
Graphs A, C and E plots credit spread against maturity/EBITDA multiple, it plots the prediction from a quadratic regression and adds the confidence interval on the basis of the standard error of forecast. Graphs B, D and F presents the augmented component-plus-residual plot based on models [1], [1c] and [1d], when the maturity/EBITDA multiple is added, and depicts the partial relationship between credit and maturity/EBITDA multiple to the regression model. The line reflects the fitting process based on non-parametric regression called local weighted scatterplot smoothing. 0 2 00 4 00 6 00 8 00 1 00 0 Sp re a d(b ps) 0 .5 1 1.5 2 Maturity/EBITDA Multiple AllInDrawn 95% CI Fitted values -4 00 -2 00 0 2 00 4 00 6 00 Au gme nt ed co mp o ne nt p lu s re si d ua l 0 .5 1 1.5 2 multmus 0 2 0 0 4 0 0 6 0 0 8 0 0 1 0 0 0 Sp re a d (b p s) 0 .5 1 1.5 Maturity/EBITDA Multiple AllInDrawn 95% CI Fitted values -4 00 -2 00 0 2 00 4 00 6 00 Au gme nt ed co mp o ne nt p lu s re si d ua l 0 .5 1 1.5 matmultus 0 2 00 4 00 6 00 8 00 1 00 0 Sp re a d(b ps) 0 .5 1 1.5 Maturity/EBITDA Multiple AllInDrawn 95% CI Fitted values -2 00 0 2 00 4 00 6 00 Au gme nt ed co mp o ne nt p lu s re si d ua l 0 .5 1 1.5 matmultwe
7. The impact of acquired firms’ characteristics on spreads
and pricing processes
In this section, we present a univariate and multivariate analysis. Ivashina and Kovner (2011) indicate that firms’ characteristics have an influence on spreads.
7.1 Univariate Analysis
In order to do this analysis, we hand-matched firm codes of the database samples. Our sample for this analysis consists of 135 deals closed between 2000 and 2016, extended to borrowers in U.S. and W.E. The firms’ characteristics we use in this section as explanatory variables will consist of Total assets, Debt to total assets, Short-term debt to total debt, Fixed assets to total assets, Market-to-book ratio and Return on assets.
We use firm size (total assets) and market-to-book as alternative variables for the asymmetric information problem. Spreads tend to be higher in deals with firms with more information asymmetry with their sponsors. Smith and Watts (1992) find capital expenditures/value ration as an alternative to represent the cash flow of the firms’ activity, therefore we use market-to-book ratio variable as a measure to the firms’ potential growth and cash flow.
As an alternative to borrower’s potential level of financial constraint we use both debt to total assets and short-term debt to total debt, Ivashina and Kovner(2011) studies demonstrate a significant relationship between spreads and leverage. Although, an insignificant negative relation between spreads and leverage is shown by Colla et al. (2012). The variable Fixed assets to total assets reflect the value of firms’ liquidation, being relevant to use as a proxy for asset tangibility.
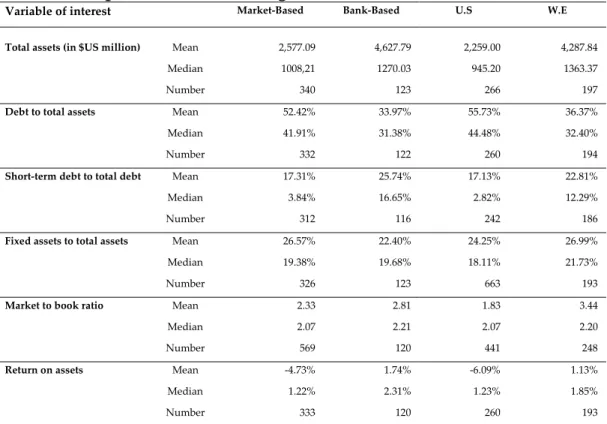
In Table 7 we can observe the characteristics of public firms acquired as LBO transactions. A descriptive analysis is displayed on the deals and divided into sub-samples, separating the sample in market-based and bank base financial systems as well as U.S. and W.E.
The sample is constituted with bigger firms from W.E. and bank-based financial system than the U.S. and market-based financial system. It is present a higher short-term debt to total debt ratio in countries with a bank-based financial system and W.E. countries, which goes accordingly to the higher credit spreads. The asset tangibility, observed through fixed assets to total assets, is higher in W.E. and market-based financial systems, although it is pretty close between all samples varying its mean from 22.40% and 26.99%.
Market-to-book ratio is also higher in countries from W.E. and bank-based financial systems, which was not expected, this represents that W.E. and bank-based financial systems firms’, in our sample, have a higher potential of growth.
Finally, return on assets is negative in both market-based and U.S., while it is positive in bank-based financial systems and W.E.
Table 5: Descriptive statistics for target firms
Variable of interest Market-Based Bank-Based U.S W.E Total assets (in $US million) Mean 2,577.09 4,627.79 2,259.00 4,287.84
Median 1008,21 1270.03 945.20 1363.37
Number 340 123 266 197
Debt to total assets Mean 52.42% 33.97% 55.73% 36.37%
Median 41.91% 31.38% 44.48% 32.40%
Number 332 122 260 194
Short-term debt to total debt Mean 17.31% 25.74% 17.13% 22.81%
Median 3.84% 16.65% 2.82% 12.29%
Number 312 116 242 186
Fixed assets to total assets Mean 26.57% 22.40% 24.25% 26.99%
Median 19.38% 19.68% 18.11% 21.73%
Number 326 123 663 193
Market to book ratio Mean 2.33 2.81 1.83 3.44
Median 2.07 2.21 2.07 2.20
Number 569 120 441 248
Return on assets Mean -4.73% 1.74% -6.09% 1.13%
Median 1.22% 2.31% 1.23% 1.85%
Number 333 120 260 193
Table 5 reports characteristics of public firms that were acquired via a LBO transaction. Our sample includes 453 deals closed in the U.S. and W.E. between 2000 and 2016. We created two sub-samples according wether to firms are located in market-based (333 deals) or bank-based (120 deals) financial systems, in the U.S. (260 deals) or in W.E. (161 deals). Each cell contains means and paranthetic medians.
7.2 Multivariate Analysis
For the multivariate analysis, we dropped the variable Fix Rate due to collinearity issues and we include firm characteristics as control variables.
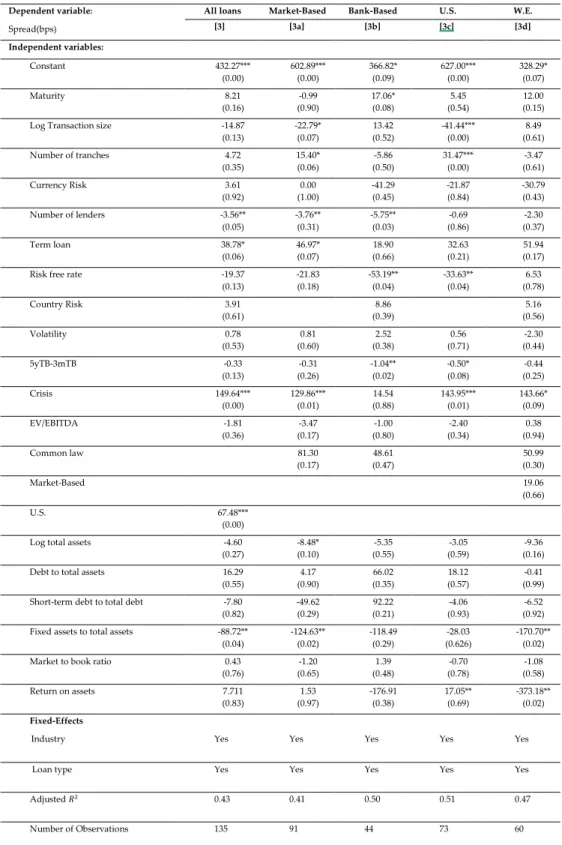
Table 9 represents the regression of LBO purpose loans credit spreads, using equation (1), with the firms’ characteristics as control variables, the sample represents 135 deals and it’s divided into different sub-samples: Market-based (model[3a]), Bank-Based (model[3b]), U.S. (model[3c]) and W.E. (model[3d]).
The results obtained in model(3) are different from the ones of category 6.1.2., in this model maturity is only significant for bank-based sub-sample, the coefficient has a positive relationship with the spread, issuing a loan, with an original maturity one year longer than the mean, increases spread by 17.06 bps. Log transaction size become insignificant in W.E. sub-sample, being although significant in the U.S. sub-sample, having a negative impact on spreads. The number of tranches become significant for market-based sub-sample with a positive relationship with spreads, as well as for the U.S. sub-sample. We can observe a significant and negative relationship between the number of lenders and spreads in the sub-samples market-based and bank-based, being insignificant in U.S. and W.E. sub-samples. Risk free rate variable has a negative impact on spreads, only significant for bank-based(53.19 bps) and U.S.(33.63 bps) sub-samples. The yield curve slope(5yTB-3mTB) presents now some significance for bank-based sub-sample contrasting to the previous results. Crisis is still significant for most of the sub-samples, with exception for bank-based fnancial systems.
Now analyzing the new added variables we can conclude that firm size ( log total assets) has a negative impact on spreads on countries with a bank-based financial system of 8.48 bps, being insignificant for all other models. Fixed assets to total assets variable is significant and has a negative relationship in model(3a)
and (3d). Return on assets shows significance in both U.S. and W.E. sub-samples, although that it has a positive impact of 17.05 bps on spreads for the U.S. and a negative impact of 373.18 bps on spreads for loans extended to W.E. borrowers.
Finally, variables Currency risk, Country risk, Volatility, EV/EBITDA, Common law, Market-based, Debt to total assets, Short-term debt to total assets and Market-to-Book ratio proved to be insignificant in this regression.
Table 6: Regression analyses of the determinants of credit spreads: the impact of acquired firms’ characteristics
Dependent variable:
Spread(bps)
All loans Market-Based Bank-Based U.S. W.E.
[3] [3a] [3b] [3c] [3d] Independent variables: Constant 432.27*** (0.00) 602.89*** (0.00) 366.82* (0.09) 627.00*** (0.00) 328.29* (0.07) Maturity 8.21 (0.16) -0.99 (0.90) 17.06* (0.08) 5.45 (0.54) 12.00 (0.15) Log Transaction size -14.87
(0.13) -22.79* (0.07) 13.42 (0.52) -41.44*** (0.00) 8.49 (0.61) Number of tranches 4.72 (0.35) 15.40* (0.06) -5.86 (0.50) 31.47*** (0.00) -3.47 (0.61) Currency Risk 3.61 (0.92) 0.00 (1.00) -41.29 (0.45) -21.87 (0.84) -30.79 (0.43) Number of lenders -3.56** (0.05) -3.76** (0.31) -5.75** (0.03) -0.69 (0.86) -2.30 (0.37) Term loan 38.78* (0.06) 46.97* (0.07) 18.90 (0.66) 32.63 (0.21) 51.94 (0.17)
Risk free rate -19.37
(0.13) -21.83 (0.18) -53.19** (0.04) -33.63** (0.04) 6.53 (0.78) Country Risk 3.91 (0.61) 8.86 (0.39) 5.16 (0.56) Volatility 0.78 (0.53) 0.81 (0.60) 2.52 (0.38) 0.56 (0.71) -2.30 (0.44) 5yTB-3mTB -0.33 (0.13) -0.31 (0.26) -1.04** (0.02) -0.50* (0.08) -0.44 (0.25) Crisis 149.64*** (0.00) 129.86*** (0.01) 14.54 (0.88) 143.95*** (0.01) 143.66* (0.09) EV/EBITDA -1.81 (0.36) -3.47 (0.17) -1.00 (0.80) -2.40 (0.34) 0.38 (0.94) Common law 81.30 (0.17) 48.61 (0.47) 50.99 (0.30) Market-Based 19.06 (0.66) U.S. 67.48*** (0.00)
Log total assets -4.60
(0.27) -8.48* (0.10) -5.35 (0.55) -3.05 (0.59) -9.36 (0.16)
Debt to total assets 16.29
(0.55) 4.17 (0.90) 66.02 (0.35) 18.12 (0.57) -0.41 (0.99) Short-term debt to total debt -7.80
(0.82) -49.62 (0.29) 92.22 (0.21) -4.06 (0.93) -6.52 (0.92) Fixed assets to total assets -88.72**
(0.04) -124.63** (0.02) -118.49 (0.29) -28.03 (0.626) -170.70** (0.02)
Market to book ratio 0.43
(0.76) -1.20 (0.65) 1.39 (0.48) -0.70 (0.78) -1.08 (0.58) Return on assets 7.711 (0.83) 1.53 (0.97) -176.91 (0.38) 17.05** (0.69) -373.18** (0.02) Fixed-Effects
Industry Yes Yes Yes Yes Yes
Loan type Yes Yes Yes Yes Yes
Adjusted 𝑅2 0.43 0.41 0.50 0.51 0.47
Number of Observations 135 91 44 73 60
Table 6 presents the results of OLS regressions analyzing the determinants of loan credit spread. Model [3] represent our 135 deals sample with specific purpose code of “leveraged buy-out”. Models [3a] and [3b] focus on sub-samples created according to whether the loan is arranged to a borrower in a market-based or bank-based financial system. Models [3c] and [3d] are estimated for two sub-samples created according to whether the borrower is located in W.E. or the U.S. Common law equals 1 if the loan is extended to a borrower in a common law country, and 0 otherwise. Market-based equals 1 if the loan is extended to a borrower located in a market-based financial system. U.S. equals 1 if the loan is extended to a borrower located in the U.S. and 0, otherwise. For each independent variable, the first row reports the estimated coefficient and the second row reports the p-value. Coefficients were estimated based on
heteroskedasticity-consistent standard error clustered by deal. ***, ** and * denote statistical significance at the 1%, 5% and 10% levels, respectively. We controlled for industry and loan type fixed-effects. For a definition of the variables, see Section 4 or Table 4.
8. Determinants of Maturity
In this section, we try to find the determinants of maturity in loans with LBO purpose.
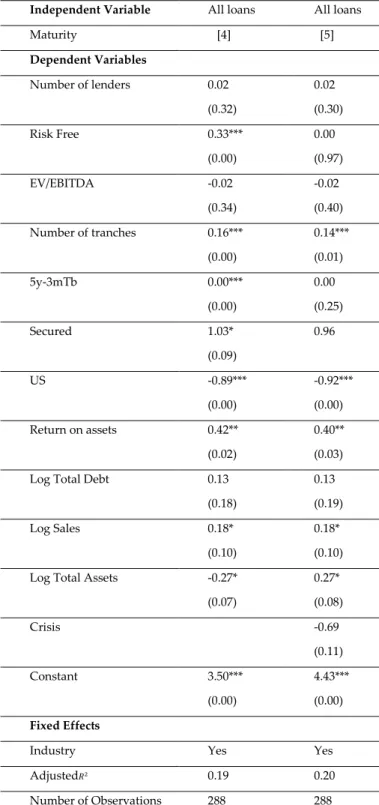
Two regressions were performed in the attempt of finding the determinants of Maturity (model [4] and model [5]).
Risk Free is significant and impacts positively maturity in model [4], although it becomes insignificant in model [5].
In both models the number of tranches proves to be significant, having a positive relationship with maturity, we can assume therefore that when a deal has a bigger number of tranches will have a bigger maturity.
Yield curve slope (5yTB-3mTB) is significant in model [4] but its impact is null for both models. The results suggest that a secured loan, in the first model, has a 1.03 years higher maturity than the average maturity in the sample.
Firms rentability on assets (Return on Assets) proves to be significant when determining maturity, presenting a positive relationship for both models, as well as the firm sales (Log Sales). Firms size(Log total assets) is also significant for both models, but they diverge, there is a negative relationship for model [4] and a positive relationship for model [5], both models affect maturity the same (0.27 years).
Our dummy variable U.S. suggests that loans closed in the U.S. have lower maturity.
The variables Number of Lenders, EV/EBITDA, Log Total Debt and Crisis are insignificant when determining the maturity of a loan deal with LBO specific purpose.
Table 7: Regression analyses of the determinants of maturity
Independent Variable All loans All loans Maturity [4] [5] Dependent Variables Number of lenders 0.02 (0.32) 0.02 (0.30) Risk Free 0.33*** (0.00) 0.00 (0.97) EV/EBITDA -0.02 (0.34) -0.02 (0.40) Number of tranches 0.16*** (0.00) 0.14*** (0.01) 5y-3mTb 0.00*** (0.00) 0.00 (0.25) Secured 1.03* (0.09) 0.96 US -0.89*** (0.00) -0.92*** (0.00) Return on assets 0.42** (0.02) 0.40** (0.03) Log Total Debt 0.13
(0.18) 0.13 (0.19) Log Sales 0.18* (0.10) 0.18* (0.10) Log Total Assets -0.27*
(0.07) 0.27* (0.08) Crisis -0.69 (0.11) Constant 3.50*** (0.00) 4.43*** (0.00) Fixed Effects
Industry Yes Yes Adjusted𝑅2 0.19 0.20
Number of Observations 288 288
Table 7 presents the results of OLS regressions analyzing the determinants of maturity. Models [4] and [5] use the same 288 LBOs loan deal sample, closed between 2000-2016, differing in the variables of the model. Secured takes value 1 if the loan is secured and 0 otherwise. Crisis takes value 1 if the loan is closed in a crisis period and 0 otherwise. For each independent variable, the first row reports the estimated coefficient and the second row reports the p-value. Coefficients were estimated based on heteroskedasticity-consistent clustered by deal. ***, ** and * denote
statistical significance at the 1%, 5% and 10% levels, respectively. We controlled for industry fixed-effects.
9. Conclusion
This study has the finality of understanding better determinants of spreads, as well as its structure and determinants of maturity, using a sample of 1,196 deals closed in the period of 2000-2016. We first provide an insight and analysis on the pricing of determinants and firms’ characteristics for our sample, focusing on how it differs between market-based versus bank-based financial systems and U.S. versus W.E. borrowers, then we analyze the relationship between spread and maturity/multiple. To enhance our study of the determinants of spread we add a section including firm’s characteristics to our regressions. Finally, a section attempting to try to investigate the determinants of maturity is present.
The results for determinants of spreads indicate that loans extended to market-based versus bank-market-based financial systems besides U.S. versus W.E. are priced in segmented loan markets. LBO deals spreads are explained using microeconomic and macroeconomic factors. The microeconomic variables with most impact are the deal size, number of tranches and number of lenders per deal. Concerning macroeconomic variables, the most significant variables turned out to be risk free rate and the region where the firm is located.
Regarding the main purpose of this thesis, we could recreate the results we were looking for, although not perfect, we can observe a flatter tendency on both U.S. and W.E. samples, U.S. sub-sample having a slight negative slope and W.E. sub-sample having a slight positive slope, but flatter indeed.
Firm characteristics such as book leverage and debt to total assets ratios proved to be insignificant when it comes to LBO loan, but pre-LBO profitability does affect the pricing of debt in LBOs, as previously found (Colla et al., 2012).
Finally, the study of the determinants of maturity did not output the results expected, the results indicate that maturity is related to the number of facilities, country where is closed the deal, firm rentability and firm size.
The main purpose of this thesis was to identify if the hump-shaped relationship between Spreads and Maturity could be flattened when added the multiple to the scene, this purpose was fulfilled since we could find a flatter relationship of spread and maturity/EBITDA multiple than the one found in spread and maturity. Maturity seems to be deeply related with the number of tranches country where is closed the deal, firm rentability and firm size.