WORKING PAPER SERIES
Universidade dos Açores Universidade da Madeira
CEEAplA WP No. 02/2018
The effects of contract-type mismatch and
matching frictions on unemployment
duration: Evidence for Portugal
Dario Sciulli
António Gomes de Menezes
February 2018
The effects of contract-type mismatch and matching
frictions on unemployment duration: Evidence for
Portugal
Dario Sciulli
University of Chieti-Pescara
António Gomes de Menezes
Universidade dos Açores (FEG e CEEAplA)
Working Paper n.º 02/2018
fevereiro de 2018
CEEAplA Working Paper n.º 01/2018
fevereiro de 2018
RESUMO/ABSTRACT
The effects of contract-type mismatch and matching frictions on
unemployment duration: Evidence for Portugal
This paper analyses the impact of matching frictions in the Portuguese labour
market on individual unemployment hazard rates and unemployment durations.
The coexistence of permanent contracts and temporary contracts in the
Portuguese (dual) labour-market is akin to a matching friction, with a
contract-type mismatch between jobseekers who have a strong preference for permanent
contracts, whereas firms, in turn, prefer to offer temporary contracts. The paper
uses a rich micro dataset which allows to compute a time and space varying
contract-type mismatch index, over 85 local labour markets, identified by
job-centers of the Portuguese Public Employment System. Employing discrete time
hazard models and a stock-flow matching mechanism, we find that local labour
markets with higher contract-type mismatch rates are characterized by lower
hazard rates, especially for job-seekers searching for a permanent contract, and
higher exit rates via own means instead of via the job-center. Employing a
sub-sample of uncensored spells and regression models, the data show that longer
unemployment duration is a price to be paid to hedge against contract mismatch.
Improving the desirability of temporary contracts and the information about local
contract-type mismatch rates may reduce matching frictions and average
unemployment durations due to contract-type mismatch.
Keywords:
public
employment
services,
job-centers
performance,
unemployment duration, matching rate, survival analysis
JEL codes: J68, J64, C14
Dario Sciulli
Department of Economic Studies
University of Chieti-Pescara
Viale Pindaro 42, 65127
Pescara, Italy
António Gomes de Menezes
Universidade dos Açores
Faculdade de Economia e Gestão
Rua da Mãe de Deus, 58
The effects of contract-type mismatch and matching frictions on unemployment
duration: Evidence for Portugal
Dario Sciulli1
University of Chieti-Pescara António Gomes de Menezes2
University of the Azores
Abstract
This paper analyses the impact of matching frictions in the Portuguese labour market on individual unemployment hazard rates and unemployment durations. The coexistence of permanent contracts and temporary contracts in the Portuguese (dual) labour-market is akin to a matching friction, with a contract-type mismatch between jobseekers who have a strong preference for permanent contracts, whereas firms, in turn, prefer to offer temporary contracts. The paper uses a rich micro dataset which allows to compute a time and space varying contract-type mismatch index, over 85 local labour markets, identified by job-centers of the Portuguese Public Employment System. Employing discrete time hazard models and a stock-flow matching mechanism, we find that local labour markets with higher contract-type mismatch rates are characterized by lower hazard rates, especially for job-seekers searching for a permanent contract, and higher exit rates via own means instead of via the job-center. Employing a sub-sample of uncensored spells and regression models, the data show that longer unemployment duration is a price to be paid to hedge against contract mismatch. Improving the desirability of temporary contracts and the information about local contract-type mismatch rates may reduce matching frictions and average unemployment durations due to contract-type mismatch.
Keywords: public employment services, job-centers performance, unemployment duration, matching rate, survival analysis
JEL codes: J68, J64, C14
1 Dario Sciulli (corresponding author), Department of Economic Studies, University of Chieti-Pescara.
Viale Pindaro 42, 65127 Pescara (Italy). Tel. (+39)085.4537977. E-mail: dario.sciulli@unich.it
2 António Gomes de Menezes, Department of Economics and Business, University of the Azores. E-mail:
1. Introduction
Since the 1980s and 1990s, the so-called labour market reforms “at the margin”, marked by the introduction of temporary (and flexible) contracts, in countries such as Portugal, Spain and Greece, led to the emergence of dual labour markets where good jobs (permanent contracts) and bad jobs (temporary contracts) co-exist, and to labour market performances with high unemployment rates and high unemployment durations. The co-existence of permanent contracts and temporary contracts gives rise to a possible contract-type mismatch, where job-seekers predominantly prefer permanent contracts, whereas firms offer mainly temporary contracts. This contract-type mismatch may be naturally perceived as a matching friction and, consequently, may lead, per se, to longer unemployment duration. Hence, a labour market reform, designed with a primary intention to increase labour market flexibility, may have the unintended effect of leading, via this contract-type mismatch effect, to longer unemployment duration.
Our paper sheds light to this important phenomenon by looking at the Portuguese situation. We investigate the role that matching frictions, due to contract-type mismatch, have in explaining unemployment hazard rates in a dual labour market where good jobs and bad jobs coexist. In particular, we analyse the role that contract-type expectations and labour market mismatch – job-seekers preferring permanent contracts over temporary contracts while firms prefer the opposite – play in increasing unemployment duration.
Since the 1990s labor market analysis has largely used matching functions in search and match frameworks (Mortensen 1987). Matching functions allow researchers to investigate the role of frictions in the labor market in explaining the existence of (frictional) unemployment and labor market effectiveness in matching unemployed workers with available vacancies.
As highlighted by Petrongolo and Pissarides (2001), frictions derive from various sources. For example, they depend on imperfect information about potential trading partners, absence of perfect insurance markets, congestion from large numbers, among other factors. Recently, most contributions devoted to estimating matching functions focused on the role of heterogeneity of job-seekers in explaining frictions in the matching process. An important argument put forward by such studies is that failure to consider the heterogeneity of job-seekers may lead to a misspecification of the estimating matching function and, concomitantly, to biased estimates of the estimating parameters and to misleading inferences on search elasticities. Several authors (e.g. van Ours and Ridder 1995; Burgess and Profit 2001) found evidence of job competition between different skill groups and between employed and unemployed job-seekers. Fahr
and Sunde (2001) find heterogeneity in matching technologies across members of different ages and education groups, indicating the importance of disaggregating the matching function to explain the inner workings of the labour market and to avoid the loss of important information. Hynninen and Lahtonen (2007) find that wider heterogeneity of job-seekers in terms of their educational levels increases the importance of frictions in the matching process.
However, matching frictions may also arise from other sources, including labour market reform. Reforms “at the margin” – which introduced temporary contracts and were meant to reduce labour market rigidity – may constitute a potential source of matching frictions. The role of temporary contracts in the labour market is manifold. Certain authors (e.g. Ichino et al. 2005) emphasize their role in making it easier for workers to enter in the labour market and, in some cases, for workers to access permanent jobs. However, several studies3 highlighted possible negative effects from temporary employment with respect
to traditional permanent relationships, contributing to rationalize the existence of segmented labour markets divided into primary and secondary sectors and, specifically, a segmentation in good and bad jobs4.
Permanent jobs (good jobs) feature better working conditions, employment stability and good prospects of career advancements. Temporary jobs (bad jobs), in turn, are associated with lower wages, lower job security and impediments to career advancements (Amuedo-Dorantes 2000). In a dual labour market, where good and bad jobs coexist, it is likely that one will find job-seekers having strong preferences for permanent contracts while firms may offer temporary contracts, since firms may use this contractual form to easily adjust their workforce to business cycle conditions or simply to reduce expected labour costs. Therefore, a labour market characterized by a homogenous supply side, with most unemployed workers searching for a permanent job, and a heterogeneous demand side, where temporary and permanent job offers coexist, may involve a high degree of mismatch, and, hence, high average unemployment duration. In fact, it is likely that individuals looking for a permanent job will tend to first refuse offers if they are for temporary jobs and only after a certain time they will start accepting those temporary job offers if said individuals do not find a suitable permanent job meanwhile.
3 For example, Jimeno and Toharia (1993), Dolado, Garcia-Serrano and Jimeno (2002), and Gagliarducci
(2005).
4 See Dolado, Jansen and Jimeno (2007) for a theoretical framework on dual employment protection
Our paper tests the hypothesis that higher contract-type mismatch leads to higher unemployment duration. To that end, we estimate a matching function using Portuguese data on individual transitions from unemployment to employment or employment to employment. Our empirical strategy consists in estimating individual reemployment probabilities with hazard models, as it allows for more flexible specifications of the matching function when compared to estimates of an aggregate matching function, since hazard models allow for a wide range of distributional forms of unemployment durations. In addition, estimating individual reemployment probabilities allows us to control both for observed and unobserved heterogeneity at the individual level, which are only implicitly considered in an aggregate matching function.
Despite the advantages of using hazard models to estimate matching functions, only a few studies in the literature have done so. For example, Lindeboom, van Ours and Renes (1994) investigated the link between matching functions and hazard models to study the relative effectiveness of alternative search channels. Petrongolo (2001) used hazard function specifications to test the empirical relevance of the constant returns to scale hypothesis in the matching technology. Other studies estimated hazard functions to explore the individual determinants of unemployment duration, but they did not investigate the matching technology underlying the matching process (Devine and Kiefer 1991).
We follow the literature and allow two possible approaches in estimating the matching functions: the random matching and the stock-flow matching models 5. Broersma and van Ours (1999) argue that the
estimates of the degree of returns to scale in the matching technology depend on the data for active job-seekers and posted vacancies used and emphasize the importance of looking at comparable measures for flows and explanatory stocks. Gregg and Petrongolo (2005) argue, in turn, that part of the instability of estimated matching functions derives from problems of misspecification, due to the assumption of random search, rather than a stock-flow matching technology. In our case, we use data from job-centers and the stock-flow approach is a better representation of the matching mechanism, since the existence of a matchmaker (i.e. the job-center) makes it unlikely that the same job may be re-offered to the same unemployed worker, as allowed by the random matching approach.
5 In a random matching set up the unemployed workers randomly select a vacant job from the pool of
existing vacancies and apply for it. Under the stock-flow matching technology, at the time an individual becomes unemployed he samples the existing stock of vacancies for a suitable job. If he fails to find a suitable match among the existing stock of vacancies, then he must wait to eventually be matched with the flow of new vacancies and he does not re-apply to the previously searched stock of old vacancies.
We use a sample drawn from the IEFP (Instituto do Emprego e Formação Profissional) dataset, the public entity responsible for Portuguese public job placement centers, for the period from 1998 to December 2002. This dataset provides information about personal and job-related characteristics of all individuals who registered in the Portuguese job-centers and allows to construct spells of individual unemployment duration and, quite interestingly, to identify the destination contract (if permanent or temporary). In addition, the dataset allows us to construct stocks and flows of unemployed job-seekers and vacancies offered for each month at the job-center level. The dataset also contains information about vacancies, enabling us to determine the number of vacant jobs available for each month at the job-center level. The IEFP data provide information about the contract type sought by unemployed workers and the contract type offered by firms. Therefore, it allows both to control the direct effects of the desired contract on the hazard rates toward multiple destination states and to construct an index6 of the degree of the
heterogeneity found between contracts searched and contracts offered which we use to understand the effects of such contract mismatch on unemployment duration. We estimate a competing risks discrete time hazard model with a log-log specification. We adopt a piece-wise constant baseline hazard where unobserved heterogeneity is assumed to be Gaussian distributed. The heterogeneity between contract-type desired by job-seekers and contract-type offered by firms is approximated by a mismatch index, which we include in the hazard model. The mismatch index is calculated at the job-center level and it thus reflects local labor market aggregate information; consequently, it is a valid regressor. Finally, auxiliary regression models have been adopted to test the stability of declared contract preferences and to investigate the association between unemployment duration and the probability of incurring in contract mismatch.
The remainder of the paper is organized as follows. Section 2 describes the data. Section 3 describes contract type preferences. Section 4 introduces our index for contract-type mismatch. Section 5 presents the econometric model. Section 6 discusses the results. Finally, Section 7 concludes.
2. Data
We use an IEFP dataset that provides information on individuals registered at job-centres in (Mainland) Portugal from 1997 to 2002. The IEFP is the agency responsible for running the public employment services, and it is a division of the Ministry of Labour and Solidarity. The IEFP is responsible for job brokering, vocational guidance, administering employment subsidies, vocational training,
apprenticeship training and being registered at a job-center is necessary to collect unemployment benefits (see Addison and Portugal, 2002). The IEFP dataset includes information about job vacancies offered by firms. The original sample containing information on individuals is composed by more than 3 million of observations. To avoid computational problems, we drew a randomized sub-sample equal to 10% of the original sample7. The IEFP dataset provides (daily) information about the date of registration at the
job-center and the date of placement, making it possible to identify (multiple) spells of unemployment durations. Our duration analysis focuses on unemployment spells starting since 1998 to have at our disposal complete information on all covariates considered. Spells without the date of placement are considered censored. However, individuals may drop out of the centers if they fail to present themselves at the job-centers control interviews. We eliminate from our sample spells that terminate in failure to report to the above-mentioned control interviews to avoid misleading identification of censored unemployment durations. To make our results, on the one hand, more readable in economic terms, and, on the other, easily comparable to previous studies found in the literature, unemployment duration is analysed monthly rather than a daily basis.
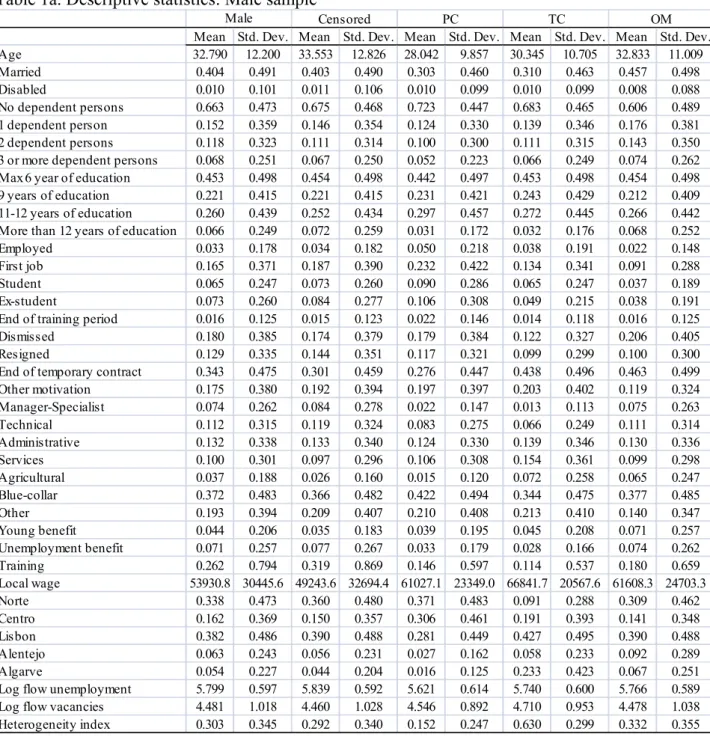
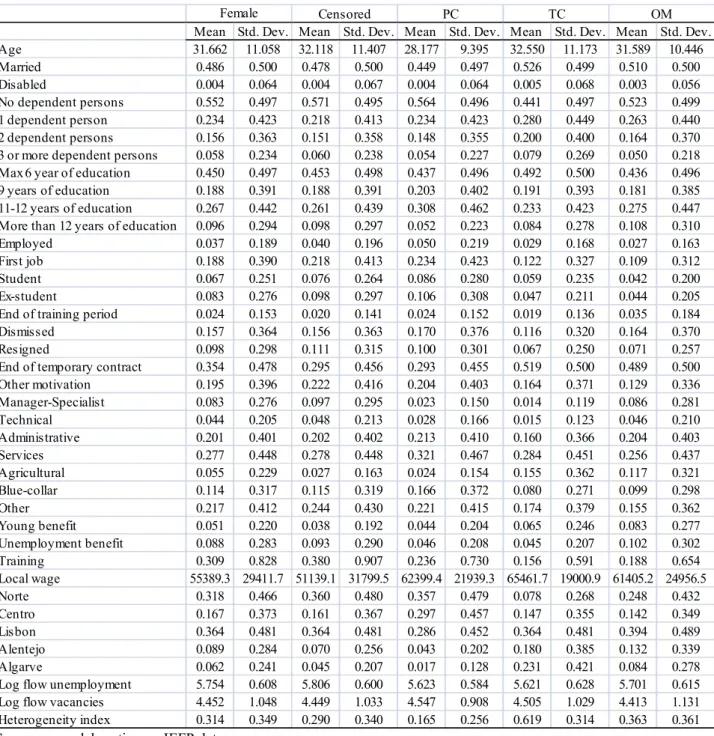
We only consider individuals aged 16 to 60 years old, for whom all information with respect to all the covariates considered is available. This selection leaves us an unbalanced panel composed by 164627 spells and 133234 individuals. We remark that more than 81% of individuals only experiment one spell of unemployment in our samples. This is mainly due to the (1) quite long duration of unemployment spells which characterizes the Portuguese labour market and to the (2) short period analysed in this paper (60 months); both factors concur to explain the high percentage of censored spells in our sample (about 62%). We consider a plethora of personal and job-related characteristics to control for observed heterogeneity at the individual level. Males and females are analysed separately. Tables 1a and 1b contain descriptive statistics.
<< Table 1a >> << Table 1b >>
To be more specific, we control for the following individual characteristics: age, introduced in a non-linear way, marital status, disability status, number of dependent persons in the household and educational level. We also control for job related characteristics. We introduce a variable indicating if the individual is looking
7 Descriptive statistics of variables contained in the original IEFP dataset and descriptive statistics of our
for his or her first job, meaning that he or she has no previous work experience, and a dummy indicating if the individual is employed at the outset of the job-search (on-the-job search). We consider a set of dummy variables indicating the motivation of the registration at the job-center. These dummy variables flag if the individual: was formerly a student; finished his or her educational career; finished a training period; was dismissed; resigned and if the individual registered because of the termination of a temporary contract; the base category dummy is constituted by individuals with no previous job experiences. We also control for a set of dummy variables indicating the occupation of the individual, distinguishing between managers, supervision activities and specialists, technicians, administrative workers, service workers, agricultural and fishing workers, blue collars, and individuals without specific occupations (interpreted here as no qualifications). Two variables are introduced to control if the individuals received unemployment or youth benefits or underwent a training period during the registration at the job-center. Year dummies referring to the beginning of the unemployment spell are also considered. Regional dummies are introduced to control for possible specific regional labour markets effects. As anticipated, according to the job-search theory framework, the probability of accepting a job offer is related to the expected wage distribution, and, hence, we introduce the mean wage offered by firms, evaluated monthly at the job-center level. Labour market tightness variables are also introduced and are evaluated monthly at the job-center level. To implement the stock-flow matching mechanism, we use stock and flow values of unemployed workers and vacancies in the following way. The IEFP data provide daily information of gross inflows of unemployed workers and vacancies that allow us to construct the monthly magnitude of gross inflows of labour market tightness variables and to reconstruct their stock values. To construct stock values, we use information from the 1997 IEFP dataset, hence at the starting of the period analysed we have at our disposal the accumulated flow values until December 1997. The stock flow approach is implemented using time-varying labour market tightness variables, under the hypothesis that individuals look at the pool of vacancies only in the first round (one month) of their search process, and, afterwards, look at the gross inflow in the following rounds (months) of the search process. Tightness of the labour market expressed in terms of stock values (V/U) is about 0.075, while it is about 0.47 if expressed in gross flow terms (v/u). These differences are strongly suggestive that mean unemployment duration far exceeds mean vacancy duration, a result in line with other studies in the literature.
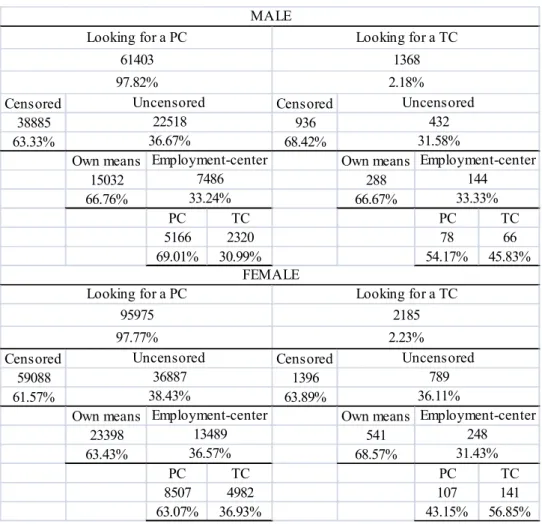
According to the IEFP information 98% of job-seekers are looking for a permanent contract, while just two thirds of vacant jobs offer a permanent relationship. This is indicative of different preferences about contract-type between job-seekers and firms. A first consequence of this dyscrasia is that some job-seekers may accept a contract-type different from the desired one. Table 2 reports the destination contract of the job-seekers according to the declared desired contract. Among individuals looking for a permanent contract just 69% of males effectively find a permanent job, while this percentage decreases to 63% among females. Among individuals looking for a temporary contract 46% of males effectively find a temporary job, while this percentage increases to 57% among females.
<< Table 2 >>
What can explain this different attitude towards permanent/temporary contracts? From a job-seeker perspective, permanent jobs may be preferred to temporary ones as permanent contracts feature better working conditions, employment stability and good prospects of career advancement (e.g. Amuedo-Dorantes 2000). From a firm perspective, temporary contracts mat be preferable because of different reasons. For example, Brencic (2009) highlights that firms may prefer to hire workers by temporary contracts to minimize costs from bad matches. Table 3 reports estimates of a probit model informing us about the determinants of preferences for permanent contract in 1998-2002 IEFP data.
<< Table 3 >>
Another question to be addressed in our analysis concerns the stability of contract preferences. In fact, while the great majority of job-seekers may declare to prefer a permanent contract, they may revise their preferences over time as they learn about labour market conditions (namely contract-type attached to vacant jobs). This is important because the effectiveness of contract mismatch, and hence its effect on matching frictions and unemployment duration, crucially depends on the rigidity of the individual contract preferences. There are at least two types of hypothesis for which rigidity may be questioned: 1) superficiality and 2) preference revision. Under the first case, unemployed workers superficially declare to look for a permanent contract, but they are prone to accept a temporary contract if offered. A second hypothesis is that job-seekers indeed look for a permanent contract, but they are willing to revise their preferences to avoid an unacceptable lengthening of unemployment duration8. Obviously, in case one of
the previous hypotheses is verified the reliability of the declaration about contract type preferences and,
8 The hypothesis of superficiality is an extreme case of the hypothesis of preference revision: the job-seeker
thus, of the mismatch index to identify contract mismatch and its effect on unemployment duration could be questioned. However, for the sub-sample of job-seekers accepting a job-offer attached to a contract-type different from the declared preferred contract-type, the observed unemployment duration will be included in the support [tmin, tmax]. Specifically, t = tmin in case the hypothesis of superficiality is verified, while t=tmax
in case both the previous hypothesis (superficiality and preference revision) are not verified. Given these premises, we suggest a rigidity index (r) which measures the rigidity of the contract preferences:
(1) min max min
t
t
t
t
r
where r ∈ [0, 1] and
rigidity
1
)
hypothesis
ality
(superfici
y
flexibilit
0
r
Unfortunately, IEFP data does not provide information to test directly the hypothesis formulated above, nor to measure the rigidity index. The hypothesis of superficiality is tested running a multinomial logit model to uncover if the declared preference for permanent contracts affects the outcomes of the job-search period, i.e. finding a permanent job, finding a temporary job, finding a job by own means, and experiencing a censored spell (our base-category). In case we find evidence of a significant impact of the explanatory variable (job-seekers are looking for a permanent contract) on the probability of finding a permanent job rather than a temporary one, it would be suggestive that the declared contract-type preferences matter in determining the contract-type attached to the job founded. In this case the hypothesis of superficiality is rejected. Conversely, if the preference for permanent contracts does not explain the contract-type of the job accepted, the hypothesis of superficiality is not rejected. Table 4 reports estimates of the multinomial logit model, where in the first column we report alternative outcomes.
<< Table 4 >>
According to multinomial logit estimates, the hypothesis of superficiality is rejected: looking for a permanent contract increases the probability of finding a permanent job and decreases the probability of finding a temporary contract.
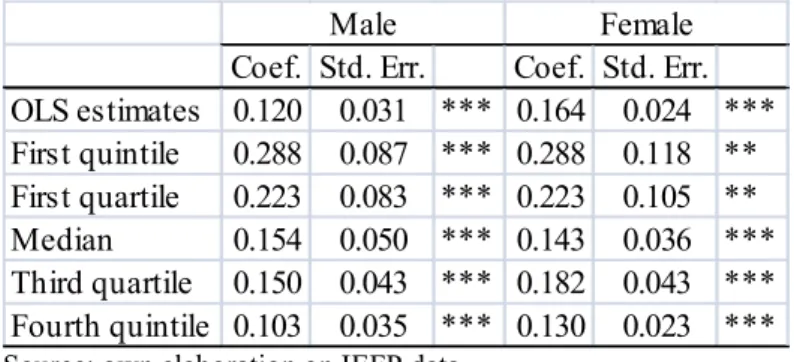
The hypothesis of preference revision is tested using quantile regressions. According to ordinary least square estimates, the average impact of looking for a permanent contract (declared at the beginning of the search period) on the log unemployment duration is positive, possibly because of contract mismatch. Nevertheless, it is likely that the positive association is not constant along the job-search period. The hypothesis of preference revision considers this possibility, i.e. job-seekers may revise their preference for
permanent contracts in case of excessive lengthening of the unemployment duration. Empirically this should correspond to a decreasing effect of looking for a permanent contract on unemployment duration as unemployment duration increases. To test this hypothesis, we apply a quantile regression model and evaluate if the positive association between unemployment duration and preferences for permanent contracts decreases with unemployment duration.
<< Table 5 >>
Estimation results presented in Table 5 suggest that: 1) looking for permanent contracts increases unemployment duration (as suggested by the contract-mismatch hypothesis); 2) this positive association is decreasing along the unemployment duration distribution; this supports the hypothesis of preference revision.
4. A heterogeneity index for contract mismatch
The availability of data disaggregated both at the unemployed level and at the job vacancy level is an indispensable condition to the construction of a mismatch index. The IEFP dataset gathers information from 85 job-centers for each month under investigation including the number of job vacancies available; therefore, we can analyse the labour market demand side at an appropriately disaggregated level. To evaluate the effects of contract-type heterogeneity - between permanent contracts searched by unemployed workers and permanent contracts offered by firms - on unemployment duration, we introduce an index (M, Mismatch Index) in the spirit of the Jackman and Roper (1987) mismatch indicator9. The mismatch index,
measured monthly (m) at the job-centre level (j), is defined as the difference between the ratio of unemployed workers looking for a permanent contract and the pool of unemployed workers, and the ratio of permanent contracts offered by firms and the pool of vacancies:
(2) jm PC jm jm PC jm jm
V
V
U
U
M
with Mjm = [-1, +1]M is defined in the support region [-1, +1] with the following particular cases:
9 Jackman and Roper (1987) indicator reads:
0
,
1
2
1
u
v
M
M
i i i , where ui Ui
iUiand
i i i iV
V
v
where Ui and Vi are the number of unemployed workers and vacancies in category i (where
&
0
if
1
|
0
&
0
if
0
&
0
if
1
jm PC jm PC jm jm PC jm jm PC jm PC jm PC jm jm PC jm PC jm jmU
U
V
V
V
U
U
V
U
V
V
U
M
M takes the value of zero (absence of heterogeneity) in case there are no unemployed workers nor vacant jobs with a preference for a permanent contract, or in case the percentage of unemployed workers looking for a PC is equal to the percentage of vacant jobs offering a PC. M takes the values of plus one or minus one in case of full heterogeneity. Hence, higher absolute values of M are associated with higher degrees of contract mismatch.
Full positive contract mismatch (i.e. M takes value one) indicates that all unemployed workers look for a permanent contract and no permanent contracts are available. On the contrary, full negative contract mismatch, (i.e. M takes value minus one) indicates that all unemployed workers look for a temporary contract and no temporary contracts are available.
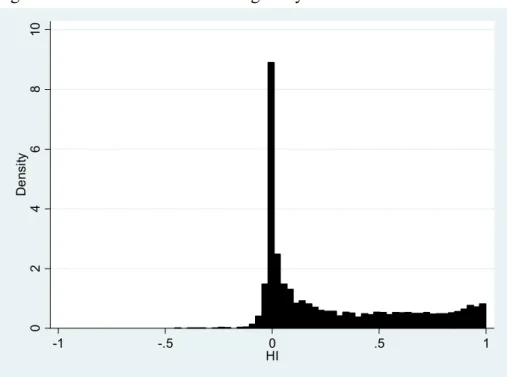
The average in-sample value of M is 0.31, which represents the average value of the difference between unemployed workers looking for a permanent relationship (97.8% of unemployed workers) and the percentage of permanent jobs offered by firms (66.7% vacant jobs). Table 6 and Figure 1 illustrate the distribution of M values across job-centers.
<< Table 6 >> << Figure 1 >>
A zero value of the index does not imply per se full placement of unemployed workers looking for a permanent contract. The index is an effective instrument to capture contract type heterogeneity, since it is representative of the potential mismatch at the contract level.
5. The econometric model
We employ duration analysis taking into consideration that the start of the job-search process coincides with registration at job-centers. As the dataset has interval-censored data, discrete-time hazard models are estimated (Prentice and Gloecker 1978). According to the hazard-model’s framework, the probability that a transition to employment will take place in a given interval [aj-1, aj) is conditional on the
time already spent in unemployment and is estimated as a reduced form equation that considers the product of two probabilities: the probability of receiving a job offer and the probability of accepting it. The
probability of accepting a job offer corresponds to the probability that the wage offer exceeds the reservation wage. The probability of leaving unemployment can vary over the unemployment spell according to changes in the probability of receiving an offer and the reservation wage: adopting time-varying covariates controls for this variation.
The probability of exiting unemployment in period j reads: (3)
h
j
Pr
T
[
a
j1,
a
j)
|
T
a
j1
Assuming unit length intervals, the realization j of the discrete random variable T is the recorded spell duration. Discrete-time hazard models require that data are organized into a “sequential binary form.” The data form an unbalanced panel of individuals with the individual i contributing j = 1, 2, … t observations, where j indicates the number of periods at risk of the event10. Because some individuals transition into
employment and possibly back into unemployment, multiple spells q = 1, 2, … Q are observable. In this case, to simplify the analysis, zero temporal correlation across spells is assumed.
Hazard functions are estimated by assuming a complementary log-log specification, that may be seen as the discrete time representation of a continuous time proportional hazard model, with a piecewise constant baseline hazard and Gaussian11 unobserved heterogeneity12. The available data allow to identify
the destination contract (PC or TC) only if the individual accepts a job offered at job-center level, while it remains unidentified if the individual leaves unemployment by own means (OM). It follows that three destination states (d) are possible and competing risks models are estimated. The estimated models assume independent competing risks13, implying that a hazard function for each destination state can be estimated
separately by setting to zero the failures on other destinations.
10 To be more specific, a binary dependent variable was created. If the individual i’s survival time is
censored, then the dependent binary variable is always zero; if the individual i’s survival time is not censored, then the dependent binary variable has a value of zero in the first j-1 observation and has a value of one in the last observation.
11 At least for a single spell (or independent spells), Nicoletti and Rondinelli (2010) show that in discrete
time hazard models, assuming Gaussian unobserved heterogeneity, misspecifying the error distribution only leads to an equiproportional rescaling of the covariate coefficients.
12 Estimation results using models without unobserved heterogeneity and/or alternative baseline hazard
assumptions are available upon request.
Controlling for unobserved heterogeneity may prevent estimation bias arising, for example, from omitted variables or from measurement errors in the observables. If unobserved heterogeneity is ignored, certain problems may arise (Jenkins 2005). For example, the absolute value of the duration dependence parameter in the hazard rate could be under-estimated (spurious duration dependence). The augmented hazard function, for each risk, is given by:
(4)
h
iqjd
t
j,
X
|
i
1
exp
exp
0
'
X
j
t
u
i
where X is a set of time-varying covariates, including the mismatch index, M, introduced in a non-linear way, β0 is the intercept, and β is a vector of unknown parameters to be estimated. Finally:
i
i
v
u
log
is the mixture term, and
j j t t jt
h
u
du
1 0
is the baseline-hazard.To estimate this model, the survival and density functions that compose the likelihood function cannot be conditioned on the unobserved effects. Therefore, the likelihood contributions are obtained by integrating the random terms out. The discrete-time likelihood function that incorporates the unobserved heterogeneity term is obtained by summing up the discrete-time likelihood functions of each individual i and spell q given by: (5)
u
i i t j y iq iq j y iq iq j iqdh
t
x
u
h
t
x
u
g
u
du
L
iqj iqj
1 1|
,
1
|
,
,
,
where yiqj is an indicator that assumes a value of one when the transition takes place in month j (i.e., the
spell is uncensored) and a value of zero otherwise, and σ is the vector of unknown parameters in gu(u).
Our benchmark estimations assume a stock-flow matching mechanism14 (Petrongolo and Pissarides 2001).
Stock-flow matching is more compatible with negative duration dependence than random matching, even if negative duration dependence may also be explained in terms of ranking or loss of skills during unemployment. Positive duration dependence could be explained, for example, because of unemployment benefits exhaustion.
6. Estimation Results
6.1 Hazard rates and contract mismatch in local labour markets
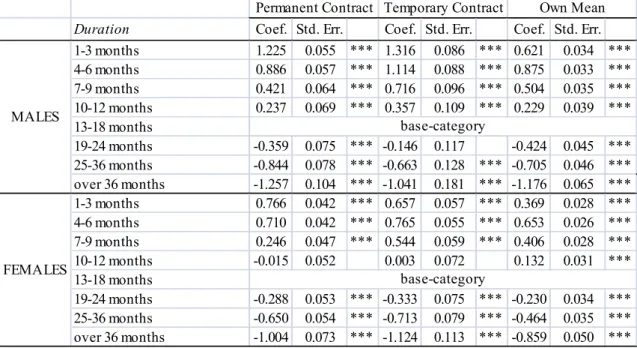
Table 7 reports the estimated coefficients from discrete time hazard models for the mismatch index introduced in a non-linear way. These results are obtained under a competing-risk specification, separate for males and females, in which we assume piece-wise constant baseline hazard (see results in Table A1), normally-distributed unobserved heterogeneity and controlling for a plethora of individual and job-related characteristics (see results in Tables A2a and A2b). The predicted hazard rates are reported as a function of the mismatch index in Graph 115. The left-hand-side graph refers to the competing risk analysis and reports
the hazard rates against the mismatch index, while the right-hand-side graph illustrates the hazard rate at the job-center level (namely, by summing up hazard rates across individuals finding both a permanent and temporary job) by mismatch index.
<< Table 7 >> << Graph 1 >>
Preliminary evidence show that hazard rates are higher for individuals finding a job by own means and that differences by gender are quite negligible. In this context, looking at individuals finding a job by own means, the hazard rates tend to be slightly convex, i.e. higher hazard rates are associated to extreme values of the mismatch index (high contract mismatch), and show a decreasing pattern as the index increases. Convexity could be a consequence of contract mismatch, i.e. where it is stronger, individuals are more likely to accept job offers out of the job-centers (possibly with the aim of reducing their exposure to contract mismatch). The declining pattern of the hazard rates possibly indicates that, in presence of positive contract mismatch (i.e. the percentage of individuals looking for a permanent contract is higher than the percentage of firms offering permanent contracts), finding a job by own means is less likely. This could be a consequence of a higher propensity of individuals looking for a permanent contract to wait for a permanent job-offer in the job-centers.
The hazard rate for individuals finding a permanent contract follows an inverted U-shaped trend. To be more specific, the hazard rate is quite low in the presence of strong negative contract mismatch, but it increases for weak negative heterogeneity, reaching a maximum for index values between -0.5 and -0.4, then it decreases, reaching its minimum at full positive contract mismatch. This means that for individuals who find a permanent contract via the job-center, the hazard rate is negatively associated with stronger contract mismatch in the local labour market. With respect to individuals who find a temporary contract via
the job-center, we find that the hazard rate is close to zero for negative heterogeneity, while it increases for positive contract mismatch. This indicates that in local labour markets characterized by robust positive contract mismatch, we are more likely to observe individuals finding a temporary contract than a permanent contract.
Looking at the total hazard rate at job-centers’ level (i.e. summing the hazard rates of individuals finding both a permanent and a temporary job), the resulting trend resembles the one observed for those individuals who find a permanent job via the job-center. This is because the contribution of individuals finding a temporary job is quite negligible. In sum, the right-hand-side graph suggests that at job-centers’ level, the hazard rate is higher for intermediate negative values of the mismatch index and lower for extreme values, with the lowest level in corresponding to of full positive contract mismatch. Integrating over these results, the data support the thesis that higher contract mismatch is associated with lower hazard rates.
6.2 Unemployment duration and contract mismatch
In this section we provide further evidence on the association between contract mismatch and unemployment duration looking at the issue from another perspective. The underlying idea is that some job-seekers looking for a permanent contract may refuse temporary contracts job-offers as they wait for a permanent contract job-offer. Empirically, we should find a negative association between probability of contract mismatch and unemployment duration. To look into this issue, we work on a sub-sample of the IEFP data, i.e. we now only consider those job-seekers for whom the exit-contract is observable and the contract mismatch variable may be determined (as a consequence, censored spells and those spells for which job-seekers find a job by own means are eliminated). Fort this data-subset, where contract mismatch is observed (we recall that unemployed individuals report their preferred contract type and vacancies are labelled if for temporary contracts or permanent contracts; finally, the data also records the type of contact of the match whenever a match via the job-center is formed) we estimate a pooled probit model with robust standard errors where the dependent variable takes value one in case of contract mismatch (the job-seeker looks for a permanent contract but finds a temporary job or if the job-seeker looks for a temporary contract but finds a permanent contract), while it takes the value of zero otherwise. Explanatory variables include demographic and job-related characteristics, including the unemployment duration variable expressed in logarithmic terms. As showed in the first line of Table 8 (first row) we find a negative and significant relationship between the probability of mismatch and unemployment duration.
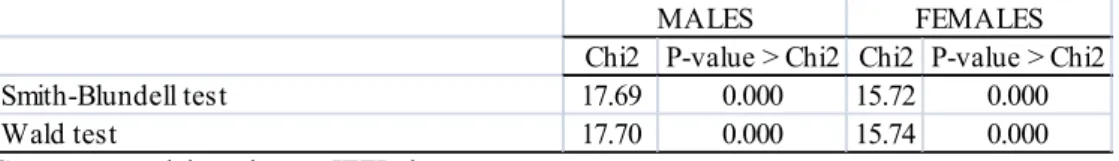
We address possible endogeneity problems of unemployment duration and employ the two-step IV probit approach suggested by Newey (1987), with the following instruments: a variable indicating the month in which the unemployment spell ends and a variable indicating the year in which the unemployment spell begins. All instruments suggest a very strong effect of the instrumented variable (Table 8, third row).
<< Table 8 >>
The validity of these instruments is tested by the Amemiya-Lee-Newey minimum chi-square test under the null hypothesis that the used group of instruments is valid, i.e., they are uncorrelated with the error term in the structural equation. Both for males and females the test does not reject the null hypothesis (Table 9). Then we apply both the Blundell-Smith (1986) and the Wald test of exogeneity under the null hypothesis that the instrumented variable is exogenous (Table 9). The procedure considering for endogeneity confirms the existence of a negative and significant association between the probability of mismatch and unemployment duration (Table 8, second row). On average, job-seekers are prone to accept longer unemployment duration to avoid contract mismatch; it follows that contract mismatch acts as a source of matching frictions in a dual labour market, where permanent and temporary contracts co-exist and job-seekers have strong preferences for permanent contracts.
<< Table 9 >>
7. Conclusions
This paper tests the hypothesis that higher labour market mismatch, defined as heterogeneity between contract-type sought by job-seekers and contract-type offered by firms, leads to longer unemployment duration. In this sense, labour market mismatch, as found in a dual labour market where permanent contracts (good jobs) and temporary contracts (bad jobs) co-exist, acts as a matching friction and may lead, per se, to longer unemployment duration. In these circumstances, better information on contract-type availability may lead to more effective job-search strategies at the individual level, who may revisit their expectations in a timely and informed way, avoiding, thus, excessive exposure to long unemployment duration due to this form of matching friction.
Our mismatch index measures the degree of contract-type mismatch between declared preferences of job-seekers and jobs offered by firms at job-center level and assesses the impact of contract-type mismatch on unemployment duration. The reliability and the stability of the declared preferences for a specific contract-type are tested using both multinomial logit and quantile regression models. Our tests suggest that
the individual declared preferences are stable and informative; nevertheless, and as expected, individuals may revise their initial preferences in case such preferences lead to a certain lengthening of the unemployment spell.
Results from a discrete-time competing risk hazard model under a stock-flow matching mechanism suggest a significant impact of contract-type mismatch at job-centers level on individual hazard rates. Among individuals finding a permanent contract the hazard rate is lower for extreme values of the mismatch index, with the hazard rate reaching its lowest level when full positive contract mismatch occurs. In addition, local labour markets characterized by positive values of the mismatch index are associated with a higher incidence of exiting unemployment by accepting a temporary contract, as individuals hedge their position against a low likelihood of finding a permanent contract. Finally, extreme values of the mismatch index, especially negative values, are associated with a higher probability of finding a job by own means, suggesting that in presence of high contract-type mismatch individuals look for a job outside the job-centers.
We focus on the sub-sample of individuals who find a job via the job-center to investigate if experiencing longer unemployment duration may lead individuals to indeed secure their preferred contract type. This could be indicative that individuals are prone to lengthen their unemployment duration if doing so gets them to find their desired contract. Adopting an instrumental variable probit model, we find evidence that longer unemployment duration is associated with a lower incidence of contract mismatch, in the sense that the job-seeker secured a job of his or her declared preferred type. As a result, the existence of contract-type mismatch increases unemployment duration as individuals may rationalize be willing to pay a price in terms of prolonged unemployment, to secure their preferred contract type.
Our work indicates that the Portuguese labour market is characterized by substantial contract-type mismatch: job-seekers have a strong preference for permanent contracts while firms offer both permanent and temporary contracts. Job-seekers may revise their preferences and are also prone to accept temporary jobs, but this contract-type preference revision is not instantaneous: declared desired contracts explains the exit contract-type and individuals with longer unemployment duration experience lower contract mismatch, with extended unemployment duration being the price to pay to avoid exit contract-type mismatch. It follows that contract-type mismatch is akin to a matching friction and is associated with longer average unemployment duration. The underlying motives behind contract-type mismatch may possibly lie in the undesirability of some temporary contracts because of their characteristics, including possible negative
effects on career advancements for some workers on temporary-contracts. Improving temporary workers conditions and their labour market perspective could improve the desirability of temporary contracts, contributing to reduce matching frictions and average unemployment duration because of contract-type mismatch. Workers who are duly informed about actual contract-type mismatch observed at the job-center level may formulate search-strategies which are rational, including search-strategies which may involve revising preferences with respect temporary-contracts. It may also be the case that some workers overestimate their own individual probability of finding a permanent-contract, despite the level of contract-type mismatch observed in their local labour market. This overestimation may be associated with a well-documented cognitive bias (Kahneman, 2015), with individuals systematically overestimating their own ability and relative position with respect the overall distribution. In this sense, better information on contract-type mismatch, coupled with policies which render temporary-contracts more attractive, are likely to increase unemployment exit rates and reduce average unemployment duration.
References
Addison JT, Portugal P (2002) Job Search Methods and Outcomes. Oxford Economic Papers 54(3), 505-533;
Amuedo-Dorantes C. (2000) Work Transitions into and out of Involuntary Temporary Employment in a Segmented Market: Evidence from Spain. Industrial and Labour Relations Review 53(2), 309-325; Blanchard OJ, Diamond P (1994) Ranking, Unemployment Duration, and Wages. Review of Economic Studies 61(3), 417-434;
Broersma L, van Ours JC (1999) Job Searchers, Job Matches and the Elasticity of Matching. Labour Economics 6(1), 77-93;
Burgess S, Profit S (2001) Externalities in the Matching of Workers and Firms in Britain. Labour Economics 8(3), 313-333;
Coelho JM (2003) Duraçao do Desemprego e das Vagas de Emprego no Mercado de Trabalho Portuguès. Banco De Portugal, Boletim Económico, Março;
Devine TJ, Kiefer NM (1991) Empirical Labor Economics: The Search Approach. Oxford University Press: Oxford;
Dolado JJ, Garcia-Serrano C, Jimeno JF (2002) Drawing Lessons from the Boom of Temporary Jobs in Spain. The Economic Journal 112, F270-F295;
Dolado JJ, Jansen M, Jimeno JF (2007) A Positive Analysis of Targeted Employment Protection Legislation. The B.E. Journal of Macroeconomics 7(1), 14;
Fahr R, Sunde U (2001) Disaggregate Matching Functions. IZA Discussion Paper, n. 335;
Gagliarducci S (2005) The Dynamics of Repeated Temporary Jobs. Labour Economics 12(4), 429-448; Gregg P, Petrongolo B (2005) Stock-Flow Matching and the Performance of the Labour Market. European Economic Review 49(8), 1987-2001;
Hynninen SM, Lahtonen J (2007) Does Population Density Matter in the Matching Process of Heterogeneity Job-Seekers and Vacancies? Empirica 34(5), 397-410;
Ichino A, Mealli F, Nannicini T (2005) Temporary work agencies in Italy: A springboard to permanent employment?. Giornale degli Economisti e Annali di Economia 64(1), 1-27.
Jackman R, Roper S (1987) Structural Unemployment. Oxford Bulletin of Economics and Statistics 49(1), 9-37;
Jimeno JF, Toharia L (1993) The Effects of Fixed-Term Employment on Wages: Theory and Evidence from Spain. Investigaciones Economicas 17(3), 475-494;
Kahneman, D (2011) Thinking, Fast and Slow. New York: Farrar, Strauss, Giroux
Lindeboom M, van Ours JC, Renes G (1994) Matching Employers and Workers: An Empirical Analysis on the Effectiveness of Search. Oxford Economics Papers 46(1), 45-67;
Mortensen DT (1987) Job Search and Labor Market Analysis. in Handbook of Labor Economics, eds. O. Ashenfelter and R. Layard, chapter 15 vol. 2: 849-919. Elsevier: Amsterdam;
Newey WK (1987) Efficient Estimation of Limited Dependent Variable Models with Endogeneous Explanatory Variables. Journal of Econometrics 36(3), 231–250.
Nicoletti C, Rondinelli C (2010) The mis-specification of discrete duration models with unobserved heterogeneity: a Monte Carlo study. Journal of Econometrics 159(1), 1-13.
Petrongolo B (2001) Reemployment Probabilities and Returns to Matching. Journal of Labor Economics 19(3), 716-741;
Petrongolo B, Pissarides CA (2001) Looking into the Black Box: A Survey of the Matching Function. Journal of Economic Literature 39(2), 390-431;
Smith RJ, Blundell RW (1986) An exogeneity test for a simultaneous equation Tobit model with an application to labor supply. Econometrica 54(3), 679-685
van Ours JC, Ridder G (1995) Job Matching and Job Competition: Are Lower Educated Workers at the Back of Job Queues? European Economic Review 39(9), 1717-1731.
Figure 1. Distribution of the Heterogeneity Index
Source: own elaboration on IEFP data
Graph 1. Predicted hazard rates and Mismatch Index
Competing risk analysis by mismatch index Hazard rates at job-centres level (exit on PC+TC) by mismatch index
Source: own elaboration on IEFP data
0 2 4 6 8 10 D e ns ity -1 -.5 0 .5 1 HI 0.000 0.001 0.002 0.003 0.004 0.005 0.006 0.007 0.008 0.009 0.010 0.011 -1 -0.8 -0.6 -0.4 -0.2 0 0.2 0.4 0.6 0.8 1 hazard male hazard female
Tables
Table 1a. Descriptive statistics: Male sample
Source: own elaboration on IEFP data
Table 1b. Descriptive statistics: Female sample
Mean Std. Dev. Mean Std. Dev. Mean Std. Dev. Mean Std. Dev. Mean Std. Dev. Age 32.790 12.200 33.553 12.826 28.042 9.857 30.345 10.705 32.833 11.009 Married 0.404 0.491 0.403 0.490 0.303 0.460 0.310 0.463 0.457 0.498 Disabled 0.010 0.101 0.011 0.106 0.010 0.099 0.010 0.099 0.008 0.088 No dependent persons 0.663 0.473 0.675 0.468 0.723 0.447 0.683 0.465 0.606 0.489 1 dependent person 0.152 0.359 0.146 0.354 0.124 0.330 0.139 0.346 0.176 0.381 2 dependent persons 0.118 0.323 0.111 0.314 0.100 0.300 0.111 0.315 0.143 0.350 3 or more dependent persons 0.068 0.251 0.067 0.250 0.052 0.223 0.066 0.249 0.074 0.262 Max 6 year of education 0.453 0.498 0.454 0.498 0.442 0.497 0.453 0.498 0.454 0.498 9 years of education 0.221 0.415 0.221 0.415 0.231 0.421 0.243 0.429 0.212 0.409 11-12 years of education 0.260 0.439 0.252 0.434 0.297 0.457 0.272 0.445 0.266 0.442 More than 12 years of education 0.066 0.249 0.072 0.259 0.031 0.172 0.032 0.176 0.068 0.252 Employed 0.033 0.178 0.034 0.182 0.050 0.218 0.038 0.191 0.022 0.148 First job 0.165 0.371 0.187 0.390 0.232 0.422 0.134 0.341 0.091 0.288 Student 0.065 0.247 0.073 0.260 0.090 0.286 0.065 0.247 0.037 0.189 Ex-student 0.073 0.260 0.084 0.277 0.106 0.308 0.049 0.215 0.038 0.191 End of training period 0.016 0.125 0.015 0.123 0.022 0.146 0.014 0.118 0.016 0.125 Dismissed 0.180 0.385 0.174 0.379 0.179 0.384 0.122 0.327 0.206 0.405 Resigned 0.129 0.335 0.144 0.351 0.117 0.321 0.099 0.299 0.100 0.300 End of temporary contract 0.343 0.475 0.301 0.459 0.276 0.447 0.438 0.496 0.463 0.499 Other motivation 0.175 0.380 0.192 0.394 0.197 0.397 0.203 0.402 0.119 0.324 Manager-Specialist 0.074 0.262 0.084 0.278 0.022 0.147 0.013 0.113 0.075 0.263 Technical 0.112 0.315 0.119 0.324 0.083 0.275 0.066 0.249 0.111 0.314 Administrative 0.132 0.338 0.133 0.340 0.124 0.330 0.139 0.346 0.130 0.336 Services 0.100 0.301 0.097 0.296 0.106 0.308 0.154 0.361 0.099 0.298 Agricultural 0.037 0.188 0.026 0.160 0.015 0.120 0.072 0.258 0.065 0.247 Blue-collar 0.372 0.483 0.366 0.482 0.422 0.494 0.344 0.475 0.377 0.485 Other 0.193 0.394 0.209 0.407 0.210 0.408 0.213 0.410 0.140 0.347 Young benefit 0.044 0.206 0.035 0.183 0.039 0.195 0.045 0.208 0.071 0.257 Unemployment benefit 0.071 0.257 0.077 0.267 0.033 0.179 0.028 0.166 0.074 0.262 Training 0.262 0.794 0.319 0.869 0.146 0.597 0.114 0.537 0.180 0.659 Local wage 53930.8 30445.6 49243.6 32694.4 61027.1 23349.0 66841.7 20567.6 61608.3 24703.3 Norte 0.338 0.473 0.360 0.480 0.371 0.483 0.091 0.288 0.309 0.462 Centro 0.162 0.369 0.150 0.357 0.306 0.461 0.191 0.393 0.141 0.348 Lisbon 0.382 0.486 0.390 0.488 0.281 0.449 0.427 0.495 0.390 0.488 Alentejo 0.063 0.243 0.056 0.231 0.027 0.162 0.058 0.233 0.092 0.289 Algarve 0.054 0.227 0.044 0.204 0.016 0.125 0.233 0.423 0.067 0.251 Log flow unemployment 5.799 0.597 5.839 0.592 5.621 0.614 5.740 0.600 5.766 0.589 Log flow vacancies 4.481 1.018 4.460 1.028 4.546 0.892 4.710 0.953 4.478 1.038 Heterogeneity index 0.303 0.345 0.292 0.340 0.152 0.247 0.630 0.299 0.332 0.355
TC OM
Source: own elaboration on IEFP data
Table 2. Desired and destination contracts
Mean Std. Dev. Mean Std. Dev. Mean Std. Dev. Mean Std. Dev. Mean Std. Dev. Age 31.662 11.058 32.118 11.407 28.177 9.395 32.550 11.173 31.589 10.446 Married 0.486 0.500 0.478 0.500 0.449 0.497 0.526 0.499 0.510 0.500 Disabled 0.004 0.064 0.004 0.067 0.004 0.064 0.005 0.068 0.003 0.056 No dependent persons 0.552 0.497 0.571 0.495 0.564 0.496 0.441 0.497 0.523 0.499 1 dependent person 0.234 0.423 0.218 0.413 0.234 0.423 0.280 0.449 0.263 0.440 2 dependent persons 0.156 0.363 0.151 0.358 0.148 0.355 0.200 0.400 0.164 0.370 3 or more dependent persons 0.058 0.234 0.060 0.238 0.054 0.227 0.079 0.269 0.050 0.218 Max 6 year of education 0.450 0.497 0.453 0.498 0.437 0.496 0.492 0.500 0.436 0.496 9 years of education 0.188 0.391 0.188 0.391 0.203 0.402 0.191 0.393 0.181 0.385 11-12 years of education 0.267 0.442 0.261 0.439 0.308 0.462 0.233 0.423 0.275 0.447 More than 12 years of education 0.096 0.294 0.098 0.297 0.052 0.223 0.084 0.278 0.108 0.310 Employed 0.037 0.189 0.040 0.196 0.050 0.219 0.029 0.168 0.027 0.163 First job 0.188 0.390 0.218 0.413 0.234 0.423 0.122 0.327 0.109 0.312 Student 0.067 0.251 0.076 0.264 0.086 0.280 0.059 0.235 0.042 0.200 Ex-student 0.083 0.276 0.098 0.297 0.106 0.308 0.047 0.211 0.044 0.205 End of training period 0.024 0.153 0.020 0.141 0.024 0.152 0.019 0.136 0.035 0.184 Dismissed 0.157 0.364 0.156 0.363 0.170 0.376 0.116 0.320 0.164 0.370 Resigned 0.098 0.298 0.111 0.315 0.100 0.301 0.067 0.250 0.071 0.257 End of temporary contract 0.354 0.478 0.295 0.456 0.293 0.455 0.519 0.500 0.489 0.500 Other motivation 0.195 0.396 0.222 0.416 0.204 0.403 0.164 0.371 0.129 0.336 Manager-Specialist 0.083 0.276 0.097 0.295 0.023 0.150 0.014 0.119 0.086 0.281 Technical 0.044 0.205 0.048 0.213 0.028 0.166 0.015 0.123 0.046 0.210 Administrative 0.201 0.401 0.202 0.402 0.213 0.410 0.160 0.366 0.204 0.403 Services 0.277 0.448 0.278 0.448 0.321 0.467 0.284 0.451 0.256 0.437 Agricultural 0.055 0.229 0.027 0.163 0.024 0.154 0.155 0.362 0.117 0.321 Blue-collar 0.114 0.317 0.115 0.319 0.166 0.372 0.080 0.271 0.099 0.298 Other 0.217 0.412 0.244 0.430 0.221 0.415 0.174 0.379 0.155 0.362 Young benefit 0.051 0.220 0.038 0.192 0.044 0.204 0.065 0.246 0.083 0.277 Unemployment benefit 0.088 0.283 0.093 0.290 0.046 0.208 0.045 0.207 0.102 0.302 Training 0.309 0.828 0.380 0.907 0.236 0.730 0.156 0.591 0.188 0.654 Local wage 55389.3 29411.7 51139.1 31799.5 62399.4 21939.3 65461.7 19000.9 61405.2 24956.5 Norte 0.318 0.466 0.360 0.480 0.357 0.479 0.078 0.268 0.248 0.432 Centro 0.167 0.373 0.161 0.367 0.297 0.457 0.147 0.355 0.142 0.349 Lisbon 0.364 0.481 0.364 0.481 0.286 0.452 0.364 0.481 0.394 0.489 Alentejo 0.089 0.284 0.070 0.256 0.043 0.202 0.180 0.385 0.132 0.339 Algarve 0.062 0.241 0.045 0.207 0.017 0.128 0.231 0.421 0.084 0.278 Log flow unemployment 5.754 0.608 5.806 0.600 5.623 0.584 5.621 0.628 5.701 0.615 Log flow vacancies 4.452 1.048 4.449 1.033 4.547 0.908 4.505 1.029 4.413 1.131 Heterogeneity index 0.314 0.349 0.290 0.340 0.165 0.256 0.619 0.314 0.363 0.361
Source: own elaboration on IEFP data
Table 3. Determinants of looking for a Permanent contract
Censored Censored
38885 936
63.33% 68.42%
Own means Own means
15032 288 66.76% 66.67% PC TC PC TC 5166 2320 78 66 69.01% 30.99% 54.17% 45.83% Censored Censored 59088 1396 61.57% 63.89%
Own means Own means
23398 541 63.43% 68.57% PC TC PC TC 8507 4982 107 141 63.07% 36.93% 43.15% 56.85% MALE 22518 36.67% Uncensored 36887 38.43% 97.82% 2.18% 97.77% 2.23% 248 31.43% Employment-center 13489 36.57% FEMALE 95975 2185 Uncensored 789 36.11% Employment-center 31.58% Employment-center 144 33.33%
Looking for a PC Looking for a TC
7486 33.24% Employment-center Looking for a PC Uncensored Looking for a TC 61403 1368 Uncensored 432
Source: own elaboration on IEFP data
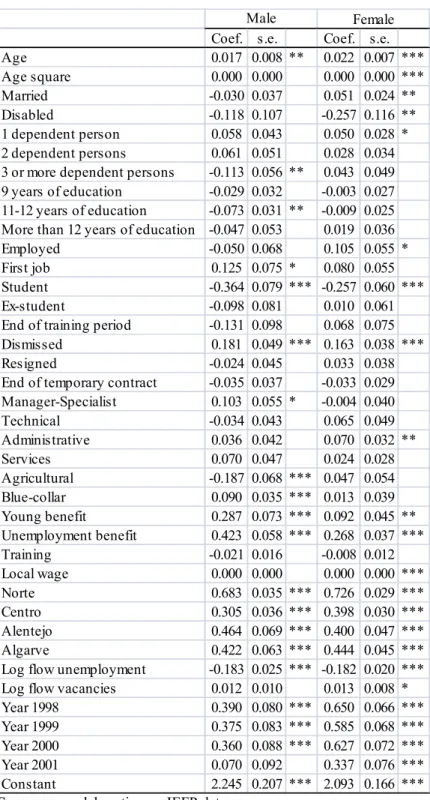
Table 4: Multinomial logit model: testing the hypothesis of superficiality
Coef. s.e. Coef. s.e.
Age 0.017 0.008 ** 0.022 0.007 *** Age square 0.000 0.000 0.000 0.000 *** Married -0.030 0.037 0.051 0.024 ** Disabled -0.118 0.107 -0.257 0.116 ** 1 dependent person 0.058 0.043 0.050 0.028 * 2 dependent persons 0.061 0.051 0.028 0.034
3 or more dependent persons -0.113 0.056 ** 0.043 0.049
9 years of education -0.029 0.032 -0.003 0.027
11-12 years of education -0.073 0.031 ** -0.009 0.025 More than 12 years of education -0.047 0.053 0.019 0.036
Employed -0.050 0.068 0.105 0.055 *
First job 0.125 0.075 * 0.080 0.055
Student -0.364 0.079 *** -0.257 0.060 ***
Ex-student -0.098 0.081 0.010 0.061
End of training period -0.131 0.098 0.068 0.075
Dismissed 0.181 0.049 *** 0.163 0.038 ***
Resigned -0.024 0.045 0.033 0.038
End of temporary contract -0.035 0.037 -0.033 0.029
Manager-Specialist 0.103 0.055 * -0.004 0.040 Technical -0.034 0.043 0.065 0.049 Administrative 0.036 0.042 0.070 0.032 ** Services 0.070 0.047 0.024 0.028 Agricultural -0.187 0.068 *** 0.047 0.054 Blue-collar 0.090 0.035 *** 0.013 0.039 Young benefit 0.287 0.073 *** 0.092 0.045 ** Unemployment benefit 0.423 0.058 *** 0.268 0.037 *** Training -0.021 0.016 -0.008 0.012 Local wage 0.000 0.000 0.000 0.000 *** Norte 0.683 0.035 *** 0.726 0.029 *** Centro 0.305 0.036 *** 0.398 0.030 *** Alentejo 0.464 0.069 *** 0.400 0.047 *** Algarve 0.422 0.063 *** 0.444 0.045 ***
Log flow unemployment -0.183 0.025 *** -0.182 0.020 ***
Log flow vacancies 0.012 0.010 0.013 0.008 *
Year 1998 0.390 0.080 *** 0.650 0.066 *** Year 1999 0.375 0.083 *** 0.585 0.068 *** Year 2000 0.360 0.088 *** 0.627 0.072 *** Year 2001 0.070 0.092 0.337 0.076 *** Constant 2.245 0.207 *** 2.093 0.166 *** Male Female
Source: own elaboration on IEFP data
Table 5: Quantile regression: testing the hypothesis of preference revision
Source: own elaboration on IEFP data
Table 6. Mismatch index by employment-center
Outcomes Coef. s.e. Coef. s.e. Coef. s.e. Coef. s.e.
Permanent 0.497 0.119 *** 0.378 0.120 *** 0.643 0.101 *** 0.521 0.101 *** Temporary -0.172 0.129 -0.333 0.131 ** -0.189 0.090 ** -0.361 0.091 *** Own means 0.233 0.068 *** 0.146 0.069 ** 0.014 0.051 -0.054 0.052 Year dummies Male Female No Yes No Yes
Coef. Std. Err.
Coef. Std. Err.
OLS estimates 0.120
0.031 *** 0.164
0.024 ***
First quintile
0.288
0.087 *** 0.288
0.118 **
First quartile
0.223
0.083 *** 0.223
0.105 **
Median
0.154
0.050 *** 0.143
0.036 ***
Third quartile
0.150
0.043 *** 0.182
0.043 ***
Fourth quintile 0.103
0.035 *** 0.130
0.023 ***
Male
Female
Source: own elaboration on IEFP data
Tables 7. Hazard rates and contract mismatch in local labour markets
Region Job-centre Mean Std. Dev. Min Max Region Job-centre Mean Std. Dev. Min Max Viana do Castelo 0.421 0.254 -0.008 0.791 Caldas da Rainha 0.156 0.141 -0.059 0.661 Braga 0.064 0.151 -0.046 0.780 Abrentes 0.089 0.143 -0.024 0.977 Fafe 0.005 0.040 -0.034 0.209 Santarem 0.422 0.247 -0.041 0.910 Guimaraes 0.016 0.040 -0.026 0.189 Tomar 0.506 0.168 0.179 0.990 Vila Nova de Famaliçao 0.145 0.172 -0.007 0.827 Torres Novas 0.138 0.150 -0.015 0.972 Amarante 0.099 0.128 -0.052 0.458 Amadora 0.641 0.449 -0.010 1.000 Matosinhos 0.000 0.026 -0.069 0.087 Cascais 0.556 0.393 -0.033 0.968 Penafiel -0.003 0.023 -0.054 0.152 Conde Redondo 0.343 0.198 -0.044 0.731 Porto 0.421 0.224 -0.032 0.804 Picoas 0.431 0.319 -0.099 0.952 Povao do Varzim/Vila do Conde 0.013 0.063 -0.032 0.442 Loures 0.488 0.262 -0.017 0.992 Santo Tirso -0.011 0.024 -0.077 0.068 Moscavide 0.091 0.141 -0.052 0.538 Vila Nova de Gaia 0.016 0.048 -0.026 0.291 Torres Vedras 0.034 0.073 -0.030 0.398 Vila Real 0.377 0.253 -0.069 0.923 Vila Franca de Xira -0.011 0.067 -0.230 0.257 Chaves 0.012 0.084 -0.034 0.556 Almada 0.611 0.162 -0.015 0.982 Bragança 0.006 0.029 -0.021 0.164 Barreiro 0.147 0.265 -0.119 0.885 Macedo de Cavaleiros 0.124 0.183 -0.048 0.720 Montijo 0.045 0.128 -0.157 0.403 Mirandela 0.065 0.124 -0.051 0.616 Setubal 0.832 0.120 0.258 0.986 Torre de Moncorvo 0.029 0.069 -0.043 0.345 Salvaterra de Magos 0.678 0.249 -0.028 0.971 Felguiras -0.005 0.010 -0.035 0.019 Alcobaça 0.114 0.100 -0.020 0.424 Porto Ocidental -0.005 0.012 -0.045 0.025 Sintra 0.546 0.229 -0.455 0.784 Basto 0.458 0.410 -0.027 1.000 Alcantara 0.018 0.052 -0.053 0.192 Lamego 0.297 0.185 0.000 0.819 Benfica 0.781 0.175 -0.014 0.994 S. Joao de Madeira 0.004 0.023 -0.028 0.158 Seixal 0.576 0.158 -0.102 0.889 Arcas de Valvedez 0.337 0.206 0.000 0.857 Alacer do Sal 0.785 0.247 -0.050 1.000 Barcelos 0.011 0.047 -0.030 0.304 Sines 0.260 0.285 -0.036 0.794 Maia 0.073 0.181 -0.018 0.979 Elvas 0.582 0.244 0.049 0.978 Valongo 0.043 0.119 -0.022 0.662 Portalegra 0.505 0.292 -0.021 0.961 Gondomar 0.077 0.152 -0.056 0.789 Estremoz 0.644 0.256 0.052 0.989 Valença 0.019 0.063 -0.015 0.432 Evora 0.338 0.209 -0.005 0.812 Aveiro 0.229 0.195 -0.008 0.992 Beja 0.787 0.245 0.000 1.000 Agueda 0.055 0.075 -0.037 0.326 Ourique 0.053 0.156 -0.036 0.817 Coimbra 0.400 0.233 -0.016 0.970 Ponte de Sor 0.601 0.330 -0.054 1.000 Figueirada Foz 0.595 0.159 -0.020 0.984 Montemor o Novo 0.458 0.290 -0.018 1.000 Lousa -0.031 0.246 -0.449 0.668 Moura 0.811 0.275 -0.011 1.000 Leiria 0.134 0.112 -0.041 0.370 Faro 0.874 0.142 0.218 1.000 Marinha Grande 0.198 0.141 -0.029 0.517 Portimao 0.883 0.152 -0.032 0.989 S. Pedro do Sul 0.003 0.018 -0.022 0.080 Vila Real de Santo Antonio 0.864 0.117 0.476 0.992 Viseu 0.003 0.059 -0.090 0.275 Loule 0.870 0.147 0.000 0.960 Guarda -0.005 0.029 -0.065 0.099 Lagos 0.617 0.223 -0.011 0.993 Castelo Branco 0.450 0.237 -0.005 0.882
Covilha 0.015 0.050 -0.028 0.207 Arganil 0.167 0.093 -0.014 0.493 Figueiro dos Vinhos 0.185 0.144 -0.048 0.629 Tondela 0.674 0.173 -0.006 1.000 Seia 0.022 0.061 -0.036 0.280 Serta 0.074 0.095 -0.018 0.422 Pinhel 0.271 0.235 0.000 0.803 Norte Centro Lisboa Alentejo Algarve
Source: own elaboration on IEFP data
Table 8. Probability of mismatch and unemployment duration
Source: own elaboration on IEFP data
Table 9. Over-identification and exogeneity tests
Source: own elaboration on IEFP data
Appendix
Table A1 Estimation of duration dependence parameters (stock-flow matching)
Coef. Std. Err. Coef. Std. Err. Coef. Std. Err. Heterogeneity index -1.049 0.176 *** 5.700 0.295 *** -0.222 0.098 ** Heterogeneity index square -1.141 0.242 *** -3.248 0.282 *** 0.175 0.111 Heterogeneity index -1.011 0.135 *** 4.878 0.207 *** -0.239 0.079 *** Heterogeneity index square -1.000 0.182 *** -2.661 0.196 *** 0.309 0.088 *** MALESFEMALES
Permanent Contract Temporary Contract Own Mean
Coef. r.s.e. mfx Coef. r.s.e. mfx
-0.071 0.020 *** -0.024 -0.060 0.016 *** -0.022
Coef. s.e. mfx Coef. s.e. mfx
-0.116 0.023 *** -0.093 0.018 *** Instruments:
Ending month of the spell 0.085 0.001 *** 0.081 0.001 *** Starting year of the spell -0.087 0.001 *** -0.078 0.001 *** Pooled probit
IV Probit model
MALES FEMALES
Chi2 P-value > Chi2 Chi2 P-value > Chi2
Amemiya-Lee-Newey minimum Chi2 test 0.46 0.497 1.02 0.313
Chi2 P-value > Chi2 Chi2 P-value > Chi2
Smith-Blundell test 17.69 0.000 15.72 0.000
Wald test 17.70 0.000 15.74 0.000
EXOGENEITY TESTS Null hypothesis: the specified endogenous regressor may be treated as exogenous
MALES FEMALES
OVERIDENTIFICATION TEST Null hypothesis: instruments are uncorrelated with the error term in the structural equation
Source: own elaboration on IEFP data
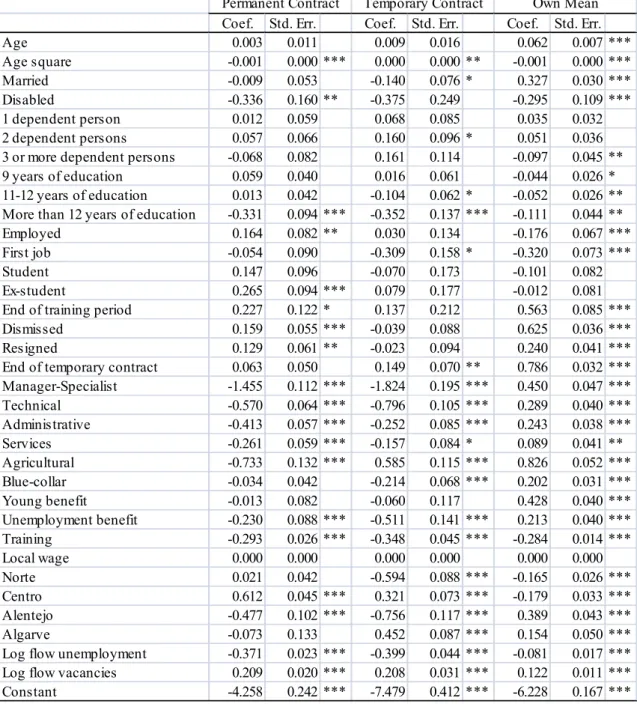
Table A2a. Estimation of covariates (stock-flow matching): male sample
Duration Coef. Std. Err. Coef. Std. Err. Coef. Std. Err.
1-3 months 1.225 0.055 *** 1.316 0.086 *** 0.621 0.034 *** 4-6 months 0.886 0.057 *** 1.114 0.088 *** 0.875 0.033 *** 7-9 months 0.421 0.064 *** 0.716 0.096 *** 0.504 0.035 *** 10-12 months 0.237 0.069 *** 0.357 0.109 *** 0.229 0.039 *** 13-18 months 19-24 months -0.359 0.075 *** -0.146 0.117 -0.424 0.045 *** 25-36 months -0.844 0.078 *** -0.663 0.128 *** -0.705 0.046 *** over 36 months -1.257 0.104 *** -1.041 0.181 *** -1.176 0.065 *** 1-3 months 0.766 0.042 *** 0.657 0.057 *** 0.369 0.028 *** 4-6 months 0.710 0.042 *** 0.765 0.055 *** 0.653 0.026 *** 7-9 months 0.246 0.047 *** 0.544 0.059 *** 0.406 0.028 *** 10-12 months -0.015 0.052 0.003 0.072 0.132 0.031 *** 13-18 months 19-24 months -0.288 0.053 *** -0.333 0.075 *** -0.230 0.034 *** 25-36 months -0.650 0.054 *** -0.713 0.079 *** -0.464 0.035 *** over 36 months -1.004 0.073 *** -1.124 0.113 *** -0.859 0.050 *** FEMALES base-category base-category
Permanent Contract Temporary Contract Own Mean