Universidade de Aveiro Departamento deElectr´onica, Telecomunica¸c˜oes e Inform´atica 2018
Ant´
onio
Ferreira Cardoso
Advanced Sheep Posture Controller
Universidade de Aveiro Departamento deElectr´onica, Telecomunica¸c˜oes e Inform´atica 2018
Ant´
onio
Ferreira Cardoso
Advanced Sheep Posture Controller
Controlador Avan¸
cado de Postura de Gado Ovino
Disserta¸c˜ao apresentada `a Universidade de Aveiro para cumprimento dos requisitos necess´arios `a obten¸c˜ao do grau de Mestre em Engenharia Eletr´onica e Telecomunica¸c˜oes, realizada sob a orienta¸c˜ao cient´ıfica do Pro-fessor Doutor Paulo Bacelar Reis Pedreiras, ProPro-fessor Auxiliar da Universi-dade de Aveiro, e do Professor Doutor Pedro Alexandre de Sousa Gon¸calves, Professor Adjunto da Universidade de Aveiro, com a colabora¸c˜ao de Lu´ıs Miguel Tom´e N´obrega, aluno do Programa Doutoral MAP-i na Universidade de Aveiro.
Dissertation submitted to the University of Aveiro in fulfillment of the re-quirements for the degree of Mestre em Engenharia Eletr´onica e Telecomu-nica¸c˜oes, under the supervision of Professor Doutor Paulo Bacelar Reis Pe-dreiras, Professor Auxiliar at the University of Aveiro, and co-supervision of Professor Doutor Pedro Alexandre de Sousa Gon¸calves, Professor Adjunto at the University of Aveiro, with the collaboration of Lu´ıs Miguel Tom´e N´obrega, student in the MAP-i Doctoral Programme at the University of Aveiro.
This work is supported by the European Structural Investment Funds (ESIF), through the Operational Competitiveness and Internationaliza-tion Programme (COMPETE 2020) [Project Nr. 017640 (POCI-01-0145-FEDER-017640)].
o j´uri / the jury
presidente / president Alexandre Manuel Moutela Nunes da Mota
Professor Associado, Universidade de Aveiro (por delega¸c˜ao do Reitor da Universidade de Aveiro)
vogais / examiners committee Professor Doutor Pedro Alexandre de Sousa Gon¸calves
Professor Adjunto, Universidade de Aveiro (co-orientador)
Luis Miguel Pinho de Almeida
Professor Associado, Faculdade de Engenharia da Universidade do Porto (Arguente Principal)
Acknowledgments I would like to thank everyone who accompanied my progress through-out the course and the writing of this thesis. Particularly, a special thanks to Professor Paulo Pedreiras for his constant support and com-mitment, which contributed to the success of the work carried out and to the quality of this dissertation. To Professor Pedro Gon¸calves, for his motivating speech and dedication to the success of the project and to my own success. To Luis Miguel N´obrega, who handled the task of answering my one million questions and doubts, while still produc-ing amazproduc-ing work for the project. To my lab colleagues, Rui Morais, Andr´e Temprilho and Jos´e Pereira, whose help was invaluable to this work, and to my sanity while producing it. To the Machine Learn-ing colleagues, Borys Chystov and Jo˜ao Constantino, for their support in developing one of the most complex parts of the project. To the colleagues at ESAV-IPV, for their support and shared knowledge on animal behavior, essential to this work’s development. To my relatives and friends, who put up with my mood during these very hard years. To my future wife, my single greatest motivation for always trying to reach higher in every aspect of life.
Agradecimentos Gostaria de agradecer a todos os que acompanharam e apoiaram o meu progresso ao longo do curso e, especialmente, desta disserta¸c˜ao. Particularmente, um agradecimento especial ao Professor Paulo Pe-dreiras pelo seu apoio e orienta¸c˜ao constantes, que contribu´ıram para o sucesso deste trabalho e para a qualidade deste documento. Ao Professor Pedro Gon¸calves, pelo seu discurso motivador e pela sua dedica¸c˜ao ao sucesso do projecto, bem como ao meu pr´oprio sucesso. Ao Lu´ıs Miguel N´obrega, que lidou com a tarefa de responder ao meu milh˜ao de perguntas e d´uvidas, ao mesmo tempo que produzia trabalho impressionante para o projecto. Aos meus colegas de laborat´orio, Rui Morais, Andr´e Temprilho e Jos´e Pereira, cuja ajuda foi indispens´avel a este trabalho, e `a minha sanidade enquanto o produzi. Aos colegas de Machine Learning, Borys Chystov e Jo˜ao Constantino, pelo seu apoio no desenvolvimento de uma das partes mais complexas do projecto. Aos colegas na ESAV-IPV, pelo seu apoio e conhecimento partilhado sobre comportamento animal, que foi essencial para o desenvolvimento deste trabalho. Aos meus parentes e amigos, que aturaram o meu hu-mor durante estes anos t˜ao dif´ıceis. `A minha futura esposa, a minha maior motiva¸c˜ao para tentar sempre chegar mais longe, em todos os
Abstract Weed control in vineyards is an actual and important problem in mod-ern viticulture. Traditional methods, mechanical- or chemical-based, are expensive and hazardous to the environment and cultures. Con-trolling weed infestation through pasturing animals is an ancient and environmentally friendly technique. However, animals cannot be used on vineyards for the entire production cycle, because they tend to feed from vine branches and fruits. The SheepIT project aims to solve this limitation through automated behavior monitorization and condition-ing of sheep pasturcondition-ing in vineyards. To achieve this, an IoT network architecture, with electronic collars placed on the animals’ neck at its base, was designed and implemented, prior to this work’s development. This dissertation describes the design, implementation and validation of the posture control algorithm, whose objective is to teach sheep, through stimulation, to eat only ground weeds, avoiding vine branches and grapes. The algorithm relies on sensors installed in the collar to retrieve information on the sheep’s posture, and conditions its behavior through actuators, also embodied on the collar. These activities are carried out concurrently with other system services, e.g. virtual fencing and flock data logging, which are out of the scope of this dissertation.
Resumo O controlo de esp´ecies vegetais infestantes em vinhas ´e um problema actual na viticultura moderna. M´etodos tradicionais, mecˆanicos ou quimicos, s˜ao dispendiosos e potencialmente perigosos para o ambi-ente e as culturas circundantes. O uso de animais em pastoreio para controlar ervas infestantes ´e uma alternativa antiga e ambientalmente sustent´avel. No entanto, os animais n˜ao podem ser usados em vinhas durante todo o ciclo de produ¸c˜ao, visto que tendem a alimentar-se dos ramos e frutos das videiras. O projecto SheepIT pretende resolver este problema atrav´es da monitoriza¸c˜ao e condicionamento do comporta-mento de ovelhas a pastar em vinhas. Para este fim, uma arquitectura de rede IoT, baseada em coleiras electr´onicas colocadas nas ovelhas, foi desenhada e implementada, anteriormente ao desenvolvimento deste trabalho. Esta disserta¸c˜ao descreve o desenho, a implementa¸c˜ao e val-ida¸c˜ao do algoritmo de controlo de postura, cujo objectivo ´e ensinar as ovelhas, atrav´es de estimula¸c˜ao, a alimentar-se das ervas infestantes, evitando ramos e frutos das videiras. O algoritmo recorre a sensores instalados na coleira para obter informa¸c˜ao, e condiciona o comporta-mento da ovelha atrav´es de actuadores tamb´em instalados na mesma. Estas actividades s˜ao efectuadas concorrentemente com outros servi¸cos do sistema (e.g. mecanismo de cerca virtual e armazenamento de da-dos), que v˜ao al´em do foco desta disserta¸c˜ao.
Index
Index i
Index of Figures v
Index of Tables vii
Acronyms ix
1 Introduction 1
1.1 Motivation and Objectives . . . 1
1.2 Document Structure . . . 2
2 State of the Art 5 2.1 Animal Monitoring Solutions . . . 5
2.1.1 Location Monitoring . . . 6
2.1.2 Activity and Posture Monitoring . . . 9
2.1.3 Complex Data Analysis . . . 11
2.2 Animal Conditioning Techniques . . . 12
2.2.1 Pasture and Location Control . . . 12
2.2.2 Animal Health and Wellness . . . 15
2.3 Discussion . . . 16
3 The SheepIT Project 17 3.1 General Architecture . . . 17
3.2 Network . . . 19
3.2.1 Communications . . . 19
3.2.2 Beacons . . . 20
3.2.3 Gateway . . . 20
3.3 Cloud Computational Platform . . . 21
3.4 Collars . . . 22
3.4.1 Sensor and Actuator Technology . . . 23
3.4.2 Functionality . . . 27
3.5 Limitations . . . 29
4 Hardware and Firmware Enhancements 33
4.1 Added and Modified Hardware . . . 33
4.1.1 Static Acceleration and Magnetic Field . . . 33
4.1.2 Dynamic Acceleration . . . 35
4.1.3 Electrostatic Discharge Module . . . 35
4.2 Low-Level Firmware . . . 36
4.2.1 Device Drivers . . . 37
4.2.2 Automatic Sensor Calibration . . . 41
4.2.3 Digital Filtering . . . 43
4.2.4 Calculations and Transformations . . . 45
4.2.5 Stimuli Combination and Configuration . . . 49
4.3 Discussion . . . 52
5 Added Functionalities 53 5.1 Remote Command . . . 53
5.2 Training Mode . . . 56
5.3 Discussion . . . 59
6 Enhanced Control Algorithm 61 6.1 Decision Tree Control Algorithm . . . 61
6.1.1 Posture Classification . . . 62
6.1.2 Activity Classification . . . 65
6.1.3 Final Decision Tree . . . 67
6.2 Stature Adaptation . . . 68
6.3 Slope Adaptation . . . 69
6.4 Flock Slope Adaptation . . . 72
6.5 Discussion . . . 74
7 Results and Performance Analysis 75 7.1 Hardware and Firmware Enhancements . . . 75
7.1.1 Fixed Point Calculation . . . 75
7.1.2 3-Dimensional Angles . . . 77
7.1.3 Neck Angle . . . 78
7.1.4 Electrostatic Discharge Module . . . 80
7.2 Enhanced Control Algorithm . . . 81
7.2.1 Decision Tree Control Algorithm . . . 81
7.2.2 Stature Adaptation . . . 82
7.2.3 Slope Adaptation . . . 83
7.3 Animals’ Behavior Evolution . . . 85
7.3.1 Direct Stimulus Response . . . 85
7.3.2 Learning Process . . . 86
8 Conclusions and Future Work 89
8.1 Conclusions on the Performance of the Control Algorithm . . . 89
8.2 Challenges and Work Proposals for the Future . . . 90
Bibliography 91 A Raw Results 95 B Electrical Schematics 102 B.1 Ultrasound Transducer . . . 102
B.2 Sound Transducer . . . 104
B.3 Step-Up / High Inductance Transformer . . . 104
C Technology 105 C.1 SPI . . . 105
C.1.1 General Information . . . 105
C.1.2 ADLX345 Interface Protocol . . . 107
C.1.3 LSM303C Interface Protocol . . . 108
Index of Figures
1.1 Sheep Pasturing in Vineyards . . . 1
2.1 The Australian Oz Track Platform . . . 6
2.2 The e-Pasto Platform . . . 7
2.3 Distance from RSSI Linearization Examples . . . 8
2.4 Griffon Vultures Accelerometric Patterns . . . 10
2.5 Sound Spectrogram . . . 10
2.6 ML Decision Tree . . . 11
2.7 Feeding Control . . . 12
2.8 Localization Control Strategies . . . 13
2.9 Cattle Infraction Rate Evolution . . . 14
2.10 β-endorphin and Cortisol Tests . . . 15
3.1 General Architecture Illustration . . . 18
3.2 Example of Communications Structure . . . 20
3.3 CCP Architecture . . . 21
3.4 Collar Architecture . . . 22
3.5 Neck Distance To Ground . . . 23
3.6 Ultrasound Distance Measurement . . . 23
3.7 Ultrasound Measurement Range Limitation . . . 24
3.8 Ultrasound Transducer . . . 25
3.9 3-axis Accelerometer . . . 25
3.10 Step-Up Transformer . . . 26
3.11 Collar Modules Message Sequence Chart . . . 27
3.12 Collar Control Activity Diagrams . . . 28
3.13 Modified Collar Posture Control Activity Diagram . . . 31
4.1 High Inductance Transformer . . . 35
4.2 Electrostatic Discharge Module Block Diagram . . . 35
4.3 Read Axes Val Routine . . . 38
4.4 Shock Routine . . . 39
4.5 Sensor Measurement and Actuator Control Structures . . . 40
4.7 Axial Systems . . . 45
4.8 Angle and Distance Linearization . . . 47
4.9 Predicted Linearization Error . . . 48
4.10 Original Stimuli Combination Sequence . . . 49
4.11 Modified Stimuli Combination Sequence . . . 50
4.12 Infraction Filters . . . 51
5.1 Remote Command Menu . . . 54
5.2 Remote Command Message Sequence Diagram . . . 54
5.3 Original Collar State Machine . . . 56
5.4 Training Mode Collar State Machine . . . 57
5.5 Collar Re-Synchronization Strategy . . . 58
6.1 Field Testing Collars . . . 62
6.2 Classification Rules . . . 63
6.3 Posture Decision Trees . . . 64
6.4 Decision Tree Control Algorithm . . . 67
6.5 Effect of Height Differences between Sheep . . . 68
6.6 Slope, Neck and Pitch Angles . . . 69
6.7 Stature and Slope Adaptive Control Algorithm . . . 70
6.8 Slope and Heading Deviation effects on Pitch Angle . . . 71
6.9 Flock Slope Adaptation . . . 73
7.1 Processing Time Comparison . . . 76
7.2 Tilt Compensation Error . . . 77
7.3 Sheep Model . . . 78
7.4 Electrostatic Discharge Module Test . . . 80
A.1 Resting Decision Trees . . . 101
A.2 Running Decision Trees . . . 101
B.1 Emitter Pulse Driver . . . 102
B.2 Receiver Filter and Amplifier . . . 103
B.3 Receiver Edge Detection . . . 103
B.4 Audio Stimulus Control Circuit . . . 104
B.5 Electrostatic Stimulus Control Circuit . . . 104
C.1 SPI Connections . . . 105
C.2 SPI Communication Protocol . . . 106
C.3 ADLX345 Read and Write Operations . . . 107
C.4 LSM303C Read and Write Operations . . . 108
Index of Tables
4.1 Configuration Routine List . . . 37
4.2 Kalman Filter Parameters . . . 44
4.3 Axial System Adjustments . . . 45
5.1 Remote Command Message Structure . . . 55
5.2 Remote Command List . . . 55
6.1 Posture Decision Tree Accuracy . . . 64
6.2 Posture Confusion Matrices . . . 64
6.3 Resting Decision Tree Accuracy . . . 66
6.4 Running Decision Tree Accuracy . . . 66
7.1 Linearization Error Quantification . . . 79
7.2 Electrostatic Discharge Single Pulse Characteristics . . . 80
7.3 Final Decision Tree Accuracies . . . 81
7.4 Stature Adaptation Results . . . 82
7.5 Slope Angle Adaptation Laboratory Results . . . 83
A.1 Pitch Angle Verification . . . 96
A.2 Roll Angle Verification . . . 97
A.3 Heading Angle Verification . . . 98
Acronyms
IoT Internet of Things
GNSS Global Navigation Satellite System GPS Global Positioning System
RSSI Received Signal Strength Indicator LQI Link Quality Indicator
ML Machine Learning
LDA Linear Discriminant Analysis ANN Artificial Neural Network
CART Classification and Regression Tree
ECMA Electronic Collar Manufacturer’s Association WSN Wireless Sensor Network
CCP Cloud Computational Platform ISM Industrial, Scientific and Medical TDMA Time Division Multiple Access CSMA Carrier Sense Multiple Access MC Macro-Cycle
uC Micro-Cycle
SW Synchronization Window TAW Turn Around Window
VTW Variable Traffic-type Window
GSM Global System for Mobile Communications AMQP Advanced Message Queuing Protocol JSON JavaScript Object Notation
REST Representational State Transfer API Application Programming Interface
PWM Pulse Width Modulation
MEMS Micro Electro Mechanical Systems SPI Serial Peripheral Interface
USART Universal Synchronous/Asynchronous Receiver/Transmitter I2C Inter-Integrated Circuit
GPIO General Purpose Input/Output PCB Printed Circuit Board
FIFO First In, First Out FPU Floating Point Unit LUT Look-Up Table
ESAV-IPV Escola Superior Agr´aria de Viseu - Instituto Polit´ecnico de Viseu SS Slave-Select
SCL Serial Clock Line MOSI Master Out, Slave In MISO Master In, Slave Out
Chapter 1
Introduction
This dissertation was developed within the scope of the SheepIT project [1], whose ob-jective is developing an innovative solution for the removal of infesting flora in agriculture, based on Internet of Things (IoT) technologies applied to sheep pasture control.
1.1
Motivation and Objectives
Infesting flora within cultures is a very common problem in agriculture, since plants naturally compete for nutrients, water and light when confined to the same area. Their removal, however, implies significant investments in labor and equipment. Usual methods include hoeing and herbicide pulverization, which are either very laborious or hazardous for the environment and the cultures themselves.
An ancient alternative consists on the usage of grazing animals to eliminate the invading species. This technique’s downfall lies in the lack of control over what flora the animals target, and results in a threat to the cultures (Figure 1.1).
(a) Sheep Roaming Freely (b) Sheep Feeding on Vines
This project’s objective is to develop an autonomous system which can condition sheep posture and location, through sensing and application of stimuli, as a way of conditioning the sheep’s behavior, such that they could be used in the removal of infesting species without threatening the cultures or themselves. Currently, the culture under focus are vineyards located in low and medium slope terrain.
At the beginning of this work, the system was comprised of a Collar which already integrated some sensors and actuators, but an algorithm which could effectively detect posture infractions was non-existent. Therefore, this work’s focus is on an algorithm to translate data from the Collar’s sensors into information about the sheep’s current posture, and apply stimuli when necessary. This unravels into the following objectives:
Studying solutions for improving the reliability of sensor measurements; Analyzing the state of the art in animal posture control solutions;
Improving the overall system hardware, according to the needs evidenced by studies previously conducted in the SheepIT project;
Implementing a solution for improved measurement reliability, based on the available hardware;
Upgrading the previously functional prototype to enable the new features;
Developing a control algorithm for monitoring and conditioning of sheep posture; Testing the prototype’s performance on the field, and adjusting the algorithm for
improved results;
Validating the proposed solution through field testing.
1.2
Document Structure
This dissertation is divided into eight chapters:
Chapter 2: State of the Art
This chapter presents a survey of systems currently available for carrying out animal posture monitoring and conditioning. Moreover, their suitability for satisfying the SheepIT project’s requirements is analyzed.
Chapter 3: The SheepIT Project
An overall description of the SheepIT project’s system architecture, used as basis for this work, is presented in this chapter. A detailed description of the Collars’ architecture and control system’s components and interconnections is also included. The chapter concludes with a discussion of the existing architecture’s limitations.
Chapter 4: Hardware and Firmware Enhancements
This chapter introduces the additions and modifications made to the Collar hardware and low-level firmware, derived from the limitations described in the previous chapter. It presents the motivations behind each improvement, followed by a description of its implementation.
Chapter 5: Added Functionalities
Two new functionalities, designed to handle some of the project’s requirements, are presented in this chapter. It describes their motivation, implementation and integra-tion into the SheepIT project’s architecture.
Chapter 6: Enhanced Control Algorithm
This chapter presents an Enhanced Posture Control Algorithm, which is the main focus of this dissertation’s work. Its development is described in a progressive manner, detailing the full design and implementation process.
Chapter 7: Results and Performance Analysis
In this chapter, the results of lab and field tests are analyzed and the algorithm’s performance is assessed according to several parameters and indicators.
Chapter 8: Conclusions and Future Work
Finally, conclusions about the work produced are taken, and suggestions for potential improvements are presented.
Chapter 2
State of the Art
This chapter presents a survey of current technologies applied to animal behavior mon-itoring and control. Solutions are divided into two groups, according to their focus:
Animal Monitoring Solutions Animal Conditioning Techniques
2.1
Animal Monitoring Solutions
The first step towards controlling animal behavior is being able to monitor its actions. In the present case, two major behavior types need to be monitored:
Location
Knowledge of the sheep’s current position is needed, both for information gathering and to determine whether the animals are standing in or headed to a forbidden area (e.g. outside the desired grazing perimeter).
Activity and Posture
Distinguishing between resting, eating and walking is essential to the decision-making algorithm. Additionally, separating grazing from browsing (e.g. up or head-down) allows to determine if sheep are eating the infesting species or attacking the vines.
2.1.1
Location Monitoring
The ability to determine the animals’ geographic position is quite important for many different applications. Wild animals have been commonly monitored using Global Naviga-tion Satellite System (GNSS) (mostly Global PosiNaviga-tioning System (GPS)) collars for a few years. For domestic animals, however, GPS-based solutions have two great limitations:
High energy consumption, causing large reductions in battery life-span (a GPS mod-ule designed for extremely low power such as the UBX-M8230-CT [2] still consumes 5 mA at its lowest power setting, which is in the same order of magnitude as a low-power microcontroller such as the CC1110 [3]);
Signal loss caused by obstacles and interference, limiting locations where the tech-nology can be applied.
Even so, the majority of solutions still implement GPS-based localization.
GPS-based Solutions
Relevant scientific examples are:
The Australian OzTrack platform [4] applies GPS and additional sensor hard-ware to retrieve telemetric location data, which is then analyzed and uploaded to the platform. Hunter et al. (2013) [5] develops one case study for this platform, using devices placed on crocodiles (Figure 2.1a). The telemetry data is sent to the platform which performs several operations, including statistical studies and classifi-cation through regression. The available web interface (Figure 2.1b) allows users to select which project they want to monitor, and then provides tools for easy identifi-cation of the animals’ localization and trajectory. The telemetric data is also crossed with environmental data from several sources, and enables further studies on animal behavior.
(a) Crocodile wearing Device (b) Web Interface presenting Localization
The e-Pasto platform [6] combines GPS and an accelerometer to perform local-ization through collars placed on cows (Figure 2.2), and provides a web interface for viewing the current locations and defining virtual fences, which upon violation issues a message to the concerned farmer. To reduce power consumption of the GPS module, a duty-cycle method is applied. As shown in the work developed by Llaria et al. (2015) [7], this solution improves battery duration, at the cost of precision. As a way of dynamically adjusting the duty-cycle of GPS’ measurements, Terrasson et al. (2016) [8] proposed the use of accelerometer measurements to detect when there is movement (in the case study, a step), reducing unnecessary power consumption at times when the animals are stationary.
(a) Geolocation Device (b) Collar Placed on Cow
Figure 2.2: The e-Pasto Platform [7][8]
Many GPS-based commercial solutions are also available. Relevant examples are: NoFence [9] is a solar-powered GPS collar system, connected to a digital map. The
user can draw limits on the map, and the collars determine whether the animal is within this intended area. If not, audio and vibrational cues are emitted, followed by electrostatic stimulation. This is used to teach the animals to avoid the cues, and keeps them within the virtual fence.
eShepherd [10] is another GPS collar system, which can be controlled via a mobile application, and defines the virtual fence boundaries in a similar way as the previous example.
Alternatives
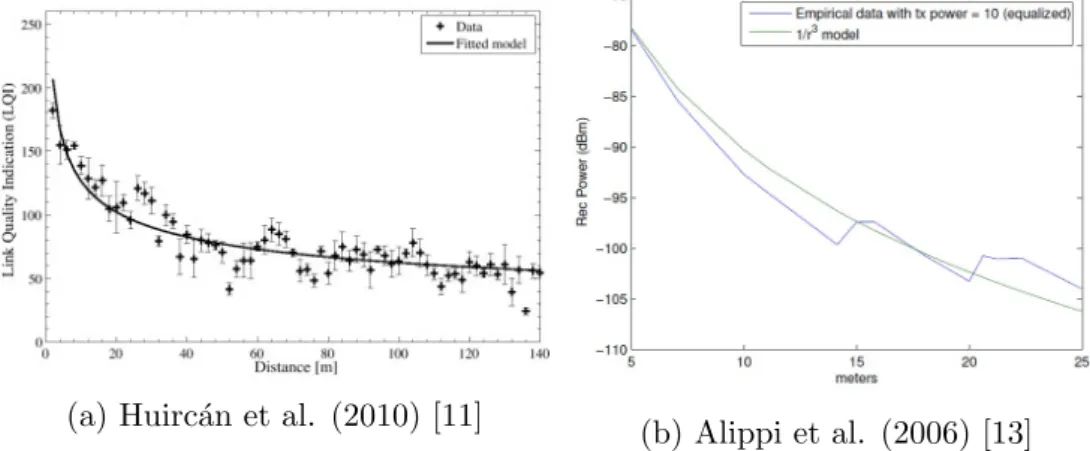
Localization alternatives are mostly based on radio systems implementing algorithms using fixed nodes with a known position and mobile nodes placed on the animals to esti-mate distance between them. The most common technique involves the use of a parameter designated Received Signal Strength Indicator (RSSI), which is related to the energy or power received by a node upon communicating, or Link Quality Indicator (LQI), which accounts for effects like interference and packet loss counts, to estimate inter-node distance. In the work developed by Huirc´an et al. (2010) [11], the relationship between LQI and distance is determined through linearization (Figure 2.3a). However, different implemen-tations for linear approximation of RSSI can be found in similar works from other authors, such as Dong et al. (2014) [12] and Alippi et al. (2006) [13] (Figure 2.3b).
(a) Huirc´an et al. (2010) [11]
(b) Alippi et al. (2006) [13]
Figure 2.3: Distance from RSSI Linearization Examples
Although this method presents a very attractive solution for low-cost and low-power ap-plications, the effectiveness of such solutions is still doubtful, particularly due to its lack of precision. Such parameters are greatly susceptible to interferences and noise, thus requiring additional mechanisms (e.g. filters, sensor fusion) to be considered reliable alternatives.
2.1.2
Activity and Posture Monitoring
Monitoring the animals’ activity and posture in the field has been an increasing need on the pasture community, particularly the livestock sector, since most traditional methods depend on constant human presence, and become very expensive with increasing herd size. Automated solutions are therefore widespread and vary in method and implementation. Some of the most common approaches are briefly described below:
Accelerometry
Tri-axial accelerometer measurements can be combined and analyzed to determine both posture and activity. Static and dynamic acceleration data collection yields encouraging results for methods ranging from calibrated thresholding to Machine Learning (ML) algorithms. An example is the work by Nathan et al. (2012) [14], where Griffon vultures’ behavioral modes are identified based on accelerometric data (Figure 2.4).
Audiometry
Sounds produced by the animals can be detected and analyzed to determine some activities (e.g. chewing). Figure 2.5 presents two sound spectrograms (in which red/darker zones represent higher intensities) captured for different chewing activity (ingestive and ruminating) on cows. Differences between them are identifiable to the naked eye (e.g. the pattern periods are different, pauses between peaks present lower intensity in the ruminating case). However, this method is quite sensitive to noise originating from outer sources, sometimes even other nearby animals, and spectrogram analysis requires expensive devices, processing power and memory (Tani et al.) (2013) [15].
Others
Air flow detection for monitoring breathing patterns and heart-rate sensing are other commonly used to monitor animal behavior, but are less relevant to the present study.
Figure 2.4: Griffon Vultures Accelerometric Patterns [14]
2.1.3
Complex Data Analysis
Since all information regarding the system’s state must be extracted from the raw data produced by the sensors associated with these methods, direct implementation of decision algorithms may not be viable, as the presence of recognizable data patterns is not always clear to the human eye.
ML algorithms can perform complex classifications on a set of training data and deter-mine parameters to differentiate between classes of activities.
In the work developed by Dutta et al. (2015) [16], monitoring collars are placed on cows, retrieving tri-axial accelerometry and magnetometry measurements. These are analyzed by a set of ML algorithms to determine thresholds that are later used to differentiate activities, using individual classifiers like Binary Tree or Naive-Bayes and ensembles of those classifiers. Precision and sensitivity rates are over 90% for some of the classified activities, even for the simpler individual classifiers like the ”Binary Tree”.
Diosdado et al. (2015) [17] extrapolate a Decision Tree from accelerometry data re-covered on dairy cows’ feeding activity. Again, the percentages of successful classification reach the 90% mark.
Moreau et al. (2009) [18] apply a very similar concept on goats, again with a Decision Tree classification, and the results obtained match the same success percentages.
The previously mentioned monitoring system for Griffon vultures developed by Nathan et al. (2012) [14] utilizes several ML algorithms (e.g. Linear Discriminant Analysis (LDA), Artificial Neural Network (ANN), Classification and Regression Tree (CART)) to classify the vultures’ behavior based on the recovered accelerometry data (Figure 2.6). Even for this extreme case, the success percentages are above 80%.
While most of these algorithms (e.g. ANN) would require heavy processing on the Collars to obtain the mentioned results, CARTs specifically produce a Decision Tree struc-ture as their output. These results can be used to generate simple decision algorithms, by converting said trees to series of ”if-else” statements, which require much less runtime computing power, making them ideal to be implemented in systems based on low-grade microcontrollers, and can statistically be expected to yield the precision achieved through the training process.
2.2
Animal Conditioning Techniques
In order to preserve the animals’ well-being and health, direct control of their behavior is not possible, since it would imply restricting their free-will. Therefore, the remaining option is to condition their actions, taking advantage of their inherent learning mechanisms, and lead them to behave as intended. When successful, animals adapt to the stimuli and eventually cease the unwanted behaviors. These learning processes are studied further by Garcia et al. (1966) [19], where rats are subjected to pairs of warning and punishment stimuli, and their behaviors documented. As a result of the experiment, rats associate the warning stimuli with a punishment and tend to avoid the corresponding behavior. Audiovisual followed by electrical stimuli was one of the most effective pairs.
2.2.1
Pasture and Location Control
In order to have herbivore animals and cultures coexisting within the same space, it is necessary to control their feeding activities. As an example, bovines were traditionally used for plowing, and, to avoid damaging nearby cultures, their mouths were restrained using ropes (Figure 2.7a).
As for pasture activities, a way of controlling the type of cultures the animals target is the use of chemicals that induce negative reactions from their digestive systems (Figure 2.7b). This type of reaction was tested on sheep (Burritt et al.) (1990) [20] and on lambs (Egber et al.) (1998) [21]. On both cases, the animals developed aversion to the intended species.
(a) Restraining Ropes [22] (b) Repelling Chemicals [23]
In the particular case of sheep pasture in vineyards, protecting the cultures becomes a simple posture control problem, since the infesting species are small, near-ground plants, and the vines’ potentially endangered parts are located in a higher part of the plants. In terms of traditional methods, restraining one of the animal’s legs to prevent it from reaching higher plants is the most common for sheep and goat species.
Traditional location control, as mentioned before, relies heavily on human monitoring and physical fencing, with all dangers (e.g. animals injured or trapped by the fences) and costs (e.g. installation across large areas) associated with such methods (Figure 2.8a). To obtain similar results regarding reliability, alternative solutions must be able to correctly match the animal’s location to acceptable or unacceptable behavior, and act accordingly. Ability to effect corrections on the animal’s behavior, while ensuring its well-being, is another requirement. In literature, these alternative location control strategies are usually referred to as virtual fences (Figure 2.8b).
(a) Barbed Wire Fence [22] (b) Virtual Fence [22]
Figure 2.8: Localization Control Strategies
Recent methods for both pasture and location control involve external stimuli applied to the animals when unwanted behavior is detected. Common stimuli choices are:
Visual
These are proven to be very effective on cattle, particularly goats and bovine, as they easily recognize and associate the signals with experiences (e.g. a preferred grazing spot), as shown by the experiments conducted by Howery et al. (2000) [24], where steers were successfully trained to associate visual markings with a type of food, locating it much faster than other untrained animals. This evolution was noticeable in under a week, by which point the time taken by the steers to locate the food had already dropped around 50%. These results suggest this kind of animals present steep learning curves.
Auditory
Sounds considered ”irritating” were used in an attempt to defer beef cows from spending time in unwanted pasture sites (Umstatter et al.) (2013) [25]. A virtual fence composed of loudspeakers was designed. Results were not efficient enough for standalone application, but were considered a potential reinforcement for other methods.
Electrical
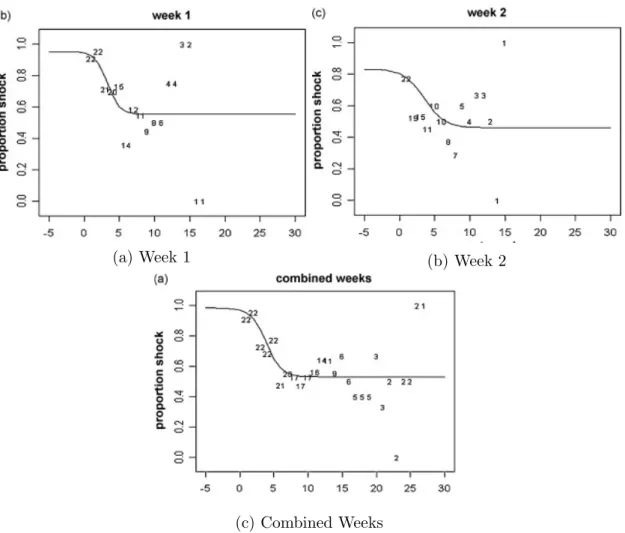
If the unwanted behavior is not corrected with help from the previous methods, electrostatic discharges are a common choice for stimuli, and yield very effective re-sults, as animals tend to avoid repeating the behavior, and associate this stimulation with the previous methods, that then serve as warnings. Lee et al. (2007/2009) [26][27] performed tests on cattle using audio cues as warnings and electrical stimuli as punishment. The results showed a steady decrease in electric shocks applied to the animals as time passed, even when the virtual fence boundaries were moved (Figure 2.9).
(a) Week 1 (b) Week 2
(c) Combined Weeks
Figure 2.9: Cattle Infraction Rate Evolution - The graphs present logistic learning curves for the virtual fencing experiment, for each week, and both weeks combined. In general, a decrease in applied electrical stimuli is observed. [27]
2.2.2
Animal Health and Wellness
All attempts at monitoring and conditioning animal behavior must always account for the animals’ well-being. Excessive effort or discomfort caused by the hardware’s weight, shape, or place of application and health issues regarding medium-to-long-term effects of the applied stimuli must be avoided at all costs.
Schalke et al. (2007) [28] monitored changes in behavior for dogs stimulated with training collars. Results indicate that aggressive stimuli should only be applied with very restricted timing and only for particular applications. By analyzing behavior of sheep’s stress-related hormones (e.g. cortisol, serotonine, β-endorphin) in response to an electrical stimulus, results suggest that utilizing other stimuli as warnings improves the animals’ well-being and reduces stress levels to a minimum, since the less aggressive warnings are rapidly associated to the coming punishment, which the animals then tend to avoid [29]. In terms of aggressiveness related to conventional methods such as head restraining, Figure 2.10 presents a test conducted to compare the effects of either approach.
Figure 2.10: β-endorphin and Cortisol Tests [29]
As is observable, hormone alterations are fairly equivalent. From this result, it can be concluded that these methods are no less humane than the conventional ones.
The Electronic Collar Manufacturer’s Association (ECMA) is an international author-ity who defines norms and limits to the strength and form of stimuli applied to animals in-training via collars. In the document published in 2008, ”Technical Requirements for Elec-tronic Pet Training and Containment Collars” [30], restrictions are defined for maximum current and voltage output to the animals, along with form restrictions (e.g. duty-cycle, frequency). These limits provide developers with a clearer view of the ethical boundaries associated with animal behavior conditioning.
2.3
Discussion
As shown in the two previous sections, there’s a large number and diversity of solutions for both monitoring and conditioning animal behavior. However, full implementations of control systems that combine the two components for both posture and location are practically non-existent at the present time. Therefore, this work also includes the study of how to combine both systems to achieve the best results, in terms of its ability to:
Determine, using the available sensor data, if the sheep is currently in transgression, and apply stimuli which lead it to revert its behavior;
Reduce, as time passes, the frequency of infractions that sheep incur in;
Avoid damage to the vines, while ensuring effective reduction in infesting plants’ spreading;
Maintain the stress levels of sheep equal or below the ones caused by traditional methods, without compromising any of the previous points.
The solution must also be implementable with as little computing resources as possible, so it can be integrated with low power, low cost hardware and meet real-time requirements. All these directives lead to the decisions made in the following chapters.
Chapter 3
The SheepIT Project
This chapter provides an overview of SheepIT’s system architecture prior to the work performed in this dissertation. It describes all the requirements, functionalities and im-plementation strategies considered. It concludes with an analysis of the architecture’s limitations that led to the changes and developments presented in the scope of this work. For additional information, the interested reader is referred to the published documents regarding the project by N´obrega et al. (2017) [31][32][33], which thoroughly explain the architecture described through the rest of this chapter.
3.1
General Architecture
As mentioned before, the project’s aim is to implement a system which can monitor and condition the behavior of sheep pasturing within vineyards, according to the following set of general requirements:
Sheep should be monitored and conditioned to graze on the infesting species without threatening the vines and grapes;
An area of confinement should be definable by the owner, based on geographic loca-tion, without the need for physical barriers;
Active intervention of humans should be as little as possible. The system should be fully autonomous, after installation;
Vineyards with low-to-medium slope should be allowed;
Any relevant data regarding the sheep’s behavior should be accessible through the Internet.
These requirements led to the development of a local Wireless Sensor Network (WSN) composed of three elements: Collars, Beacons and Gateway. The general concept behind this structure is:
Collars have a variety of sensors to retrieve data relative to activity, posture and location of the animal. They should also incorporate local processing capabilities to decide on whether to actuate. These nodes are responsible for ensuring behavioral correction on each sheep. Additionally, they transmit the sensor data to the network; Beacons receive data from Collars and other Beacons, later retransmitting it to their neighbors, ensuring that data reaches the required points. They also ensure Net-work synchronization and enable implementation of RSSI-based localization through transmission of periodic messages;
The Gateway receives data from the Beacons and nearby Collars and processes it. Then, the results are uploaded to a Cloud Computational Platform (CCP), and eventual decisions regarding other nodes are transmitted to the network. These commands are retransmitted by the Beacons so they reach every node.
Collar Collar Collar User Interface Computacional Platform Local Network Gateway Beacon Beacon
Figure 3.1: General Architecture Illustration [34]
This structure presents several advantages, including:
Flexible fixed node placement, with the restriction of being in range of at least three other fixed nodes to allow localization;
Hierarchical power consumption, relieving the more power restricted Collars from the packet forwarding responsibilities and charging the more resourceful Beacons with this task;
Fault tolerance on the Beacon side in the case of redundant area coverage. If one Beacon fails, the network remains functional.
Straightforward detection of missing or faulty nodes.
In the following sections, the project’s description is split into three parts. Firstly, the system’s local Network component is described. Secondly, a brief introduction to the CCP is performed. Finally, the Collars’ implementation is analyzed in more detail.
3.2
Network
The SheepIT local Network was primarily developed by Temprilho, in his master’s thesis [34], where further details about this implementation may be found.
From the project’s main requirements (low-power, simplicity, etc.), some directives were defined:
The whole network communicates on the same Industrial, Scientific and Medical (ISM) band (433 MHz);
The radio modules used are the same for every node to avoid interoperability issues; The network operates primarly on a Time Division Multiple Access (TDMA) scheme
to minimize collars’ energy consumption, namely through duty-cycle operation.
3.2.1
Communications
Communications are based on a TDMA scheme to minimize the nodes’ energy con-sumption. However, some actions (e.g. registration of new nodes entering the Network) need to be asynchronous, and this requires a Carrier Sense Multiple Access (CSMA) time window. Also, the number of nodes in the network can vary over time. This originated the following communications structure:
Time is split into Macro-Cycles (MCs), and these are further divided into Micro-Cycles (uCs);
uCs represent a given communications pattern. Each uC is composed of an initial Synchronization Window (SW), followed by a Turn Around Window (TAW) for processing, and then a Variable Traffic-type Window (VTW), where, depending on it’s type, communications are performed either through TDMA or CSMA;
The MC is composed of a sequence of uCs, in a specific order, which define a com-munication pattern that is then repeated while the system is online.
Figure 3.2 shows an example of MC and uC structure:
(b) uCs
Figure 3.2: Example of Communications Structure [34]
3.2.2
Beacons
Beacons are responsible for synchronizing communications and relaying information between all nodes within the Network. Three main types of messages are exchanged:
Beacon Synchro
These messages are periodically broadcast by each Beacon, during the SW, carrying its identification and information regarding the type of communications scheme that will happen in the following moments, i.e., defining the uC type. Moreover, nodes which receive this packet use it to synchronize with the Network.
Collar To Beacon
These messages are sent by the Collars and carry their identification, along with all their sensor data and other operational parameters, such as their infraction and step counts.
Beacon To Beacon
These messages are exchanged between Beacons, aggregating the data received from Collars with the objective of transporting it to the Gateway.
3.2.3
Gateway
The Gateway is the interface between the local Network and the CCP domains. All communications are directed to or from it. It implements all of the Beacons’ functionalities, but is connected to a computer, performing additional tasks such as:
Announcing the entry and exit of nodes from the Network;
Light processing tasks, such as reconstructing the Collars’ calculation results based on the raw data received from them;
Uploading all data, raw and processed, to the CCP, to be further processed and stored, so it can be remotely accessed;
In case of no connection to the CCP, storage of all processed data to be uploaded when possible;
Generating alarms for anomalous situations (e.g. panic detected).
Communication with the CCP is performed through a Global System for Mobile Commu-nications (GSM) link, for instance 2G, 3G or 4G.
Performing all these functions in parallel requires from the Gateway an ability to alter data formats and operate at very different timings. For this purpose, it operates on a multi-thread scheme, each thread executing one task at a specific rate.
3.3
Cloud Computational Platform
The CCP’s architecture was designed by Tavares [35], and is illustrated in Figure 3.3.
Figure 3.3: CCP Architecture [35]
The Gateway communicates with the CCP through Advanced Message Queuing Pro-tocol (AMQP). On the CCP, an AMQP broker (RabbitMQ [36]) receives the data sent in JavaScript Object Notation (JSON) format within a queue such that it can be consumed by the Apache Spark [37]. This platform is the project’s main processing tool, enabling heavy computations on the received data (e.g. ML, statistics). The raw and processed data is persisted on a database, which connects to a Representational State Transfer (REST)ful Application Programming Interface (API), allowing applications running on Web or Mobile platforms to access said data on demand through queries.
3.4
Collars
The Collars’ development was mostly performed by Morais, in the scope of his disserta-tion [22], which documents in detail the technologies used for their implementadisserta-tion. These modules are the only ones to directly interact with the animals, and are therefore a critical component of the system. A series of requirements are imposed on these elements:
Ergonomy
The physical properties of the module are important, since collars shall be carried by the animals and thus should not affect their well-being or health. Weight, size, shape, attachment strategy and other factors must be taken into account.
Energy Efficiency
Since these nodes must be the largest in number, smallest in size and are the hardest to replace, they are also the most energy-critical. Power consumption must therefore be as small as possible.
Regulation Compliance
Since this device will be conditioning animal behavior through stimuli which cause discomfort, it must be compliant with all regulations currently in place regarding this matter (see Animal Health and Wellness section, in Chapter 2).
Effectiveness
Without compromising any of the above, the module needs to be able to effectively analyze and condition the behavior of the animal according to the desired rules for posture and localization, while also periodically communicating its current state and any collected data to the network.
These requirements led to the development of a Collar system with 4 main blocks: sensors, actuators, processing and communication (Figure 3.4).
Processing Communications
Sensors Actuators
3.4.1
Sensor and Actuator Technology
To implement the sensors and actuators, both requirements and state of the art infor-mation were considered. Appendix B contains the electrical schematics for some of these components and surrounding electronics, along with short descriptions for each of them. Chosen technologies for the implementation which were considered relevant in this work’s scope are described below.
Ultrasound Transducer
Neck distance to ground represents potentially important data for behavior and posture analysis, as illustrated in Figure 3.5.
Figure 3.5: Neck Distance To Ground
Technologies for measuring distance to obstacles are widespread, two of the most com-mon being ultrasound and infrared. Since this application is meant to operate in uncon-trolled lighting conditions (outdoor), infrared sensors were discarded, as ambient light can saturate these devices and interfere with the measurement process. Ultrasound technol-ogy does not present this limitation, and is not sensitive to obstacle properties like color and transparency. Experimental tests successfully confirmed that this type of technology can measure distance to dirt and grass up to about one meter, which fulfills the intended purpose for this sensor.
To measure distance using ultrasound technology, a short train of pulses at a resonance frequency (above 20 KHz, hence ”Ultrasound”) is applied to the transducer, which emits a sonic wave and then reacts when its echo arrives. The flight time is measured and the distance extrapolated using the speed of sound. This is illustrated in Figure 3.6.
Additional advantages of this technology include the reduced resources required to operate it. A Pulse Width Modulation (PWM) module, a timer, and an external inter-rupt pin on the micro-controller’s side, and an intermediate frequency transformer, a set of operational amplifiers and common electronic components to interface the ultrasound transducers with the micro-controller. Since it’s output can be interpreted digitally, there is no need for analog-to-digital conversion.
Ultrasound transducers are, however, directional in nature. This poses a problem when measuring distance to ground from the sheep’s neck, since the transducer can be pointed forward if the sheep raises its head too high, or backward while it grazes, depending on the Collar’s positioning. This results in an inevitable limitation in measurement angle range (Figure 3.7).
Figure 3.7: Ultrasound Measurement Range Limitation (Dashed Lines - Measured Dis-tance; Arrows - Transducer Orientation; Triangles - Ultrasound Directivity Limits)
An ultrasound module was implemented on the Collar, based on a K-14WP10 trans-ducer (Figure 3.8), together with a K4000002 matching transformer from Pro-Wave and all other required circuitry to implement echo detection. This allows the Collar to measure neck distance to ground. Regarding these components’ main characteristics [38] [39]:
K-14WP10 Ultrasound Transducer – 40 kHz Center Frequency – >100 mV Echo Sensitivity – <1.3 ms Decay Time K4000002 Matching Transformer – 40 kHz Operating Frequency – 5.3 mH Variable Inductance – 1:10 Turn Ratio
Figure 3.8: Ultrasound Transducer [22]
3-axis Accelerometer
To monitor the sheep’s head position and movement, a very simple and effective ap-proach is the use of a 3-axis accelerometer to measure the Earth’s gravity as well as the sheep’s sudden changes in posture. Accelerometers are commonly used on diverse appli-cations, from aeronautics to automobile industry, medical instrumentation, just to cite a few.
These devices are mostly based on spring-mass systems attached to a structure. When there is an applied force, like gravity, the mass is displaced from it’s original position, and this shift, due to the mechanics law of the spring, is proportional to the force applied, and therefore to the acceleration caused by that force.
Current technology allows the implementation of these devices inside integrated cir-cuits, presenting several advantages for integration with micro-controller based projects. These are called Micro Electro Mechanical Systems (MEMS). This type of implementation also allows the production of accelerometers paired with controllers capable of exchang-ing information via serial interface with other micro-controllers, and performexchang-ing ”smart functions”(e.g. free-fall detection, step counting).
An ADXL345 3-axis accelerometer from Analog Devices (Figure 3.9) was integrated in the Collar. Summarizing its properties [40]:
Low Current Consumption (0.1 µA in standby, as low as 23 µA while measuring) Up to 13 bit Resolution with 4 mg/LSB Scale Factor
Tap Detection with Interrupt Generation
Figure 3.9: 3-axis Accelerometer [22]
This MEMS communicates with the micro-controller through Serial Peripheral Inter-face (SPI). Appendix C explains this communication protocol in detail. This device allows the Collar to determine its own inclination from the Earth’s gravitational field.
Step-Up Transformer
Applicable electrical stimuli to the animals which preserve their health and well-being must be short duration and high voltage pulses. Any other form of electrical stimulus can severely hurt the animals, or otherwise produce unwanted results [30]. To generate this kind of signal, considering the power constraints derived from using micro-controllers and limited power supplies, step-up transformers are a very common choice.
This type of component is usually based on charge accumulation techniques. In a first phase, the component accumulates a defined amount of electrical charge. In the second phase, the energy is released to the output, originating a high-voltage pulse in a short time. The TW-DC-DP step-up transformer from Tianwang (Figure 3.10), along with all required circuitry, was used to implement the electrical stimuli functionality. Some of its properties are presented below [41]:
3.6 to 6 V Input Voltage 7 kV Output Voltage
Figure 3.10: Step-Up Transformer [42]
Microcontroller
Micro-controllers are composed of a microprocessor embedded in a chip along with multiple peripheral modules that are commonly useful, particularly to embedded projects. Their versatility, low cost and easy integration make them the core of many of these projects. This kind of device can be used to retrieve and process information from sur-rounding electronics, and serve as interface to a more powerful processor, like a computer. Many external modules can be added easily (e.g. a radio communications module) and the controllers themselves can be interconnected through diverse serial protocols, which are usually supported by the peripherals already integrated into the micro-controller.
From the project’s requirements, the chosen microcontroller was the CC1110 SoC from Texas Instruments. Its main properties are [3]:
Based on a 8051 Processor Integrated RF Module
32kB Programmable Memory
2 Independent Universal Synchronous/Asynchronous Receiver/Transmitter (USART) Modules with SPI/Inter-Integrated Circuit (I2C) Capabilities
4 Power Saving Modes
21 General Purpose Input/Output (GPIO) pins PWM Modules
16-bit Timer Three 8-bit Timers
These properties allow implementation of all required processing tasks and communi-cation with the SheepIT Network, while maintaining focus on low power consumption and simplicity.
3.4.2
Functionality
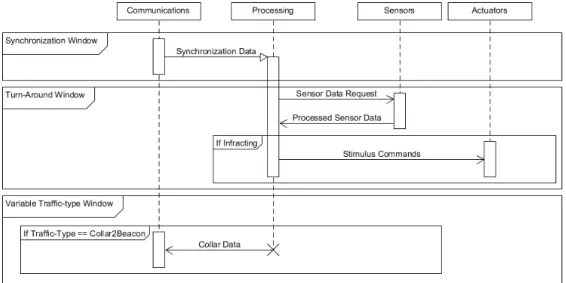
The sensor module periodically retrieves raw data from the sensors and processes it into usable information for the processing module. The latter then decides whether there is a need to interact with the animal, and sends commands to the actuator module, if necessary. This process happens at each TAW, once per uC. Also periodically, the processing module broadcasts the retrieved data to the network through the communication module. This transmission occurs during the VTW, if its Traffic Type is Collar To Beacon. The timing related to these network interactions is imposed by the higher-level nodes (e.g. Beacons and Gateway). This process is illustrated in Figure 3.11.
Since Collars are tasked with sensing and actuating according to the sheep’s behavior autonomously, a control architecture must be implemented on the devices. As mentioned earlier, two distinct groups of activities must be conditioned: posture and location.
The implemented algorithm for determining posture infractions (Figure 3.12a) relies on the accelerometer’s measurements to obtain an estimate of the sheep’s neck angle, and compares it to a stored threshold value. If the angle is higher than this value, the sheep is considered to be infracting. When this happens, the Collar issues a warning through the buzzer module. After three consecutive infractions, the Collar applies an electrostatic stimulus. As for localization infractions (Figure 3.12b), a similar method is used, in this case considering the RSSI measurements. If the highest of these is lower than a predefined threshold, the Collar assumes an infraction. In this case, the threshold was defined based on field measurements, and assumes no obstacles between Beacon and Collar, producing a conservative result. The corrective pattern is the same as in the posture case.
(a) Posture Control
(b) Location Control
3.5
Limitations
The described system already achieves some of the objectives imposed by the require-ments:
Collars collect sensor data and activate actuators correctly. The algorithm performs as expected during laboratory testing;
Beacons successfully synchronize the Collars, and both elements exchange packets as intended;
Data recovered from the sheep’s behavior is forwarded by the network towards a Gateway, where it is stored.
However, many features are missing or incomplete. Examples are:
Regarding the Network:
– Communications are mostly directed upwards, from Collars to Gateway. A downward communication channel could be useful for added control over the Network and its elements;
– Collars do not take advantage of the Network to improve their decision-making (e.g. they do not share information);
– From the posture control point of view, Beacons mainly act as relays for the gathered information.
Regarding the Collars:
– The algorithm used to determine posture infractions relies on a value defined from predictions based on footage of sheep activity, but without actual field data;
– The ultrasound module’s information is not applied when analyzing posture; – The algorithm does not account for terrain slope, and is therefore not expected
to function correctly on some of the intended scenarios;
– Sheep can vary in height and neck length. This is not taken into account by the algorithm, whose performance degrades if the animal is too different from the model;
– Sensor information is acquired synchronously with the network and is therefore subject to its timing constrains;
– Field testing showed that the electrical stimulation module , although applying significant amounts of energy, was not effective in conditioning the animals’ behavior, as sheep were not consistently sensitive to the applied stimuli.
These limitations led to the work developed in this dissertation, which mainly focuses on improving the Collar’s posture monitoring and control. The following chapters describe this contribution, analyzing the proposed improvements from the architecture and imple-mentation points of view. The remaining limitations were addressed by parallel works and are therefore off the scope of this document.
3.6
Discussion
In this chapter, a detailed description of the SheepIT project’s architecture and im-plementation was given. The Network structure was described from the communications protocol to node roles. Then, the lower-level Collar nodes were inspected in more de-tail, from the basic technologies involved to the functionalities implemented. Finally, the project’s limitations were analyzed and listed.
This dissertation’s final objective is to produce a fully functional Collar as defined by the project’s requirements, with exception of the localization algorithm to be developed in a parallel work. The above listed limitations, along with previous field test results and already developed work, led to the following list of objectives:
Improve the sensor hardware and firmware so there is an increase in retrieved data quantity and quality;
Re-implement or replace the electrostatic discharge module by a more effective and controllable version;
Design and implement a downward communications channel from Gateway to Collar, enabling a centralized control and configuration of its functionalities;
Develop an alternative version of the Collar’s state-machine, which can achieve higher measurement and actuation rates;
Take advantage of the previously unused ultrasound module and, if necessary, inte-grate other technologies, with as little changes to the Collar’s electronics as possible, to implement an advanced version of the Posture Control Algorithm, which can over-come the previous version’s limitations, particularly animal stature and terrain slope issues.
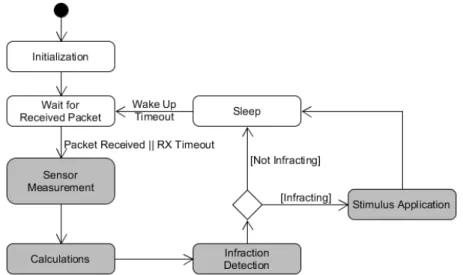
Considering these guidelines, a version of the Posture Control Activity Diagram (Figure 3.12a) was produced, which highlights the modified blocks in gray (Figure 3.13).
Figure 3.13: Modified Collar Posture Control Activity Diagram
No significant changes were made to the project’s architecture, since this work focuses primarily on adding or extending functionalities. Therefore, the following chapters present the solutions implemented to achieve these objectives.
Chapter 4
Hardware and Firmware
Enhancements
The first objective listed in Chapter 3 was to enhance sensor hardware and firmware to provide the posture control algorithm with more useful data. The second objective was to improve the electrostatic discharge module’s functionality. The solutions implemented to achieve both these objectives are described throughout this chapter, which first presents the hardware modifications, and then the firmware to interface with it.
4.1
Added and Modified Hardware
Improving the posture control system required the addition and modification of sensor hardware (to increase data variety and improve its quality) and actuator hardware (to increase effectiveness and versatility).
4.1.1
Static Acceleration and Magnetic Field
Heading recognition can be a useful complement as activity data for a behavior mon-itoring algorithm. The most common solution is the use of magnetometers or compasses. These measure the intensity of magnetic field traversing them, and, when in low electro-magnetically polluted environments, can be used to determine the orientation of Earth’s magnetic field. The usual physical phenomenon used to build these devices is Hall’s Effect on semiconductors.
Current applications use 3-axial versions of this device combined with accelerometers to compensate tilts and allow heading computation independently from the system’s angular position.
This type of application is so common that most magnetometers are integrated into MEMS alongside accelerometers and sold as a single component.
Thus, heading information was deemed an important feature, and since a MEMS 3-axis accelerometer was already implemented, the decision was taken to replace it with an
accelerometer/magnetometer combination, while retaining as much of the previous hard-ware’s circuitry and firmware as possible.
The chosen device was a LSM303C MEMS from ST-Microelectronics. The properties that led to its choice are summarized below [43]:
3-axis Accelerometer, with range of up to 8 g and 16-bit precision 3-axis Magnetometer, with range of 16 gauss and 14-bit precision SPI or I2C communication available
Low-power and power-down modes
Maximum current consumption of less than 0.5 mA for highest performance modes, and down to 6µA for power-down mode
Programmable interrupt generators for events (motion detection, free-fall, magnetic field sensing)
Embedded programmable First In, First Out (FIFO) for each accelerometer channel, with up to 32 positions
Configurable high-pass filters for the accelerometer module These properties allow for the addition of features such as:
Heading calculation, which is potentially useful for both localization and posture monitoring;
Retrieving and storing of acceleration samples while the micro-controller sleeps, al-lowing for greater sampling frequencies with little increase in power consumption; Dynamic acceleration measurement without the need for software defined filtering; Detection of step events, which allied to very few additional hardware components
can be used to produce a step counter.
This choice didn’t require significant changes to the previous hardware design, since the serial communication protocol was maintained. Two additional pins (Slave-Select and External Interrupt) were required to establish communications with the magnetometer. All other SPI related connections remained unchanged.
4.1.2
Dynamic Acceleration
The sheep’s current amount of activity can be correlated to dynamic acceleration mea-surements (see Animal Monitoring Solutions section, in Chapter 2). This can be very useful, for direct activity recognition or statistical studies regarding the animals’ health. Methods to obtain these measurements involve either differentiating samples digitally or using high-pass filters already embedded in the accelerometer. The LSM303C MEMS integrates the latter, so these measurements were directly available.
Examples of activity classification mentioned in Chapter 2 use high sampling frequen-cies. Therefore, to maximize the amount of samples taken and enable classification of the sheep’s behavior over time, the available FIFO was enabled to save measured values of dynamic acceleration on each axis, while the Collar is asleep. Considering the FIFO’s size (32 positions) and a 3 second uC time window example, this allows a maximum possible sampling frequency of around 10 Hz.
4.1.3
Electrostatic Discharge Module
An alternative to the previous approach to the electrical stimuli generator is to use a regular transformer with a very high inductance value on its secondary winding, which can be obtained using a large amount of turns and small wire diameter (Figure 4.1).
Figure 4.1: High Inductance Transformer on PCB
If commutated from the primary winding using a fast-switching transistor, it can gen-erate very high voltage, short duration pulses at the output. Figure 4.2 presents the design in a block diagram.
This approach allows greater control of stimulus intensity and duration, while using simpler components. It also introduces an inherent fail-safe mechanism: in the case of a system lock, if the driving transistor was pulled up, a step-up configuration would charge and discharge indefinitely, and potentially deliver excessive stimuli to the animal. Con-trarily, regular transformers do not transmit DC signals, and a similar system lock would produce no effects on the outputs, ensuring the sheep’s safety.
Some care must be taken to shield the remaining electronics from electromagnetic interference caused by this circuit (e.g. high voltage and current spikes are present at the primary winding’s terminals during operation). Options include encapsulating and, on the Printed Circuit Board (PCB), drawing ground connected pads around it. A capacitor included in the circuit enables control over the amount of electrical charge transmitted per pulse, which was previously defined as a requirement for safety.
Thus, a new version for the electrostatic discharge module was developed based on a custom-made high inductance transformer. The resulting circuit can be analyzed in Appendix B.
This choice also didn’t require changes to the connections between circuit and micro-controller (since the module is still controlled via PWM).
4.2
Low-Level Firmware
All of the modified and added hardware required the development of dedicated firmware in order to extract useful information from its raw measurements or correctly apply its functionalities. This development is described throughout this section. It is divided into five subsections:
Device Drivers
Automatic Sensor Calibration Digital Filtering
Calculations and Transformations Stimuli Combination and Configuration
4.2.1
Device Drivers
For every new or modified module, new device drivers were designed and implemented.
Accelerometer and Magnetometer
The new MEMS integrates two different modules (accelerometer and magnetometer) which communicate independently, through the same channel. SPI allows this by the use of Slave Select pins. For each module, single and multi-byte, read and write functions were designed according to the SPI communication schemes described in Appendix C. These functions allowed the development of configuration routines for each module, as listed in Table 4.1.
Routine Name Inputs Description accelConfig Device mode Enables Device
accelConfig BDU mode Enables Block Data Update accelConfig Axes mode Enables Axes
accelConfig Range mode Configures Measurement Range accelConfig ODR odr Configures Output Data Rate accelConfig AddInc mode Enables Auto Write Address Increment
accelConfig FIFO mode Enables FIFO accelConfig FIFOMode mode Configures FIFO Mode
accelConfig FTH fth Configures FIFO Stop Threshold accelConfig StopFTH mode Enables FIFO Stop Threshold
accelConfig HPF mode Enables High Pass Filters accelConfig HPFMode hpf Configures High Pass Filters
magConfig BDU mode Enables Block Data Update magConfig AxesPerf xy mode, z mode Configures Axes Performance
magConfig ODR odr Configures Output Data Rate magConfig Range mode Configures Measurement Range
magConfig SIM mode Configures Serial Interface Mode
Table 4.1: Configuration Routine List
Finally, these routines were used to perform the required initial (for permanent pa-rameters) and cyclic configurations (for changing parameters such as high-pass filters en-abling/disabling):
Initial Configuration: – Accelerometer:
* Device Enabled
![Figure 2.4: Griffon Vultures Accelerometric Patterns [14]](https://thumb-eu.123doks.com/thumbv2/123dok_br/15740427.1072493/32.892.240.663.164.558/figure-griffon-vultures-accelerometric-patterns.webp)
![Figure 2.6: ML’s Resulting Decision Tree [14]](https://thumb-eu.123doks.com/thumbv2/123dok_br/15740427.1072493/33.892.213.695.722.1051/figure-ml-s-resulting-decision-tree.webp)
![Figure 3.1: General Architecture Illustration [34]](https://thumb-eu.123doks.com/thumbv2/123dok_br/15740427.1072493/40.892.142.767.489.706/figure-general-architecture-illustration.webp)