MS
CIN BUSINESS ADMINISTRATION
THE “ONLINE MANAGER”
A VALUE ANALYSIS
NUNO ALBARRAN
ADVISORS:
PROF.DOUTOR PAULO CARDOSO DO AMARAL
Dissertation submitted in partial fulfillment of the requirements for the degree of MSc in Business Administration at Universidade Católica Portuguesa.
2 | P a g e
Preface
I would like to thank everyone who helped make this dissertation possible. To Company Virtual Managers, they made my study case possible. To the marketing department, for all the data they made available.
To my Director and tutor, for their support and advices, they have provided the bases for this paper.
From the UCP, I would like to say thanks to my dissertation advisor for the help he gave. Because of him I could find my way. His effort and skillfulness were most welcome.
To my Mother and Father, I need to thank them for everything they were able to provide in my live, both personally and academically. Lastly to Joana… If it wasn’t for her my dissertation would not be finished.
3 | P a g e
Table of Contents
Preface... 2 Abstract……….………... 5 1 - Introduction……….…………..………...……….……….…. 6 2 - Literature Review………... 9 2.1 - Service Definition……….………….………...………...10 2.1.1 - Service Characteristics………..……….. 10 2.1.2 - Service Concept….……….……….. 11 2.2 - Knowledge Creation………..……….………. 142.3 - The CRM: Purpose and objective…………..……..………. 16
2.3.1 - Front Office: The internet……….……….………... 17
2.3.2 - Back Office: The Feedback Loop……….………….. 23
2.4 - Service Quality……….... 26
2.4.1 - The Service Quality dimensions………. 27
2.5 – Firm’s Creation of Value ……….………. 32
3 - Case Study: The Online Manager………...………..…….……… 37
3.1 - Purpose and main features……….……… 37
3.2 - The Front Office………... 38
3.2.1 - The Branch……….………. 39
3.2.2 - Call Center Channel………. 39
3.2.3 - Online Channel……….……..… 39
3.2.4 - Operational CRM……….….. 42
3.3 - The Back Office………... 44
4 – Measuring the value creation of the online manager for customers……… 46
4.1 - Applied Methodology……….……….………... 46
4.1.1 – Summary .………..………..……….. 51
4 | P a g e
4.2.1 - Summary…...………. 54
4.3 - Service Quality analysis……….…...………….. 55
4.3.1 - Physical Quality analysis………... 55
4.3.2 - Virtual Quality analysis………... 56
4.3.3 - Integration quality analysis……….…………. 57
4.3.4 - Summary………... 57
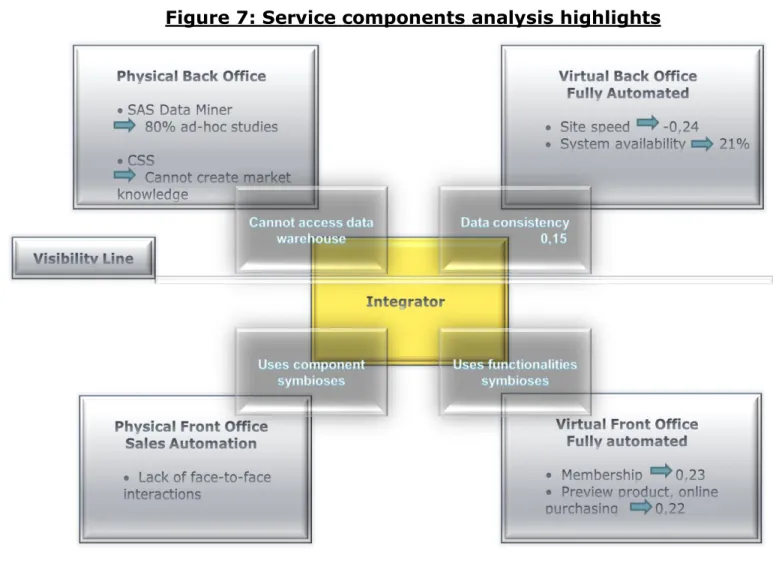
4.4 - Company View: Service components analysis, value measurements and discussion……… 58
4.4.1 - Front Office……….……… 58
4.4.2 - Back Office……….……….………… 59
4.4.3 - Integration component…….……….……….……….… 59
4.4.4 - The “Online Manager” efficiency….……….……….………….. 61
4.4.5 - Value Creation……...……….………..……… 62 4.4.6 - Summary…..……….……….……….………. 63 4.5 - Conclusion……….………..……….……….. 63 5 - Conclusion………..……….……….………. 66 6 – Future Research……….… 71 7 - References …….……….………..………… 72 8 - Appendix………..……….……… 76
Collaborative Web functionalities………..………. 76
Table 1 – Service quality Literature Review………..………..……… 81
Table 2 – Sousa and Voss Service Quality dimensions………. 85
Table 3 – Manager Processes……….……… 86
5 | P a g e
Abstract
This study assesses if the Online Manager, a new technology implemented by the company Virtual Managers with the aid of CRM Systems, did create value for the firm. We propose a service deliver model based upon five service components: Virtual front office and back office, physical front office and back office and an integrator
component. Furthermore, we discuss how the components should be designed in order to deliver value to the customer and profit to the company, then, a comparison is done between two periods (2007 and 2008) of time to determine the differences occurred at the level of service delivery in Virtual Manager. A linkage between our service delivery schematic and service quality is made in a value creation point of view, through the use value and exchange value dimensions. We conclude that in Virtual Managers, knowledge creation still has a long way to go.
6 | P a g e
1 - Introduction
The internet is almost an inevitability in our everyday lives [M. Castells et al 2003], and the time-to-market of new technologies decreases in front of our own eyes [Smith and Reinertsen et al 1992], companies and entrepreneurs are focused in new ways of increasing their sales and profits [Heskett at al 2008].
Consequently, Company Virtual Managers (we will address the company this way due to confidentiality reasons) with the support of CRM systems came up with the idea of creating an “on-line manager” in their internet banking channel, in order to explore the relational factor with their costumers online. The on-line manager went “active” in March 2008, after 6 months of testing a small group of customers.
The purpose of this work is the following:
Determine and analyze whether or not this new technology improved the Virtual Managers online channel value.
This work is relevant because if companies could finally understand how to do a proper analysis to their CRM technology, there wouldn’t be so many problems
concerning their implementation. Problems may occur from every part of the service components [Gebert et al 2003];[Sousa and Voss et al 2006], “CRM promises
revenues and profits, and customer service companies face potential failure, because of all the complex technical and organizational issues involved” [Goodhue et al 2002]. Indeed, new technologies are always hand in hand with uncertainty of success,
making doubt always present before and after their implementation [McGrath and MacMillan et al 2000]. Therefore the project was analyzed by the company before it was implemented and now, almost 2 years after the go-ahead, the urge for a new
7 | P a g e
analysis emerges in order to evaluate if the online manager did or did not create value, and in either case to identify possible processes improvements.
This kind of analysis to a project is referred in [Kotler et al 2008] and in [Pan and Lee et al 2003], and for that reason, a comparison is done between two periods of time to determine the differences occurred at the level of service delivery. The two periods are 1st semester of 2007 (the online manager was only made available in the second
semester at July27), and 2º Semester of 2008, a year after its rollout.
To evaluate if this new technology had in fact an impact on value creation, and what kind of an impact it was, a conceptual framework supported by previous studies is constructed, being fundamental for its construction the paper of [Sousa and Voss et al 2006]. Because the online manager is a new service offered by the company, this framework will be conceived with the purpose of accessing what components of the service delivery did (or not) the online manager create value.
As said before problems can occur from every part of the service components, therefore we first start our approach by discovering what service is and the
components it possesses at section 1. Then, in section 3, our attentions turn to the CRM systems and study how they are supposed to be implemented in order to
improve the online channel value and bring profit to the company. We also approach the customer view, in section 4, since it is the customer who evaluates service
delivery and bring profit to the firm by purchasing what the company is offering in a process called payment equity: ”Customer’s perceived fairness of the price paid for the firm’s products or services”[Verhoef et al 2003]. Therefore we also perform a literature review on service quality literature, because this topic is vital to understand how customers perceive the value of the service delivered to them [Cronin et al
8 | P a g e
Lastly we address to value creation in section 5, in order to understand value creation sources, what dimensions value has and finally how to measure it.
In our case study chapter, we learn how the online manager operates and discover the CRM systems and applications it uses to allow its functioning. Afterwards, we place this systems and applications in our service components, then, it is performed an analysis to study their impact on our service quality dimensions.
To conduct this study, we will use four samples of Virtual Managers customers, requested to their marketing department. Two of these samples concern to the first period of analysis (1st semester of 2007), we then perform a cross-check with other two samples of the second period of analysis (2nd semester of 2008). The
measurements, results and discussion are displayed in chapter 4.
9 | P a g e
2 - Literature Review
In this chapter we first study service characteristics, used as foundations to service definition and to the remaining chapters of our work. Then we advance to the service concept, where we address its dimensions and the three types of service processes that Marketing is responsible to design in a profitable way. We use these dimensions to discover our five service components.
In section 2, and because marketing is responsible to design service processes with market knowledge [Hoffman et al 1996], knowledge creation literature is reviewed to assess how can it be obtained. [Porter et al 2001] stressed that to gain market
knowledge a company needs to “join forces” with an information system to integrate its information flows.
For this reason CRM systems are studied in section 3, since they are information integrators by definition [Feinberg and Kadam et al 2002]. These systems are therefore discussed concerning their operational capabilities and placed in the matching service component.
In section 4 a service quality model is constructed, since it is the customer who evaluates service delivery and brings profit to the firm by purchasing what the company delivers. This model is constructed to appraise the problems that might occur in service components.
Value creation is the section 5 topic. Vital to determinate if the Online Manager
technology improved the Virtual Managers online channel value. We study its sources, dimensions and finally how to measure it.
10 | P a g e
2.1 - Service Definition
Because the Online Manager is a service delivered by means of CRM technology, problems may arise from its every component. Therefore, we need to perform a service literary review so that these components become discovered and a proper service designing convention is assembled to avoid these problems.
It is performed a reading on service unique characteristics, for the reason that they need to be addressed differently than products [Parasuraman et al 1985].
Furthermore, service concept is approached to discover and seize service dimensions. They are the starting point for our five service components.
2.1.1 - Service Characteristics
In order to understand what a service is, first we need to address to their unique characteristics. They were pointed out by Parasuraman in order to differentiate services from goods [Parasuraman et al 1985]. They are:
1. Intangibility: Cannot be touched.
2. Heterogeneity: Variability on delivery.
3. Inseparability of production and consumption: Produced and consumed simultaneously.
4. Perishability: Cannot be stored.
The question with services is heterogeneity and intangibility [Zeithaml et al 1981; Parasuraman et al 1985]. While heterogeneity would bring service standardization and quality control difficult to achieve, intangibility would set difficulties to the firm, in the comprehension on how consumers perceive and evaluate service quality
11 | P a g e
This set of characteristics exists due to the lack of a physical product (goods), leading to a fifth characteristic: services are built on processes [Gonroos et al 2000], a
“combination of activities needed and sufficient for the firm functioning” [Victor Martins et al 2006].
However, these definitions and characteristics were made thinking on services delivered on physical and offline environment. Therefore, with the internet
appearance, today’s products and services are radically shifted to digital form and delivered through this channel [Sukasame et al 2005].
Scholars [Hofaker et al 2007] [Rust and Kannan et al 2003] found it necessary to make changes to meet today’s e-service reality. Some defend that e-service can be created and stored as an electronic code comprised of binary numbers, and define it as ”an act or a performance that creates value and provides benefits for customers through a process that is stored as an algorithm and typically implemented by network software” [Hofaker et al 2007] while others have a simpler definition: “provision of service over electronic networks” [Rust and Kannan et al 2003].
The previous problems concerning Heterogeneity disappear with e-services because “does not incur as much risk of human error” [Hofaker et al 2007]. However,
intangibility remains a problem and will be addressed upfront in the service quality chapter.
2.1.2 - Service Concept
To define service or e-service, it is also necessary to conceptualize service in order to grasp and visualize its dimensions. [Heskett et al 1986; Goldstein et al 2002] said that service concept was “the way in which the organization would like to have its services perceived by its customers, employees, shareholders and lenders”. However, [Collier et al 1994; Goldstein et al 2002] called it the “customer benefit package”.
12 | P a g e
Source: Goldstein, Johnston, Duffy and Raod et al 2002
A service has two dimensions [Goldstein et al 2002] divided into a functional (“What” is delivered in terms of service outcome) and a technical dimension (“How” is it
delivered) [Grönroos et al 2000; Bauer et al 2006], on the other hand, service
concept not only defines the “How” and the “What”, but also ensures their integration [Goldstein et al 2002].
The sentences mentioned above refer to the existence of a third integration
dimension, but do not acknowledge it as a separate dimension. Due to its importance and role in the provision of the service itself, the need to a third service dimension is in order [Sousa and Voss et al 2006].
These three dimensions are guided by a strategic intent, which has its source on Marketing [Goldstein et al 2002], defined by “the attempt to uncover and satisfy customer’s needs at a profit, by the organization wide generation of market
intelligence” [Hoffman et al 1996]. Therefore, with market knowledge this company division has the responsibility to create processes that:
Define what is delivered to the customer. Define how to deliver the “What”.
13 | P a g e
The purpose of these processes designing is to uncover and satisfy customer needs in order to achieve profit. To realize this goal and get high level of performance, service processes need to be customer oriented. [Möller et al 2006].
Nevertheless, we must differentiate Virtual components and Physical components in service delivery, since services are radically shifted to digital form and delivered
through the internet. Sousa and Voss also felt that necessity due to the appearance of virtual channels and defined two service components [Sousa and Voss et al 2006]:
Virtual service: Pure information component of a customer’s service
experience provided in an automated fashion (without human intervention). Physical service: Portion of a customer’s service experience provided in a
non-automatic fashion, requiring some degree of human intervention.
The functional part of the service, the “What”, is tightly linked to the back office, since what is delivered to the customer is deliberated in the back office [Gurgul et al 2002], giving form to the “benefit pack”. Meanwhile, the technical dimension, the “How”, is linked to the front office by means of the channel chosen for distribution (way the service is delivered to the customer [Neslin et al 2006]).
This proves that there are issues, both in the front office and back office that influence service delivery. Nonetheless, where does one ends and the other starts? Teboul defends that there is a “line of visibility”, activities or services that are invisible to the customer are behind the line [Teboul et al 2006; Lovelock et al 2004; Glusko et al 2008], making them Back office. By deduction, any activities or services (made by the firm) with a client that are visible to him (even if by means of an interface) is made in front of the line of visibility, defining this way, Front Office.
14 | P a g e
Having conceptualized service in a more operational way, it is now possible to define service and/or e-service as an act or a performance guided by a strategic intent that uncovers needs and creates value for customers, defined by a back office and
delivered by a front office. We also propose a company service schematics (Figure 2). Figure 2 – Service schematics
2.2 - Knowledge creation
Consistent with the marketing concept, Market Knowledge is the key to design service processes and ultimately deliver value to the customer.
The Knowledge importance has been claimed throughout time. The well known statements by Socrates “The only good is Knowledge and the only evil is ignorance” [source: goodreads.com] or by Francis Bacon “knowledge is power” back in 1597
Physical Back
Office Virtual Back Office
Physical Front Office Virtual Front Office
Integration Factor Visibility Line What How S trateg ic In ten t
15 | P a g e
[Kotler et al 2008] are some good examples. However, the main question is how to create Market Knowledge?
By learning with and understanding the client, because the client is armed with market knowledge by drawing it from the market itself, due to today’s increasingly transparent business environments which allow customers to evaluate each company offering services [Pralahad et al 2004]. Although, a company cannot collect all
information from all customers[Davenport et al 2001; Gerbert et al 2004 ] due to the high costs associated to the data “chaos” it would cause in the Data Warehouse
(D.W.) [Nelson et al 2001]. Instead, an enterprise should focus on data harvesting from profitable customers and customize an appropriate service for each one. [Chalmeta et al 2005]
According to Riempp, Knowledge is generally implicit, highly volatile and context sensitive. In order to manage it, it is fundamental to understand that knowledge is not information. When knowledge arrives at the company, it is selected and massively reduced to knowledge representations (information) [Riempp et al 2003; Gerbert et al 2003]. Afterwards, given sufficient context, that information can be reconstructed back into knowledge without needing access to the originator [Gerbert et al 2003]. Porter states that in the Internet environment, every activity involves the creation, processing and communication of information. In order to consent this knowledge flow and to gain sustainable competitive advantage, it is critical for a company to join efforts with information technology to integrate its service processes, the ultimate goal of this partnership is knowledge creation [Porter et al 2001]. CRM technology is the answer to this integration/Knowledge riddle because it is “a comprehensive business and Marketing strategy that integrates technology, processes and all business activities around the customer” [Feinberg and Kadam et al 2002] with knowledge creation skills [Buerer et al 2005].
16 | P a g e
Next, we will overview CRM systems, their active role in the service schematics in order to sustain knowledge flow and how they support marketing operations on the creation of the three types of processes requirements, so that customers needs become uncovered and value delivered to them.
2.3 - CRM: Purpose and Objective
This support technology is a powerful mean for a company to achieve the strategic intent, since CRM is a strategic approach concerned with creating relationships with key customers and customer segments [Payne et al 2005].
Indeed, the CRM refers to marketing processes with the aim of creating customers relationships [Lee-Kelley et al 2003], “nurturing” them in order to encourage
customer loyalty and increase customer retention [Pan and Lee et al 2003]. Studies often report that, on average, it costs a company more to attract new customers as it does to implement a retention strategy. In fact, by increasing 5% the customer
retention rate, profits rise from 25% to 95% [Reichheld et al 2000]. However, how is the relationship nurtured?
CRM provides enhanced opportunities to “use data and information of customer segments to both understand and co-create value with them” [Payne et al 2005]. In order to accomplish its goal, the CRM has three levels of systems implemented in the company [Torggler et al 2008]; [Brenner et al 2003; 2004]; [Ross et al 2005].
17 | P a g e Front-Office 1. Collaborative CRM 2. Operational CRM 2.1. Sales automation 2.2. Services automation Back-office 2.3. Marketing Automation 3. Analytical CRM
In order to be successful, the CRM systems need to be aligned with the enterprise Back Office and Front Office, given that the key reason for CRM implementation
failure is the inability to create an enterprise wide CRM strategy [O.Chan et al 2005].
2.3.1 - Front Office: The internet
As discussed previously in the service concept chapter, the Front Office is where customers have contact with processes that are visible to them. One of the CRM systems implemented in the Front-Office is the Collaborative CRM. From its definition we learn that it integrates all channel operations in terms of channel information flow: “The collaborative CRM covers the control and integration of all communication
channels between the company and its customers. Via “Customer touch points” in different communication channels” [Torggler et al 2008].
18 | P a g e
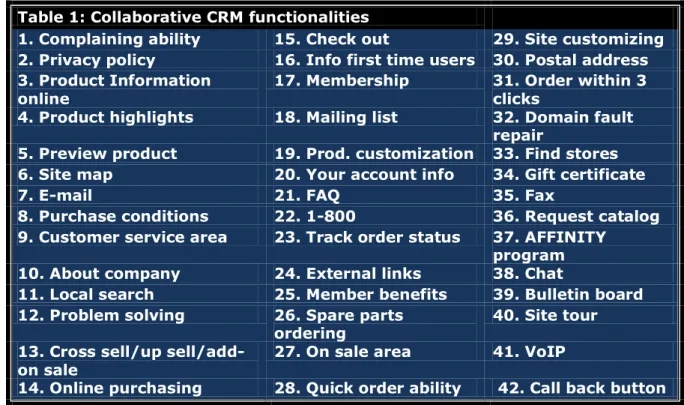
In a company’s Website, customers can interact with application functionalities. Each one of them performs with a different goal, from assuring a user-friendly navigation to online purchasing capability. It is the CRM Collaborative system who is responsible to manage the integration of 42 Web functionalities [Feinberg and Kadam et al 2002]. Thanks to this application synchronization, functionalities and service components “symbioses” emerge. In both cases, they represent the way in which functionalities and components can help each other mutually to perform a better service. The list of functionalities is presented at table 1 (the explanation of each one can be found at the appendix – Collaborative Web functionalities).
a) Functionalities “symbioses”. When delivering service by means of a physical channel, customers often purchase their products without providing any kind of
information about themselves [Neslin et al 2006]. As consequence of this, a Forrester survey found that 48% of 50 retailers learn nothing about their shoppers [Yates et al 2001; Neslin et al 2006].
In a virtual channel such as the internet, a company can induce customers to input personal information by centralizing the registration process [Hoffman et al 1996] and use the membership functionality (see table 1/ nº17). This feature not only allows the company access to customer’s personal information, but also tracks down his
“footsteps” inside the member’s area [Feinberg and Kadam et al 2002].
Since these online applications are directly integrated to the D.W. [Torggler et al 2008], imagine the range of data input combinations that exist from 41 web functionalities if they are positioned inside the member’s area.
19 | P a g e
Source: [Feinberg and Kadam et al 2002]
b) Service components “symbioses”. Multichannel integration has a major importance on marketing channel strategy because of its lasting effects on channel power, customer value and on market opportunities [Andreini et al 2008]. In fact, multichannel customers are more loyal and are two to four times more profitable when compared to single channel [Double Click Inc et al 2004; OC&C et al 2002; Müller-Lankanau et al 2005].
The internet channel is the most discussed marketing channel for complementing offline purchase experience [Andreini et al 2008], since it offers a high customers reach [Hoffman et al 1996] allied to considerable cost reductions [Rust and Kannan et al 2003]. Nonetheless, Reicheld argues enterprises seem to overlook the lack of
Physical service presence in their websites on the cost of eventual consumer
confidence in the service provider. This fact places the seller-customer relationship at risk [Stenger et al 2008], since trust is vital to induce customer loyalty [Reicheld et al 2000]. It is in fact the absence of a customer-seller dialog that undermines consumer trust. With it, not only a relationship can emerge but also superior customer insight can be unveiled [Grönroos et al 2000].
Table 1: Collaborative CRM functionalities
1. Complaining ability 15. Check out 29. Site customizing 2. Privacy policy 16. Info first time users 30. Postal address 3. Product Information
online 17. Membership 31. Order within 3 clicks
4. Product highlights 18. Mailing list 32. Domain fault repair
5. Preview product 19. Prod. customization 33. Find stores 6. Site map 20. Your account info 34. Gift certificate
7. E-mail 21. FAQ 35. Fax
8. Purchase conditions 22. 1-800 36. Request catalog
9. Customer service area 23. Track order status 37. AFFINITY program
10. About company 24. External links 38. Chat
11. Local search 25. Member benefits 39. Bulletin board 12. Problem solving 26. Spare parts
ordering 40. Site tour
13. Cross sell/up sell/add-on sale
27. On sale area 41. VoIP
20 | P a g e
By integrating Physical and Virtual channels, we are making way to integrate Physical and Virtual service components [Sousa and Voss et al 2006]. This multichannel
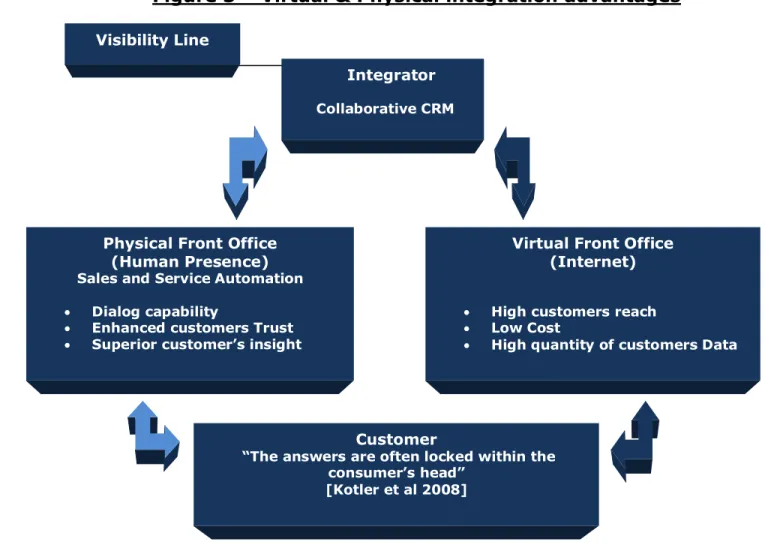
setting in an internet environment is vital not only from merging the best of both worlds when it comes to create customer knowledge and build customer relationships (Figure 3), but also to provide the customer with the power of choice, increasing his satisfaction considerably [Bitner et al 2000; 2002; Sousa and Voss et al 2006]. In light of these facts, the ability of the Collaborative CRM to induce complementary channels in an enterprise Website becomes a precious asset: E-mail, fax, toll-free numbers, postal address, chat, call back button, voice over IP and bulletin board, provide companies and customers a vast number of alternative ways to reach company personnel [Feinberg and Kadam et al 2002].
Figure 3 – Virtual & Physical integration advantages
Physical Front Office (Human Presence) Sales and Service Automation Dialog capability
Enhanced customers Trust Superior customer’s insight
Virtual Front Office (Internet) High customers reach Low Cost
High quantity of customers Data Visibility Line
Customer
“The answers are often locked within the consumer’s head”
[Kotler et al 2008] Integrator Collaborative CRM
21 | P a g e
This Data information retrieval is fundamental for the company to create market knowledge and uncover customers’ needs. Nonetheless, this information is also vital for future customer interactions since a customer is always eager for it, either from company services/products or past interactions [Gurgul et al 2002]. If an exchange of information fails to exist, the creation of a relationship with the customer becomes an impossible challenge [Reinecke et al 2002; Torggler et al 2008].
Processes are services and if services heterogeneity characteristic is no more in an e-environment, since it “does not incur as much risk of human error”, by introducing Physical service in the internet environment, variability on delivery is once again a problem.
For that reason, Operational CRM deals with the design, planning and implementing activities by automating all processes associated with customer relations [Gebert et al 2003]. According to [Ross et al 2005], [Gebert et al 2003], and [Torggler et al 2008], Marketing, Sales and Service are the three departments that use CRM systems and are responsible to cooperate with the client and/or retrieve information data.
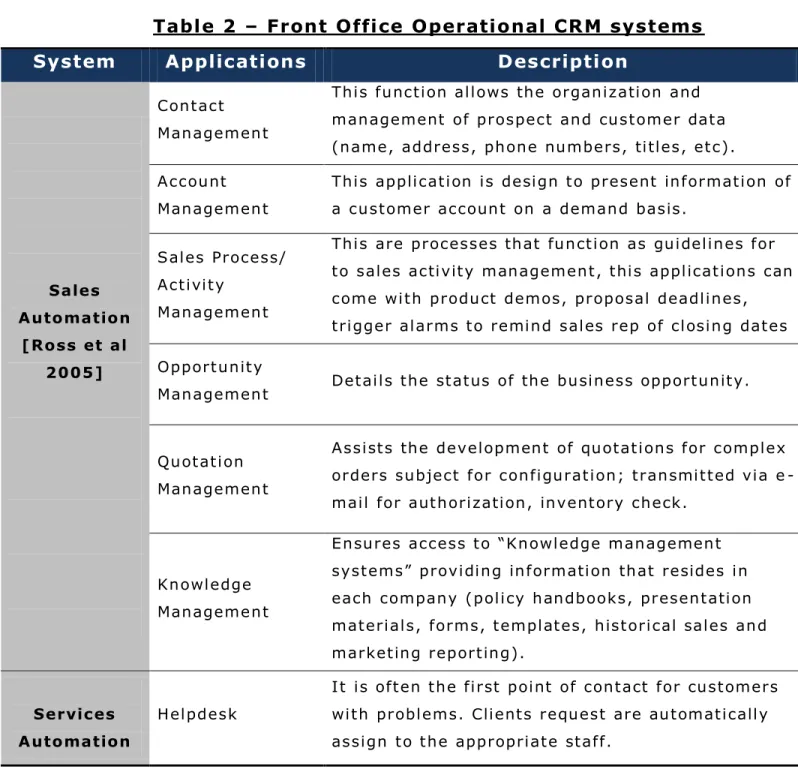
However, these instruments are also very useful for the mentioned company units; the description of each Operational CRM application is showed in table 2.
The authors stated above mention that Marketing is present in the Front-Office and is responsible for the campaign preparation, launching and monitoring. Still, an actual interaction with the customer over the internet, one that is visible to him, is only made by the Sales and Services department. For that same reason, we consider and place the Marketing department and Marketing automation in the Back-Office.
Therefore, the Marketing division table can be found in the next section.
Sales department & Service department: They have the responsibility to deliver the Physical Service as it is demonstrated in figure 3. The Sales department receives marketing information regarding what clients to target in each campaign and perform
22 | P a g e
the approach according to the designed processes. However, the service department has a post-service management role. It is important to mention that companies’ salesman need proper instruction, concerning customer handling and data retrieval skills requirements. Therefore, companies should hire competent employees [Gurgul et al 2002.
Table 2 – Front Office Operational CRM systems
System Applications Description
Sales Automation [Ross et al 2005] Contact Management
This function allows the organization and management of prospect and customer data (name, address, phone numbers, titles, etc). Account
Management
This application is design to present information of a customer account on a demand basis.
Sales Process/ Activity
Management
This are processes that function as guidelines for to sales activity management, this applications can come with product demos, proposal deadlines, trigger alarms to remind sales rep of closing dates Opportunity
Management Details the status of the business opportunity.
Quotation Management
Assists the development of quotations for complex orders subject for configuration; transmitted via e -mail for authorization, inventory check.
Knowledge Management
Ensures access to “Knowledge management systems” providing information that resides in each company (policy handbooks, presentation materials, forms, templates, historical sales and marketing reporting).
Services Automation
Helpdesk
It is often the first point of contact for customers with problems. Clients request are automatically assign to the appropriate staff.
23 | P a g e
[Torggler et
al 2 0 0 8 ] Complain
Management
Generates customer feedbacks. Typifies the complaints and performs an automatic management of customers requests.
2.3.2 - Back Office: The Feed Back Loop
The Analytical CRM component lies in the back office and is connected to the Data Warehouse, where the customer data originated from the front office is [Gurgul et al 2002]. However, the major critical factor that may lead to problems towards
knowledge, are companies that already exist upon the system implementation. They face difficulties with existing non-optimal conditions in terms of data storage and data access [Arndt et al 2002]. For example, “valuable information got buried in silos and not leveraged in analytical processes around the company.” [O.Chan et al 2005]. Nonetheless, if the Analytical CRM accesses this data, it will be able to analyze
customer data, discover customer processes/behaviors and create Market Knowledge through them [Arndt et al 2002].
With Market Knowledge, Marketing can now create the three types of customer oriented processes in a more effective way, bearing in mind some pointers that will assist them in service delivering via the internet channel:
Processes type Key aspects
Integrate “What” and the “How”
Promote the Feedback Loop (figure 4)
How to deliver the “What”
Use the functionality symbioses and service components
symbioses
Define “What” to deliver Deliver a Customized Service to
24 | P a g e
It can launch a more effective campaign, targeting the most profitable customers with a customized service. With the help of the campaign management Marketing can also control, analyze and see the campaign results, making afterwards, any adjustments necessary for the next campaign [Pan and Lee et al 2003].
We mentioned in the Knowledge creation section, that Knowledge is reduced to data information when it arrives at the company, being reconstructed afterwards without accessing its originator. This process is done through a feedback loop between all service components, represented in Figure 4.
Marketing Automation [Gebert et al 2004]
Campaign Management
Responsible for “planning, realization, control, and monitoring of marketing activities aimed at known recipients” (channels and clients) . The selection of “clients to target” is cooperation between marketing and analytical CRM.
25 | P a g e Physical Back Office
Virtual Back Office
F igu r e 4 – Th e F e edb a ck L o op
As we can see in Figure 4, the Front Office and Back Office nourish each other in a Feedback Loop. The Analytic CRM component creates customer Knowledge for the Marketing department, and this one improves company processes which enhances future customer operations that take place in the Front Office. Therefore, customer needs are then satisfied and value is delivered to them by means of a customized service. Whereas the Front Office (Physical and Virtual) capture the critical data required for CRM analytic processes.
Consequently, this Feedback Loop is fundamental to create sustainable competitive advantage, because with it the company will reach Operational effectiveness. In other words, it will “do the same things, but do it better” in a way that company competitors are unable to reproduce. [Porter et al 2001].
Data Warehouse Marketing (with campaign management) Integrator Collaborative CRM Visibility Line Analytical CRM
26 | P a g e
We have been studying service delivery from the company point of view and the key guidelines for enterprises design service processes, in order to deliver value with a CRM to the customers and satisfy their needs. Now we turn our attention to service quality, fundamental to explain how customers perceive the value of the service delivered to them [Cronin et al 2000]. It is essential to put ourselves in the eyes of the customer in order to do a proper value creation analysis, since “Value is truly in the eyes of the beholder” [Kothandarman and Wilson et al 2001].
2.4 - Service quality
In the Japanese philosophy, quality is defined as “zero defects, doing it right the first time” [Parasuraman et al 1988]. On the other hand, e-service quality is defined as “the customer’s overall judgment of an e-entity’s excellence” [Santos 2003; Park et al 2007]. By doing a cross check with our service/e-service definition (an act or a
performance that is delivered…), we define service quality or e-service quality as the customer overall judgment of an act or performance delivered to him.
Therefore, it is important to do a literary review on service quality dimensions in order to know how customers evaluate the service delivered and determine how they
(service quality dimensions) can be conceptualized and measured [Parasuraman et al 2002]. According to [Parasuraman et al 1985] “consumers evaluate SQ (service
quality) through a number of criteria”.
In SQ studies, the recurrent methodology used to retrieve this criteria can be either by machine, experts or the customers themselves [Loiacono et al 2002]., These criteria are then transformed into SQ dimensions normally recurring to the use of statistic programs, like it happens for example in [Loiacono et al 2002][Parasuraman et al 2005]. While other authors choose to retrieve their dimensions from previously
27 | P a g e
conducted researches and use them for their current paper [Wolfinbarger and Gilly et al 2003][Collier and Bienstock et al 2006], this is going to be our approach since discovering SQ dimensions is not the main purpose of this paper.
2.4.1 - The service quality dimensions
An extensive reading on SQ papers was made (regarding the website channel), and their findings (SQ dimensions) are presented at the appendix – Table 1. We have decided to use as a guideline the SQ dimensions of [Sousa and Voss et al 2006], since they were the only authors that stressed the need of a first line of SQ dimensions division, which are:
Physical quality Virtual quality Integration quality
These first order dimensions go along with our line of study, since we have a virtual quality to a Virtual service component, a Physical quality to a Physical service
component and an integration quality for an Integration service component. Next we present their definitions:
1. Virtual quality: “The virtual part of quality that should focus only on aspects of the service that are automatically provided without human intervention (Virtual component)” [Sousa and Voss et al 2006].
2. Physical quality: Physical part of quality that focuses on ”Physical service components that occur as a complement to virtual service components” [Sousa and Voss et al 2006].
28 | P a g e
3. Integration Quality: Their definition of integration quality is “the ability to provide customers with the seamless service experience across multichannel service instances” [Sousa and Voss et al 2006].
We found [Sousa and Voss et al 2006] integration quality definition to be limited, because is not addressed to service components. Regarding the integration factor presented and defined in [Goldstein et al 2002] service concept: “the integration of the “What” and the “How””, we define integration quality as the integration part of quality that focuses on the service components that integrates its concept notions of “What” and “How”.
The model sub-dimensions also suffered some modifications (see original model in the appendix – Table 2 and the one used for our present study in Table 3). We present and explain the reasons for that matter:
Physical dimension adjustment
All SERVQUAL dimensions from Interpersonal were kept, minus tangibles because concerns with the brick-and-mortar facilities (not the internet), therefore, it was removed.
Logistics fulfillment relates to attributes concerning tangible products and because we are addressing a bank with intangible products, it is also removed from this study. Service recovery, an adapted dimension from [Parasuraman et al 2005] E-RecSQual is substituted with Customer Service from [Wolfinbarger and Gilly et al 2003] for three reasons:
29 | P a g e
The authors did not mention the ServQual dimensions, failing to realize the presence of two dimensions with the same name in their study:
Responsiveness.
The Compensation dimension is, as the other previously mentioned, a dimension that concerns tangible products.
Contact has a very similar definition when compared with ServQual Responsiveness dimension. Both refer to time spent by the salesman to respond a service request.
Virtual dimension adjustment
The only modification occurs with the fulfillment dimension, since it concerns the possible failure in the delivery of the purchased tangible products. In this case, stock out is impossible to occur, since an e-service is created and stored as an electronic code and the bank we will address only sells financial products online.
Integration dimension adjustment
We select integration dimensions bearing in mind the importance of sustaining the information flow (“Feedback Loop”) across multiple service components, a condition vital towards knowledge creation.
Therefore, emotional appeal is introduced (experience), which lacked from Sousa and Voss study. We retrieve it from [Loiacono et al 2002] with the purpose of knowing the overall service (from all service components) impact on the customer, since “how customers experience activities is crucial to their perception of value” [Bitner et al 1992; Sandström et al 2008].
30 | P a g e
We maintained both Channel-service configuration and integrated interactions from the original model, adding potential perceptual attributes for each one of them:
For integrated interactions we propose Data consistency, fundamental to promote an exchange of knowledge/information between the customer and the firm, and to allow the analytical process as well. We define it has the ability to retrieve and access information from the customer. For Channel-service configuration we use a proposed indicator from [Sousa and Voss et al 2006] breath of channel choice, defined has “Degree to which customers can accomplish preferred tasks in individual channels” (in our case the internet). We also propose a Service Customization, defined as the company’s ability to provide a customize service to the customer.
F igu r e 5 – S er v ic e Q u a lit y Mo del
Physical quality Dimensions Definition Interpersonal Service Reliability
“Ability to perform the promised service dependably and accurately”
[Parasuraman et al 1988]
Empathy “The clients empathy towards the sales person; ” [Parasuraman et al 1988]
Assurance
“Knowledge and
courtesy of employees and their ability to convey trust and confidence”
[Parasuraman et al 1988]
Responsiveness "willingness or readiness of employees to provide service" [Parasuraman et al 1988]
31 | P a g e
Customer Service “Combining interest in solving problems” [Wolfinbarger et al 2003]
Virtual Quality Dimensions
Efficiency "The easy and speed of accessing and using the site" [Parasuraman et al 2005]
System
availability "The correct technical functioning of the site" [Parasuraman et al 2005]
Security/Privacy "The degree to which the site is safe and protects customer information” [Parasuraman et al 2005]
Integration Quality Dimensions
Integrated
interactions "Consistency across interactions with service providers" [Jonhston et al 2001 ; Sousa et al 2006] Data consistency
(communication) “Capacity to retrieve and access data information from the customer”
Channel-Service Configuration
"Quality of the available combination of services or their components"
[Sousa et al 2006]
Breadth of channel choice
"Degree to which the consumer can chose alternative Channels and both service components in an internet
environment " [Sousa et al 2006] Service
customization “Capacity of the firm to offer tailored made service and satisfy customer needs”
Emotional Appeal “Experience felted when using the website” [Loiacono et al 2002]
32 | P a g e
Next we approach Value Creation, our final chapter of the literary review, fundamental to understand if value was indeed created with the CRM systems.
2.5 – Firm’s Creation of Value
What is the source of value creation? [Porter et al 1985] stated that new value is created when firms develop/invent new ways of doing things using new methods, new technologies and or new forms of raw materials. In accordance is also [Priem et al 2007; Lepak et al 2007], although, he simplifies the matter by saying that “value creation involves innovation that establishes or increases the consumer valuation on the benefits of consumption [Lepak et al 2007].
The Resource Based View model of [Barney et al 1991] stands that created value can be originated and sustained by the firm resources (organizational processes,
information, knowledge, capabilities, etc.). For that, firm resources need to be: Valuable: Enables a firm to conceive or implement strategies that improve
its efficiency and effectiveness.
Rare: Not possessed by a large number of other firms
Imperfectly Imitable: Firms that do not possess cannot obtain them. Non Substitutable: There cannot be a substitute resource available in the
market.
Therefore, a company that innovates and increases the consumer valuation of
consumption, by using resources with these four characteristics, will generate value in a sustainable way.
However, how is a service valuated? [Bowman et al 2000; Lepak et al 2007] stated in their research that value is divided in two fractions, making the analyses on:
33 | P a g e
Use value: “Specific quality of a new job, task, product or service as
perceived by users in relation to their needs”. This means that the use value is the quality of what is perceived by the customer.
Exchange value: “The amount paid by the user to the seller for the use value of the focal task, job, product, or service”.
Still, [Porter et al 1985] stresses that value is “the amount buyers are willing to pay for what the firm provides them [Amit et al 2001] in a process that is defined in this paper introduction as payment equity. In other words, we have a company point of view, where the company offers a service and wants an amount to be paid in
exchange. On the other hand, we have the customer point of view which values the perceived quality of what the firm provides to him, and makes a judgment on whether use value meet’s the exchange value.
Notice that value is measured by total revenue [Porter et al 1985; Amit et al 2001], “the amount of money realized from selling goods or services in the normal
operations of a firm in a specific period of time”. [Source: Businessdictionary.com]. Consequently, the number of products bought during a time frame needs to be taken in consideration. According to previous studies [Oliveira et al 2007] [Hallowell et al 1996;Cronin et al 2000], if a customer is satisfied with the perceived value, the repurchase probability increases significantly leading, ultimately, to customer retention and customer loyalty. Therefore, we can conclude that the amount of products bought by a customer is a direct result of customer satisfaction and is an indicator of customer’s retention and loyalty to the firm.
Consequently, we may affirm that if Use Value >= Exchange Value (Price), the customer acquires the product/service. If so, and because Marketing is also
34 | P a g e
order to maximize a company revenues, the optimal price is achieved when Price = Use Value.
If Use value < Price the “exchange” does not occur, on the other hand, if Use Value > Price the customer buys the product, being the difference between both (Use Value – Exchange Value) the customer surplus, “a measure of the value of a particular deal to the customer, surplus is the difference between the fair price and the price actually paid” [Source: cval.com]. Therefore, when marketing delivers a customized service to customer segments (Process type: Define “What” to deliver), it should deliver a
service that enhances the customer Use Value perception, in order to create value and maximize company profits by setting a equivalent “custom made” price. The ultimate goal of a company is to create value, by the means of the exchange value. In order to accomplish that, a company has at its disposal resources as service processes, information, knowledge or managers capabilities, to develop new ways to deliver the “benefit package” to the customer.
In delivering a service, a firm encounters problems that may appear in every service component. Consequently, five service components were found: Physical front office and virtual front office, linked, to the service concept dimension “How to deliver”; Virtual back office and physical back office connected to the service concept
dimension “What to deliver” and a fifth component that integrates both, previously mentioned service concept dimensions. We also concluded that Marketing has the responsibility to design each service component process, with the help of market Knowledge, in order to discover customers needs and deliver value to them. Three types of processes are refereed: Processes that a) Define “What” to deliver, b) Define “How” to deliver the “What” and c) Integrate the “How” and the “What”.
Since Marketing needs Market Knowledge to design service processes, it is reviewed that a firm needs to joint efforts with CRM systems to enable a knowledge/information flow, which is fundamental not only to know customers needs and deliver value to
35 | P a g e
them, but also to improve operational efficiency and avoid competitors to “copycat” their methods, becoming imperfectly imitable.
Therefore, we place the CRM systems in our five service components and trace key guidelines that support the marketing department, in designing the three types of service processes with the aid of those systems: a) Define “What” to deliver - Deliver a customized service to customer segments, b) Define “how” to deliver the “What” - Use components and functionalities symbioses and c) Integrate the “How” and the “What” - Promote the Feedback Loop.
If a company follows these three guidelines, when delivering their service on the internet, it will create sustained value. This value is ultimately measured by the firm revenue.
Nonetheless, how does a firm recognize if all the guidelines are being carried out? By placing itself in the “eyes” of the consumer.
For that reason, we approach the customer view and “construct” a SQ model with Virtual Quality, Physical Quality and Integration Quality. The Virtual quality is focused on the virtual service component quality, whereas the Physical Quality concerns to the physical service component and the Integration quality on the Feedback Loop
(integration between the “How” and the “What”). We assign a second order of dimensions for each one of them, which will ultimately lead to their measurement. This SQ model is a tool to measure the various dimensions of use value and assess not only which dimensions the customer values the most, but also if the company is being able to deliver them.
We also conclude that value has its source on company resources, when these are used in an innovative way. Use value (perceived quality of the delivered service) and exchange value (“The amount paid by the user to the seller for the use value”.) are its dimensions. It is also determined, that value is measured by a company revenue,
36 | P a g e
being the optimal price, for marketing to set, achieved when Price = Use Value.
Therefore, marketing should customize both service delivery and the “adjusted” price to customer segments, in order to maximize the company revenues. Lastly, it is determined, that customer repurchase is a loyalty indicator.
Next we will present our case study, the On-line Manager from the company Virtual Managers. The purpose of this study is to verify if it is actually creating sustainable value or not. Therefore we will verify if Virtual managers follows the three rules to create sustainable value.
37 | P a g e
3 - Case Study: The Online Manager
In this chapter we explain first what the Online Manager project is, by reviewing its purpose (why was it implemented) and main features. Then we adopt our Literary Review methodology and explore Virtual Managers CRM systems and their
functionalities both in the firm front office and back office.
In our front office analysis we look at the collaborative and operational CRM systems, while in the back office we view the analytical CRM and the Marketing automation. This front and back office study is made with the purpose to assess how the CRM technology works in the Virtual Managers service schematics.
3.1 - Purpose and main features
According to Virtual Managers, the Online Manager is an innovation at the market level that makes the managers of this bank the firsts with the ability to have a real time interaction with its clients through the online website. This new technology is only possible due to CRM systems installed in the bank service component. This is shown in this section as we view the way it operates in the front and at the back office as well.
At the present time, this “new way of doing things” is only available at the company website, to a premium segment of clients and has the strategic intent of retaining these customers by presenting them with a customized service.
This service has its back bone in the presence of the Online Manager at the client’s computer, every time that he logs on to the bank’s website. In this moment, its main features are:
38 | P a g e
Gain access to handpicked financial products recommendations Interact with the manager online through messages
3.2 - The Front Office
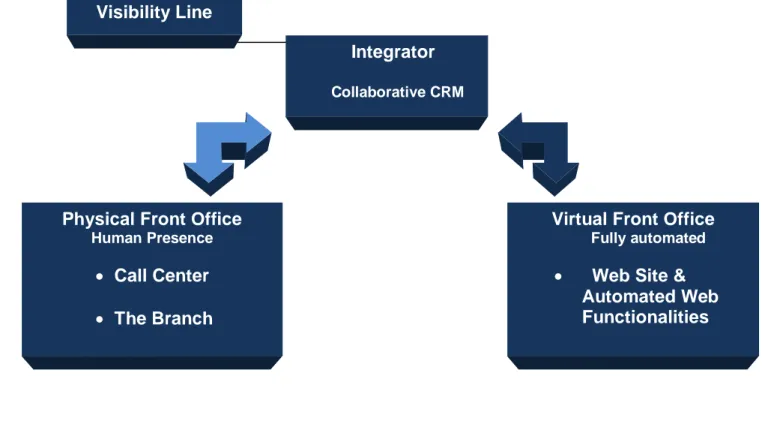
At the company, there are three channels connected to the collaborative CRM: the call center, the website and the branch. Our study is focused on the website. However, we will present the characteristics of each channel afterwards.
Two channels are connected in the Bank’s website thanks to the online application Chat functionality for the branch, and the Call back button functionality for the Call center. Both of them are functionalities that induce components symbioses at the front office (Figure 5)
Figure 5 – Virtual Managers front office service components
Physical Front Office Human Presence Call Center The Branch Visibility Line Integrator Collaborative CRM
Virtual Front Office Fully automated Web Site &
Automated Web Functionalities
39 | P a g e
3.2.1 - The Branch
The branch is only relevant to this study because it is the physical channel where the portfolio manager lays. Each and every premium customer has its personal portfolio manager, interacting online through the Siebel (CRM) interface.
3.2.2 - Call Center Channel
This channel was made available in March 1996. With this channel, customers can contact the bank via telephone and get in touch with a human operator.
The operator uses an application suit called Altitude, which enables him to reach all the information needed, in order to provide the services available in this channel. This application is connected to the Siebel collaborative system.
3.2.3 - Online Channel
The online website is separated in two sections, one where all the clients can enter, and the other where the online manager is, being this section restricted for premium members thanks to the Membership functionality. Because the online manager only functions at the premium section, this is the section that we are going to study, mentioning every time web functionalities are encountered.
At the members section, once the customer enters the first page of the Online Manager, he is able to see the manager’s name and his
40 | P a g e
with a welcome message. It says the last logon made and shows a link to the products recommendations.
It also shows information concerning security, alerting the customers about frauds, incenting them to read and follow security measures.
When the customer selects the link “know the
opportunities that I selected for you”, at the first page, he will then be
redirected to the page where all the recommendations made by his
personal manager are.
The next picture shows what the client sees when he selects one of the products. At the center of the
page we can see all the product characteristics (Web functionality: Preview product.), while on the left side we can see the available services that the costumer has in hand. Finally, on the right side, the customer
41 | P a g e
can see the manager’s name and photograph, along with the available choices: “I’m interested”, or “I’m not interested”. To buy the product the option “subscribe” is presented at the bottom. (Web functionality: Online purchasing.)
Once the customer selects a recommended product he can:
Show interest in the product, asking to be contacted by his personal manager or by the Call Center.
Say that he’s not interested. In this option two cases can occur:
1. Permanently “not interested”: The customer says that he wants no further contact to be made (Closes the approach).
2. Temporarily “not interested”: The customer wants to be contacted about future campaigns concerning that product.
Buy the product, if the product is available online (closes the approach). Interaction with the Online Manager
The “mailbox” is also secured by the Membership CRM functionality. In this case, this feature is a card with a sequence of numbers. The software will ask the consumer to insert only some digits of the sequence in order to access the membership area. This way, premium customer and their manager can exchange real time messages with each other. We now present a list of functionalities the client has with the mailbox:
Send text messages to the manager View messages sent by the manager View messages sent by the call center View messages sent to the manager
42 | P a g e
If the customer decides to send a message, he selects the option “my manager”, and afterwards “contact”. Once again, he will see the manager’s photograph.
However, this time he will have access
to his name, telephone number, cell number and email.
There is also the location, phone and address of the managers’ agency. Once the customer sends a message, he is also free to choose the option to be notified after the message his received and readied.
Now that we understand how the Collaborative CRM works along with the website and the other two channels, we advance to the next CRM system.
3.2.4 - Operational CRM
As we have shown at our CRM section, operational CRM can be handled by three company departments: Sales (in our case the branch), Service and Marketing
department. Since the Marketing department does not have an actual interaction with the customer over the internet, one that is visible to him, we address this department CRM usage in the back office.
We have approached the Marketing department in a sense of collecting information on how these departments made use of this CRM system:
43 | P a g e
The Branch: At the branch, managers are the ones who have direct contact with the customer by using the Siebel CRM. According to the marketing department, at the present time, each manager handles, on average, with 600 hundred customers. When a campaign is launched, their first approach is to send the following message to targeted clients personal email address: “Hello Mr. (Miss) «Client’s name», my name is «Manager’s Name» your personal manager and I have selected new
opportunities for you”. The client is then invited to click on a link available at the sent email, which redirects the customer to the membership area access page at the
Company Virtual Managers website. Each manager has at his disposal Sales Automation applications such as:
1. Opportunity Management: This allows the manager to see the status of his business opportunities.
2. Activity Management: Manager has customer oriented guidelines, written for each status of his business opportunity (See appendix table 3 – Manager Processes).
3. Contact Management: This is not a new application, since the manager already had access to it before the Online Manager implementation. Nevertheless, it allows him to see all customer data information (name, data, phone, interests…). This application as a ratio that works as an indicator, called Client Single View. This indicator shows the percentage of customer data information completion (ex: There are 10 fields of
customer information. If 2 of them are blank for customer X, the indicator for that same customer is at 80%).
When the customer enters the site and interacts with his manager, the latter has information not only on who asked to be contacted (either by the manager himself or the call center), but also on who consulted the product/campaign, due to the
44 | P a g e
If the customer is not contacted in a period of 48h following his request, Alert
Callouts will appear into the manager’s screen at Siebel once the login is made. This pop-up will only disappear once the contact is taken care of.
In case of more than one Alert Callout, they will appear in order of creation.
Services: in the online channel (premium section), this subject is made via the chat functionality. In case of any complain, the manager reports it to its cross-selling manager (superior ranking), and he will decide the course of action. Therefore, no specific process is design for handling complains.
3.3 - The Back Office
In our meeting with the Marketing department, they mentioned that their service’s price remained unaltered , acknowledging their task of launching the campaigns and designing their service processes, pointing out however, the usage of a separate system called CSS (campaign support system), which is integrated to Siebel. Concerning the analytical system, this is called SAS data miner with a mission to enrich the analysis of client data and the objective of transforming them into useful business knowledge, in order to better understand customer’s behaviors and to follow their evolution.
45 | P a g e
The Analysis team receives requests from the marketing department, in order to fabricate a list of the clients to be targeted by each campaign. The requests in order to feed the campaign manager can have two rollouts:
The Ad-hoc extractions:
The targeted clients by the campaigns are selected through empiric criteria, defined by the marketing department. Afterwards, the analytical department selects which clients match the criteria.
Propension modules:
The choice of target customers is a result from the merging between business criteria that lead to the identification of possible customers to target, and the result of the data analysis that lead to the propension module. The objective of this kind of study is to predict who will respond affirmatively to the offer of a product or service, in order to estimate the future behavior of a client.
After talking with the responsible in office for the analytical department, he stated that approximately 80% of the times, the ad-hoc method was the taken course of action. The explanation given by the responsible was: “we would really like to
perform more propension modules, however, time is an obstacle, and the marketing department knows time its critical so they send us the criteria upfront”. He also
stated that due to the fact that he was running the analysis on a different system, he wasn’t able to access what clients bought the financial products. He had to do a
series of assumptions to get there.
We have seen how the Online Manager operates, with the support of the CRM systems and applications, in both front and back office in the Virtual Managers
website. In the next chapter, we perform the measurement of this project success, by assessing the value created through this new service display.
46 | P a g e
4 - Measuring the value creation of the on-line manager
for customers
In this chapter we discuss our methodology, placing first each Virtual Manager application in the corresponding service component. Then we link our service schematics to our SQ Model. Both these assumptions will allow us to perform an analysis to the use value dimension. This dimension is vital to this study, since if it is equal or surpasses the exchange value in a process called payment equity, the firm captures the sale; this fact allows the company to set the optimal price on its
customize service, setting it on Price=Use Value, maximizing their revenues. In section 2, Use Value measurement is performed, explaining how we reach the results in the SQ Model metric scales (important to reduce service intangibility [Paladini et al 2002]), virtual quality dimensions, physical quality dimensions and integration quality dimensions.
The results of the analysis are discussed in section 3. Afterwards, we transpose this analysis to the company view, analyzing each service component’s ability to create value, along with the measurement of the value created with the On-line Manager, in section 4.
4.1 - Applied methodology
Our purpose is to answer the following question:
Determine and analyze whether or not this new technology improved the online channel value for the company Virtual Managers.
In order to answer this question we will use four samples of Virtual Managers
customers, two from the first period of analysis (1st semester of 2007), and perform a
47 | P a g e
2008). This samples on which we perform our analysis are service quality studies retrieved from Virtual Manager Marketing department. Every year the Marketing department recurs to an external company, by means of outsourcing, to perform service quality reports on their operations. Therefore, we have asked the Marketing department for two types of studies concerning 2007 and 2008 reports: 1) Virtual quality reports, studies concerning the web site quality and 2) Physical quality
reports, which are studies performed concerning their managers performance (placed at the branch). The details on how we handle the data will be explained up front in section 4.2.
It is important to affirm that, due to reasons of information confidentiality, the only information we are permitted to disclose are the variations from one year to the other.
We now review our “players” (Virtual Managers applications) place in each service component as is presented in figure 6 (nº1):
Physical front office: We can find the manager using the Chat functionality, along with Sales automation applications and the call center using the call back button.
Virtual front office: In this service component is the internet with all the fully automated applications (Membership, online purchasing and the preview
product).
Physical back office: The marketing department uses CSS system to
coordinate the campaigns while the analytical department uses the SAS system to create customer knowledge.
Virtual back office: The placed entity, not visible to any customer and fully automated, is the Data Warehouse with all customer oriented data.