Development of a framework for the measurement and
control of customer support services
Nuno Filipe Mesquita Carvalho
Master’s Thesis
Supervisor at FEUP: Prof. Ana Camanho
Master in Industrial Engineering and Management 2015-07-01
To my parents, For their great support.
Abstract
This project has the main goal of developing a framework for the measurement and control of customer support services at Farfetch, an e-commerce luxury goods company. Due to the growth of the company and the aim to provide the best customer experience in the market, it is necessary to increasingly use the available data to optimize the three channels used on the process of customer support: contact form/email, chat and phone.
With this project, after an initial overview of channels and former metrics used for controlling customer support services, the Key Performance Indicators have been redefined and new reporting methods have been created using two Business Intelligence and Analytics software solutions: Microsoft Power Pivot and Tableau. These reporting methods enable the analysis of the performance of the players involved in customer support at different levels: global, by team and individual. They also allow the verification of which channels are being underused or which employees are being overloaded. With the new framework developed in this project, senior management will have multiple sources of information available that can help them to manage customer relationship and to improve customer support services. The dashboards implemented are available and automatically configured for the players involved in the three customer support teams, located in Porto, London and Los Angeles offices.
With the contribution of the work developed in this dissertation, the performance of the Customer Service Department has improved significantly. In the first twelve weeks after the implementation of the first report, the most relevant improvement is related to the increase of the Response Rate, from 60.2% to 86.4%, despite the growth of 11.7% in the number of contacts created. Besides this metric, the improvement has also been verified in three areas of business performance: Operational Efficiency, Service Quality and Customer Satisfaction.
Desenvolvimento de um sistema para medição e controlo dos
serviços de apoio ao cliente
Resumo
Este projeto tem o principal objetivo de desenvolver um sistema para medição e controlo dos serviços de apoio ao cliente da Farfetch, uma empresa de vendas online de bens de luxo. Devido ao crescimento da empresa e ao objetivo de proporcionar a melhor experiência ao cliente do mercado, tornou-se necessário usar a informação disponível para otimizar os três canais usados no processo de apoio ao cliente: formulário de contacto/email, chat e telefone.
Com a realização deste projeto, depois de uma visão inicial dos canais e métricas anteriormente utilizadas para o controlo dos serviços de apoio ao cliente, os Indicadores de Desempenho foram redefinidos e novos relatórios foram criados em duas plataformas de Business Intelligence: Microsoft Power Pivot e Tableau. Os relatórios permitem a análise da performance dos membros envolvidos no apoio ao cliente a diferentes níveis: global, por equipa e individualmente. Também permitem verificar quais os canais que estejam a ser subutilizados e quais os funcionários que estão a ser sobrecarregados. Com o novo sistema desenvolvido neste projeto, a gestão de topo terá várias fontes de informação disponíveis que lhes permitirão gerir a relação com o cliente e melhorar os serviços de apoio ao cliente. Os dashboards implementados estão disponíveis e automaticamente configurados para os funcionários envolvidos nas três equipas de apoio ao cliente, localizados nos escritórios do Porto, Londres e Los Angeles.
Com a contribuição do trabalho desenvolvido neste projeto, a performance do Departamento de Apoio ao Cliente melhorou significativamente. Nas primeiras doze semanas após a implementação do primeiro relatório, a melhoria mais relevante está relacionada com a Taxa de Resposta, que subiu de 60.2% para 86.4%, ainda que tenha existido um aumento de 11.7% no número de contactos criados. Além desta métrica, a melhoria tem vindo a ser verificada em três áreas de medição de performance: Eficiência Operacional, Qualidade do Serviço e Satisfação do Cliente.
Acknowledgments
I would like to give my gratitude to everyone within Farfetch involved in this project. Without the support of all of them, the work described in this dissertation would not have been possible. In particular, a big thank you to my supervisor at Farfetch, Sara Guerreiro, for the patience, support, advices and sharing of her knowledge. She was always available for giving me intelligent insight and I would like to reinforce how grateful I am for that. I would also like to thank all my colleagues at Farfetch for the good times spent together along these months. Also I would like to express my gratitude to all my professors at FEUP, for making me become a better student and grow as a human being. A special mention to my supervisor at FEUP, Prof. Ana Camanho, for the time, support and valuable comments and suggestions throughout this dissertation.
And last, but not least, I would like to express my appreciation to my parents. This is only possible due to their endless support, continuous care and encouragement. For them, words will never be enough.
Table of Contents
1 Introduction ... 1
1.1 Farfetch Overview ... 1
1.1.1 Farfetch Structure ... 2
1.1.2 Customer Service Department ... 3
1.1.3 Continuous Improvement Team ... 4
1.2 Project Motivation ... 4
1.3 Project Goals ... 4
1.4 Methodology ... 5
1.5 Report Structure ... 5
2 State of the Art ... 6
2.1 Customer Service in Luxury E-Commerce ... 6
2.2 Performance Measurement ... 7
2.3 Dashboards ... 9
2.4 Kaizen - Continuous Improvement ... 10
3 Customer Service Overview ... 12
3.1 Customer Service Channels ... 12
3.1.1 E-mail/Contact Form ... 12
3.1.2 Phone Calls ... 14
3.1.3 Chat ... 14
3.2 Former Reporting Methods ... 15
3.2.1 Former Executive Weekly Report ... 15
3.2.2 Former Daily Team Reporting ... 19
3.3 Conclusions ... 20
4 Implemented Solution... 21
4.1 Requirements Verification ... 21
4.2 Executive Weekly Report ... 22
4.2.1 New Key Performance Indicators ... 22
4.2.2 Main Features ... 30
4.3 Executive Weekly Dashboard ... 33
4.4 Daily Dashboard ... 34
4.4.1 Metrics ... 35
4.4.2 Dashboard ... 37
4.4.3 Script for Blocks of Information Shift ... 38
4.4.4 Main Features ... 40
4.5 Daily Management Dashboard ... 41
4.6 Weekly Management Dashboard ... 44
4.7 Main Results ... 46
5 Conclusions and Future Projects ... 49
5.1 Future Projects ... 49
References ... 51
APPENDIX A: Executive Weekly Report ... 54
APPENDIX B: Weekly Queries ... 56
APPENDIX C: Daily Queries... 58
APPENDIX D: Daily Management Dashboard ... 61
Acronyms
B2B – Business-to-business B2C – Business-to-consumer BI – Business Intelligence CS – Customer Service
ERP – Enterprise Resource Planning GMT – Greenwich Mean Time IT – Information Technology KPI – Key Performance Indicator NPS – Net Promoter Score SLA – Service Level Agreement SQL – Structured Query Language VPN – Virtual Private Network
List of Figures
Figure 1 - Relationship among Farfetch, Partners and Customers ... 2
Figure 2 - Farfetch Organizational Diagram ... 2
Figure 3 - Customer Service Structure ... 3
Figure 4 - Customer Service technologies and media richness potential ... 7
Figure 5 - Contact Form ... 12
Figure 6 - Tickets Platform Interface ... 13
Figure 7 - Tickets Platform Interface - Backlog Tickets ... 13
Figure 8 - Phone Number presented on the website ... 14
Figure 9 - Customer's Chat Interface ... 15
Figure 10 - Chat message after the implementation of the dynamic chat ... 27
Figure 11 - Drill Down capability on Power Pivot ... 31
Figure 12 - Slicer by year and week ... 31
Figure 13 - Slicer by office ... 31
Figure 14 - Example of KPI presentation columns ... 32
Figure 15 - Example of a KPI chart ... 32
Figure 16 - Executive Weekly Dashboard ... 33
Figure 17 - Daily Dashboard ... 37
Figure 18 - Daily Dashboard: Ticket Charts Block ... 38
Figure 19 - Daily Dashboard: Detailed Ticket Charts Block ... 39
Figure 20 - Daily Dashboard: Call and Chat Charts Block ... 39
Figure 21 - Drill Down assessment on Tableau ... 40
Figure 22 - Drill Down example on Tableau ... 40
Figure 23 - Filtering option (by office) ... 41
Figure 24 - Calls Inbound by Language/Phone Line ... 42
Figure 25 - Calls Inbound by Hour ... 42
Figure 26 - Filter for Calls by Phone Line... 42
Figure 27 - Filter for customer promise results ... 43
Figure 28 - Escalations per Solved Tickets ... 43
Figure 29 - Call Graphs and Filters on the Weekly Management Dashboard ... 45
Figure 30 - Evolution of the number of contacts generated ... 46
Figure 31 - Evolution of the Response Rate ... 46
Figure 32 - Evolution of the percentage of Calls Inbound Answered (Gross and within customer promise results) ... 47
List of Tables
Table 1 - Percentage of Orders by Country (from the beginning of 2014 onwards) ... 26 Table 2 - New Customer Promise Hours (in Local Times) by Phone Line ... 26 Table 3 - New KPIs implemented, responsible and areas ... 29
1 Introduction
Online commerce has become a very interesting business. However, the use of the Internet to sell luxury goods is not common. While the Internet is about access, luxury is usually associated to denying access (Pruzhansky, 2014). Therefore, it is necessary a great knowledge of the two businesses for their successful merge.
This dissertation, developed at the Continuous Improvement Team of Farfetch, a luxury goods e-commerce company, has the main goal of developing a framework for the measurement and control of the customer support services. Due to the company’s target audience, it is fundamental to guarantee the provision of an excellent customer support service.
1.1 Farfetch Overview
Farfetch is an innovative e-commerce company that brings the world’s most famous luxury fashion boutiques to customers all over the world. Launched in 2008, Farfetch is a London based company and it has continuously grown to become a truly global company. It currently belongs to the restricted groups of start-up companies that have soared to a $1 billion valuation based on fundraisings.
The network of Farfetch associated stores is composed by more than 300 boutiques all over the world and offers customers a mix of products from over 1000 designers, providing services for customers on every continent.
The end customer is able to shop luxury fashion goods from the most famous and influential boutiques all over the world in a unique, safe and pleasant way. Farfetch offers a catalogue of products gathered in one place from the most renowned brands and designers and from boutiques such as American Rag, Biondini, L’Eclaireur, Stefania Mode and Vitkac.
Farfetch works simultaneously as an e-commerce platform and a different and extra sales channel for its various partner boutiques. The company works as a bridge between boutiques and end customers. The services provided by the company are related to two distinct segments: B2B segment – represented by the boutiques which gain a very strong sales channel – and B2C segment – represented by the customers which are able to shop luxury goods in a unique and revolutionary way.
The service provided by Farfetch stands out from competitors by its commission based and win win business model, in which boutiques benefit from online marketing, partner relations, customer support services, web platform and solutions for payment handling, logistics and warehousing.
The main advantage of the Farfetch business model is the unlikelihood of success of such a service for a single boutique, as its high costs would be hardly worth for a single entity. Farfetch benefits from economies of scale when providing all these services to a high number of boutiques. Moreover, Farfetch has the advantage of providing five times more labels and items on the website than its more direct competitors. As a result, consumers can choose from a bigger catalogue, which is only possible because the company does not hold inventory, unlike its competitors.
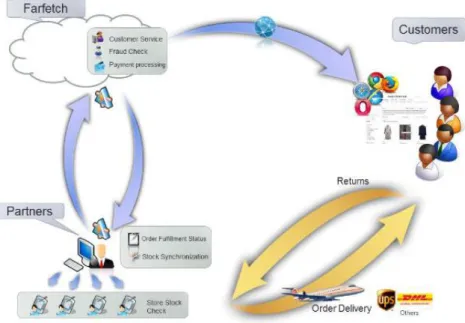
The company provides a very complete service every time a purchase is made. Its services include Fraud check, Payment processing and Customer Service (CS) as well as Courier service either directly from the boutique to the customer or from the customer to the boutique, in case the return is requested and accepted.
The relationship among the three players (Farfetch, Partners and Customers) is represented on Figure 1.
Figure 1 - Relationship among Farfetch, Partners and Customers
Farfetch aims to change the way the world shops for fashion, conquering a leading market position.
1.1.1 Farfetch Structure
Farfetch is currently divided in nine offices in seven countries: Brazil, China, Japan, Portugal (Porto and Guimarães), Russia, United Kingdom and United States (Los Angeles and New York). In total, Farfetch employs about 600 people.
Regarding the departmental division, Farfetch is divided in twelve departments: Account Management, Business Development, Customer Service, Finance, Human Resources, Marketing, Merchandising, Office Management, Operations, Partner Services, Production and Technology.
This project has been developed at the Continuous Improvement Team, integrated in the Operations Department. It is related to the improvement of Farfetch customer support services, so this dissertation is focused on the Customer Service Department.
The organizational diagram is represented on Figure 2.
1.1.2 Customer Service Department
Apart from Porto office, London and Los Angeles offices also have Customer Service Teams. There is also a Customer Service Team in the Brazilian office, but it works in a different way following procedures that are independent from the other Customer Service Teams, like most of the other Departments in Brazil. For this reason, the Brazilian office will be excluded from the developments made along this project.
The ever increasing number of contacts has forced the growth of the Customer Service Department workforce. Moreover, CS Teams are expected to be extended to the Japanese and Russian offices until the end of 2015.
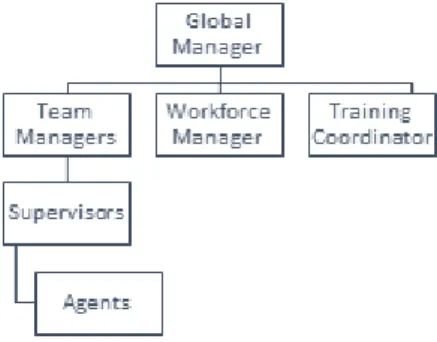
Regarding the departmental structure, it is organized as follows:
Global Manager: located in Los Angeles; responsible for taking strategic decisions and assuring that the players within the Department keep aligned with the global strategy of the company;
Team Managers: one located in each of the offices; responsible for assuring that the needs of customer are being satisfied, managing staff and providing direction, instructions and guidance to supervisors and agents;
Workforce Manager: this is a new role and the manager will be located in Porto; responsible for creating an effective global scheduling of agents and forecasting customer demand;
Training Coordinator: located in London; responsible for training and preparing personnel and documenting training activities within the Department;
Supervisors: two located in each of the three offices; responsible for providing guidance to the agents of the team and reporting to team managers, ensuring that all agents provide a good service;
Agents: located in the three offices; responsible for interacting directly with customers and for ensuring that each customer has a pleasant experience.
The departmental structure is represented on Figure 3.
Figure 3 - Customer Service Structure
The customer can contact Customer Service Teams through three different channels: Email/Contact Form, Chat and Phone. These channels will be further explained in the following chapters.
However, Customer Service Teams do not communicate uniquely with customers. Queries often require the communication either with other internal teams or with Partner Boutiques. These queries are usually placed by customers who have completed their purchases.
The internal interaction takes place with:
Courier Team: queries related to returns and delivery issues;
Partner Services Team: queries that require the communication with boutiques; Production Team: queries related to sizing, photos, composition, brand, gender,
Order Support Team: queries related to the detection of fraudulent customers; Refunds Team: queries related to processing refunds.
As a consequence of the communication with internal teams and Partner Boutiques, some of the Customer Service Department results are affected by the performance level of these entities. Developing ways to control and measure performance within this Department will also help to manage future process improvements of other Farfetch Teams.
1.1.3 Continuous Improvement Team
The focus of the Continuous Improvement Team is to lead organizational-level change while training improvement methodologies. There is an ongoing effort to improve the organization’s services and processes, focusing on efficiency, effectiveness and flexibility.
Keeping the services provided aligned with customers’ needs enforces companies to adopt continuous improvement strategies. Both technology and customers’ requirements evolve continuously. In order to keep the business growth, every company should have the permanent goal of improving both services provided and internal processes.
It uses the Kaizen approach, a Japanese method that aims to make improvements based on small changes. The Kaizen method needs the commitment of all levels of the organization and it highly depends on the workforce. It should continually be seeking ways to improve performance.
Once customer support services are most of the times the only means of direct contact with online companies, it is possible to understand the importance of applying this method within the Customer Service Department.
1.2 Project Motivation
Due to Farfetch target audience, the company strives to deliver the best customer experience in the market. Mainly in the luxury e-commerce market, the provision of an excellent customer support is primordial for the success of the company.
With the growth of Farfetch and the respective increase of orders, the number of contacts received has continuously grown. It is necessary to increasingly use the available data to optimize the channels in the process of customer support. This is essential to align the customers’ needs with the resources available.
It is now vital to guarantee a full control of Customer Service actions through the definition of Key Performance Indicators. These enable monitoring all players involved in Customer Services. Therefore, it is very important to align the specification of Key Performance Indicators with the company business model, as well as design reporting methods that make the relevant information available to the right users.
1.3 Project Goals
When the project started, the Key Performance Indicators were reported on a weekly and daily basis. However, most of them were not being correctly calculated. Taking actions based on wrong KPIs is not advisable and might be risky. Moreover, the former metrics were not sufficient for the needs of the Customer Service department. More accurate ways of reporting, with new types of Key Performance Indicators, were needed in order to align the levels of Customer Service provided with the strategic goals.
After this project, with the redefinition of the Key Performance Indicators as well as the construction of new reporting methods, all Farfetch collaborators that directly interact with customer support should be able to assess more accurately their performance. This requires the
creation of proactive alerts, based on dashboards, that can inform managers and users that some channels are being unused or employees are being overloaded. Furthermore, top management should have access to more accurately performance measures, reported in different ways and periodicities, through the creation of Executive Reports.
The dashboards will be available for Customer Service users in all the offices with Customer Service Teams: Porto, United Kingdom and United States. In the near future, these will also be available in Japan and Russia. Executive Reports will be available for any Executive or Customer Service Manager on Farfetch SharePoint.
Furthermore, these reporting methods are expected to exist as an initial development to support future processes improvements. After this project, and with the establishment of these reporting methods, it should be possible to better understand where current customer support service processes fail and to work on their improvement.
1.4 Methodology
The first step defined was the identification of the former Customer Service metrics and processes. These were critically analysed and evaluated. Afterwards, the Key Performance Indicators were redesigned and complementary metrics were created to evaluate the level of service. It was made an analysis to the most appropriate reporting methods. Suitable software solutions, often involving queries to large databases, were developed to calculate the new metrics. At the same time, new reports were designed to disseminate accurately managerial information. Through the implementation of these reports, it should be possible to quickly and effortlessly present the new Key Performance Indicators.
A continuous interaction with the players involved in the Customer Service was necessary in order to establish the most appropriate Key Performance Indicators according to the information actually available in the databases. Their requirements and suggestions were always taken into account throughout the project.
After the implementation, a follow-up process was made in order to understand possible improvements to the reports and dashboards created. An intense dialogue with all Customer Service users was necessary to add and modify particular points of the reporting.
By following these steps, it was implemented an iterative process that allows to assess the needs of the players involved in the Customer Service and to promote a culture of continuous improvement.
1.5 Report Structure
The content of this dissertation is structured as follows:
Chapter 2 presents the state of the art of the main themes addressed – Customer Service in Luxury E-Commerce, Performance Measurement, Dashboards and Continuous Improvement. Chapter 3 presents an overview of the main limitations found on the indicators of customer service originally used by Farfetch, which have motivated the execution of this project. The reports formerly utilized for measuring customer support service level were also reviewed. Chapter 4 presents the new solutions developed along this project. It addresses the main issues found on the redefinition of the new Key Performance Indicators and the new types of reporting methods proposed, including their main functionalities and characteristics. It is also made a brief overview of the results achieved after the implementation of the reporting tools.
2 State of the Art
This chapter addresses the following topics: Customer Service in Luxury E-Commerce, Performance Measurement, Dashboards and Continuous Improvement.
2.1 Customer Service in Luxury E-Commerce
Luxury is a culture and a philosophy that requires the understanding of the business, because its intricacies and output are essentially different from other types of goods, such as daily consumer goods (Okonkwo, 2009). In economic terms, luxury objects are those whose price/quality relationship is the highest of the market (Kapferer, 1997). A major issue related to the definition and measurement of luxury thus arises from its subjective character (Kapferer and Michaut-Denizeau, 2014).
The unique luxury characteristics, such as high price and quality, are a challenge in the integration of luxury branding within the Internet and digital environment (Okonkwo, 2009). There is the perception that internet sales might affect the high end image that customers attach to luxury goods (Pruzhansky, 2014). For this reason, until recently the luxury industry showed low commitment towards integrating advanced Internet technologies in the sector’s marketing and overall business strategies (Okonkwo, 2009). However, nowadays the consumers require retailers to communicate with them using the Internet. The changes in the technological environment have been rapid and relate closely to changes in consumer behavior in terms of how they prefer to shop, communicate and receive their deliveries (McCormick et al, 2014). The most experienced and successful businesses in using e-commerce have realized that the key determinants of success or failure include customer service quality (Lee and Lin, 2005). An appropriate customer contact management is a primary determinant of end customer perceptions of overall service quality. As such, customer contact services have a great impact on customer satisfaction and they can be a strategic asset for the company (Froehle, 2006). Understanding customer expectations is a prerequisite for delivering superior service (Parasuraman et al, 1991). Managing both the technologies and the personnel needed for providing high-quality, multichannel customer support creates a complex and persistent operational challenge. Adding to this difficulty, it is not clear how service personnel and these communication technologies interact to influence customer perceptions of the service being provided (Froehle, 2006).
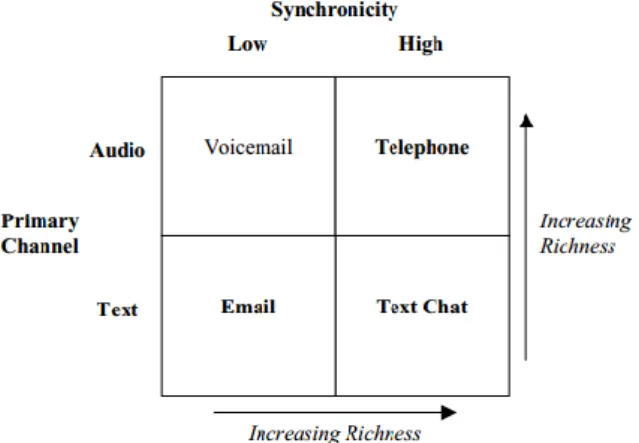
Regarding customer support channels, telephone calls continue to be the most frequent means of communication, although companies are also using e-mail and chat. E-mail is defined as the sending of text-based messages of virtually any length that can be read and responded to in an asynchronous (nonreal-time) manner. Chat, is defined as the sending and receiving of short, text-based messages, where the sender and recipient communicate with usually no delays and high synchronicity (Froehle, 2006).
The three technology-based media – chat, e-mail and telephone – exist along a continuum of increasing media richness potential based on the medium’s synchronicity and primary communication channel (text or audio). This framework is represented on Figure 4 (Froehle, 2006).
Figure 4 - Customer Service technologies and media richness potential
The difficulty with trying to keep customers returning online is the reason why the quality of the offering is critical (Cox and Dale, 2001). Typically, online customers can more easily compare alternatives than offline customers (Shankar et al, 2003). Specifically in the world of e-commerce, the interaction between a customer and a business will usually take place with a computer as the interface. Communication is difficult on the Internet, as the customer can only communicate directly with the company if the website offers these kind of services (Cox and Dale, 2001).
In customer support services, a customized service is very appreciated since the personnel can ‘give’ counsels, guidance to the customized advice, understanding the customer overall goals and needs (Olson and Olson, 2000). This happens because automated services are not intelligent enough. They do not allow the customer to have dialogue and ask follow-up questions or ask for explanations (Johan and Nahid, 2000). Many customers are hesitant to complete a purchase if they have even one unanswered question. Live support, such as phone or chat, gives customers answers to their questions on the spot, in real-time, which increases customers’ satisfaction level (Elmorshidy, 2011).
Customer service operations are often the most visible part of an IT organization to customers. By improving the quality of these processes, organizations can easily increase the customer satisfaction on services and products (Jäntti and Pylkkänen, 2008). Particularly in the luxury industry, given its special characteristics, it is vital to assure that the customers get satisfied with the service provided.
2.2 Performance Measurement
Performance measurement is a topic which is often discussed but rarely defined. Literally, it is the process of quantifying action (Neely et al, 1995). It is a fundamental principle of management. The measurement of performance is important because it identifies performance gaps between current and desired performance (Weber, 2005).
Nowadays strategies and competitive realities demand new measurement systems. There has been a shift from treating financial figures as the foundation for performance measurement to treating them as one among a broader set of measures. The impetus was the realization that the traditional companies’ existing systems, which were largely financial, undercut their strategies. (Eccles, 1990)
Key Performance Indicators, commonly known as KPIs, are quantifiable metrics which reflect the performance of an organization in achieving its goals and objectives. They measure the business health of the enterprise and ensure that all individuals at all levels are “marching in step” to the same goals and strategies. They also provide the focal point for enterprise-wide standardization, collaboration and coordination. The selection of the wrong KPIs can result in
counter-productive behavior and sub optimized results. Although all KPIs are metrics, not all metrics are KPIs (Bauer, 2004).
One of the main issues for organizations that have information systems is data overload, as most of them generate some redundant performance reports. Yet another problem with the performance measures used in many organizations is that they are rarely integrated with one another or aligned to the business process (Neely, 1999). A key principle of performance management is to measure what you can manage. In order to maintain and improve performance, each function in the organization must focus on the portion of the indicators that they influence (Weber, 2005).
Selecting the right measures is vital for effectiveness. Even more importantly, the metrics must be built into a performance measurement system that allows individuals and groups to understand how their behaviors and activities are fulfilling the overall corporate goals (McNeeney, 2005). The development of these performance measurement systems can be divided into three main phases: the design of the performance measures and the identification of the key objectives; the implementation of the performance measures, which includes an initial collection, collation, sorting/analyse and distribution; the use of the performance measures to assess the implementation of the strategy and to challenge strategic assumptions (Bourne et al, 2000).
When designing the performance measures metrics, one must have the end result in mind, focusing on what the desired outcomes of the work processes are. This might be difficult to accomplish since organizations do not work as a set of isolated departments, as they collaborate with each other, so a single group does not control all the key steps. Moreover, different departments collect different silos of information that produce metrics, originating different opinions of company performance and limiting a common understanding of the business behaviour (McNeeney, 2005).
For the purpose of categorisation, implementation is the phase in which systems and procedures are put in place to collect and process the data that enable measurements to be made regularly. This may involve computer programming to trap data already being used in the system and present them in a more meaningful form. Some new procedures may be initiated so the information currently not recorded is captured, and completely new initiatives may occur (Bourne et al, 2000).
Performance measurement on customer contact services is extremely relevant since customer services are directly provided to end customers. A good communication between them and the company can have a large impact on end customer satisfaction. Most companies seem to miss the important link between the employee satisfaction, service quality, customer satisfaction and profitability (Marr and Neely, 2004). A predominant focus on efficiency may be counter-productive when trying to satisfy the customer. For example, if the agents are being measured on the total time spent on each contact, they might not focus on solving the customer’s problem, but instead end the contact as quickly as possible (Tate and van der Valk, 2008).
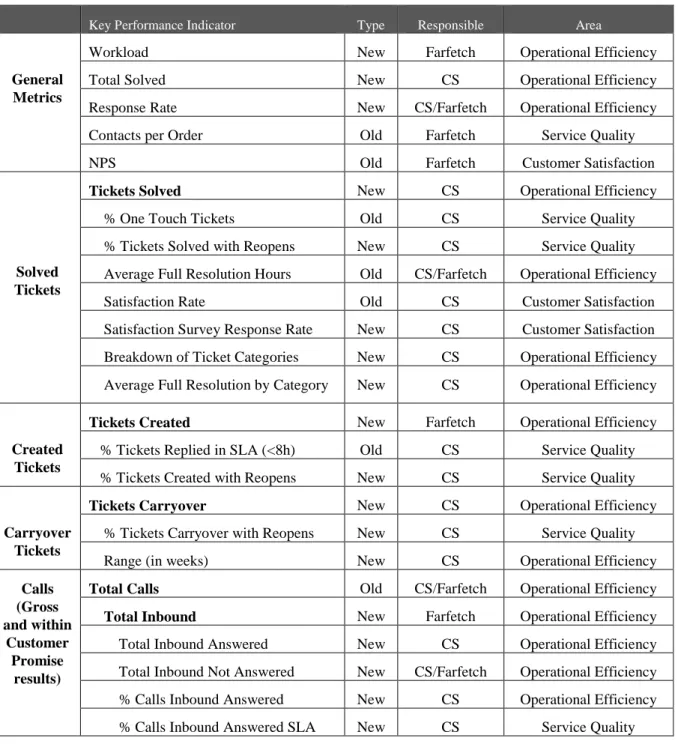
According to Tate and van der Valk (2008) the Business Performance in Customer Services is mostly tested in the following 4 areas: Operational Efficiency, Customer Satisfaction, Service Quality and Employee Satisfaction. These measures are usually measured as follows:
Operational Efficiency: the most commonly efficiency indicators are number of contacts, average times, average speeds of answer, queuing times and abandonment rates;
Customer Satisfaction: most firms send customer satisfaction surveys to a sample of customers, others use automated surveys after the contact with the customer is finished; Service Quality: metrics as the compliance to standards of Service-Level Agreements (SLA). Besides classic operational measures such as queuing time or contact time, other
aspects frequently measured include Greeting, Communication Style, Tone of voice, Knowledge of employee, Competence in performing the task and Close;
Employee Satisfaction: the most frequently metrics used are: Staff Turnover, Absenteeism, Timeliness, Compliance, Friendliness and Attitude (Marr and Neely, 2004).
According to Marr and Neely (2004) in order to manage well, managers “need to ensure that
the measurements accurately portray what management wants to be measured. The effective management of high quality voice-to-voice service delivery could be adversely affected by the absence of a valid measurement instrument.” Moreover, the performance should not be
measured in isolation from the performance of the whole organization and this service should be used to differentiate the product or service offered and to drive customer satisfaction. Nowadays customer contact services allow a company to build, maintain and manage customer relationships by solving problems and resolving complaints quickly, providing information, answering questions and being available usually 24 hours a day. Some years ago, these services revolved around taking orders and fielding complaints by telephone. However more communications have appeared, such as email, person to person chat and other more advanced technologies (Tate and van der Valk, 2008).
The use of performance measures allows the organization to assess the implementation of its strategy. When designed and implemented carefully, the key performance indicators allow to know precisely where to take action in order to improve performance (Weber, 2005).
“The vision of the future (mission) must be supported by the how (strategy), the what (objectives), the focus areas (critical success factors), the metrics (KPIs) and the action plan (key action initiatives) to realize full actuation.” (Bauer, 2004)
2.3 Dashboards
The ever increasing amount of data available has become one of the main issues for managers. Therewith, it has emerged the need for a tool able to integrate the diverse systems of a company into a coherent picture of where the organization is heading and what needs to be done to improve its progress (Pauwels et al, 2009).
“A dashboard is a means of presenting information to decision-makers, with a focus on visual
communication, so that important information is consolidated and arranged on a screen in order to be easily monitored” (Few, 2006). It is expected to improve decision making by
amplifying cognition and capitalizing on human perceptual capabilities (Yigitbasioglu and Velcu, 2012).
Dashboards are expected to collect, summarize, and present information from multiple sources such as ERP and BI software, giving management a quick view of how various KPIs are performing (Yigitbasioglu and Velcu, 2012). After a quick review, management should be able to evaluate the performance of the organization and make decisions related to the results of the performance assessment (DeBusk et al, 2003). A dashboard can give the organization objective feedback on the outcomes achieved, which allows managers to work on the improvement of the drivers and processes (Wind, 2005). Moreover, dashboards allow organizations to incorporate various performance management concepts into only one solution, preventing data overload (Yigitbasioglu and Velcu, 2012).
A dashboard enforces consistency in measures and measurement procedures across department and business units, facilitating the standardization of metrics across them and gathering data that has never been gathered before. They help to monitor performance through the evaluation of current metrics and provide support to planning, as they are related to support systems that give management guidance on decisions. Furthermore, they facilitate communication to
important stakeholders about what the organization values as performance, by the choice of metrics on the dashboard (Pauwels et al, 2009).
The design features that a dashboard should have can divided into functional and visual. Functional features are related to what the dashboard can do, such as drill down capabilities, presentation flexibility, scenario analysis or automated alerts. The visual features refer to the visualization of data and how efficiently and effectively information is presented to senior management, such as single screen page or frugal use of colors. In combination, these help to improve cognition and interpretation (Yigitbasioglu and Velcu, 2012).
Regarding functional features, these should be adapted to the dashboard’s user characteristics, as a certain way to display information might not be the most appropriate for a specific user. Dashboards should be interactive, allowing users to drill down information so as to obtain further details on various performance indicators through a point and click interactivity. Therefore, it is highly recommended that the dashboard is fully integrated with the Online Analytical Processing system or data warehouse of an organization, so as to allow users to have full access to granular data for dimensional analysis. The presentation flexibility allows users to view data in different ways, slicing or filtering information. Scenario analysis provide managers a tool for planning. Finally, automated visual alerts help to identify measures that need immediate attention (through bright colors and/or flashing) when performance metrics go out of range (Yigitbasioglu and Velcu, 2012).
Visual features are key aspects when designing a dashboard. The visualization aspect helps users to assess the organization performance efficiently and effectively and make decisions according to it. It is commonly recommended that the data presented on a dashboard can fit and be arranged on a single screen. The use of colors to improve the process of visualization should be used carefully, since its excessive use can distract the user and may therefore have an adverse effect on decision making.
The information presented on a dashboard should be in line with its purposes. Unnecessary information should be eliminated, since it adds complexity and may impair cognition and the disregard of information. One must bear in mind the goal should be to improve and not complicate or bias perception. However, too few features can compromise its goals. Only selecting the right quantity of information and finding an optimal point is needed in order to make accurate decisions. A fit might be difficult to achieve as the exact goals of the dashboard might not be always known upfront, a good strategy will be to go with dashboard solutions that are more flexible and allow for easy upgrades (Yigitbasioglu and Velcu, 2012).
All in all, dashboards should be simple and effective in order to allow managers to assess performance and to enhance decision making based on the key metrics displayed. The features discussed above will help to provide managers a dashboard that will more easily serve their interests: “Properly created dashboards will provide the mechanism to drive effective
management and resource allocation decisions.” (Wind, 2005).
2.4 Kaizen - Continuous Improvement
Nowadays organizations are constantly challenged to deliver strategic capital assets within highly competitive marketplaces. Businesses need metrics and analytics to help them streamline their value generating operations. These metrics also provide tangible evidence and validation regarding the value generated for customers (España et al, 2012). In particular, given the specificities of the e-commerce luxury industry, it is necessary to guarantee the provision of an excellent customer service.
The need to operate more efficiently and effectively has led to the appearance of the Kaizen philosophy. The meaning of Kaizen is “change for the better” and more and more companies are adopting continuous improvement management systems. It is becoming a company strategy
dedicated to the continuous improvement of operations, a truly operational strategy based on
kaizen principles and tools (Coimbra, 2013).
It means gradual and continuous progress, increase of value, intensification and improvement (Karkoszka and Szewieczek, 2007). It is a carefully planned, structured event to improve a specific area of an organization in a quick and focused manner. Kaizen involves setting standards and then continually improving those standards (Isaacs and Hellenberg, 2009). However, Kaizen is much more than continuous improvement. Everyone within the organization should be involved in the processes optimization (Rocha, 2014). These methods bring together all the employees of the company, ensuring the improvement of the communication process and the reinforcement of the feeling of membership (Titu et al, 2010). Each and every person is stimulated to look for changes in its own work according to the motto: “everywhere”, “everybody”, “everyday Kaizen!” (Imai, 2012).
The existence of Kaizen supposes a commitment of the organization’s workers towards the change of the working daily habits, through a continuous and daily training and experimentation of new practices up to the moment the new process is proved to be more efficient and gets standardized.
According to Rocha (2014), a continuous improvement model should comprise 4 vectors: (i) Mission and objectives – each company must define its mission and strategic goals for the continuous improvement. (ii) Improvement tools – to improve the performance of the organization and achieve the proposed goals (iii) Change Management – development of innovation capabilities and the clear definition of the way and control for an effective organization; (iv) Fundamental elements – related to the creation of a clear perception of what is waste.
The three main Kaizen Improvement tools are the following:
Plan Do Check Act (PDCA)/Standardize Do Check Act (SDCA) cycles: iterative four-step management methods used in business for the control and continuous improvement of processes and products;
5S methodology: an approach for productivity, quality and safety improvement; 5S stands for the Japanese words seiri (tidiness), seiton (orderliness), seiso (cleanliness),
seiketsu (standardization) and shitsuke (discipline);
Daily Kaizen: it is currently used by Farfetch Customer Service Teams; it consists on a simple and short meeting (around 10 minutes) around a board in which information is exchanged. The topics discussed in this meeting should be presented in the form of KPIs selected according to the department needs, updated action plans and 5S audit results. The board should be located strategically, on the passageway and close to the workplace (Rocha, 2014).
It can take years and should be implemented everywhere, every day, and by everybody (Imai, 2012). If such a culture is achieved, it will from its inception deliver significant benefits to the company, and these will be sustained or increased over subsequent years (Coimbra, 2013).
3 Customer Service Overview
With the increase of the number of services provided by the Customer Service Department, particularly in terms of languages provided, the complexity of the customer support services is continuously growing. Adding to this, the rapid growth of Farfetch and the respective increase of orders naturally represent more contacts to be dealt by the Customer Service agents.
Due to the company luxury nature, it is fundamental to keep the service quality on an excellent level. More efficient and adequate methods for measuring and controlling the customer support service level became imperative. It is necessary to optimize the channels in order to align customers’ requirements with the resources available.
As a consequence of the ever increasing numbers and customer support services provided by Farfetch, the number of customer support agents, who directly interact with customers, has been subject to a year-on-year growth of more than 100%. In May 2015, there were 60 people spread over the three offices working at the Customer Service Department. The importance of having Customer Service Teams dispersed all over the world is related to two main reasons: the very different time zones around the globe and the availability of Customer Service agents, within regular working hours, speaking influential languages in terms of the market share of the company worldwide.
3.1 Customer Service Channels
The customer can contact Farfetch through three different channels, each with a different provider. The processes associated with each of these channels are described next.
3.1.1 E-mail/Contact Form
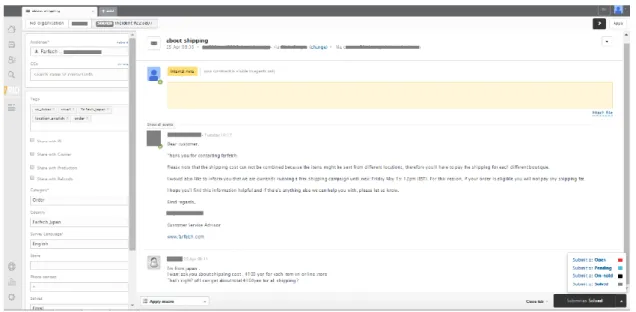
Every email or contact form filled in the website is received on the tickets platform, generating a new ticket. This new ticket will trigger an exchange of messages between either CS and customer (customers receive the messages in their inbox email accounts), CS and internal teams - Courier, Partner Services, Production, Order Support or Refunds Teams or CS and Partner Boutiques. The Farfetch contact form is shown on Figure 5.
The ticket categories, available on the contact form as “Query Type”, define the subject of the query. The categories available are the following: feedback, order, other, payment, product, returns, shipping, shopping, supplier and technical. These can either be filled by the customer, when the ticket is originated via contact form, or by the agent, when the ticket is originated via email or created by him/her.
Once a new ticket is responded, the agent fills in some mandatory fields (assignee, language and category, in case this one is still not filled in) and marks it with a tick in case it is to be shared with an internal team. At the end of the message, the ticket is submitted with a status according to its current stage of resolution. The interface can be seen on Figure 6.
Figure 6 - Tickets Platform Interface
When accessing the platform, each CS agent is able to check his/her assigned tickets in backlog and the new tickets not assigned to any agent.
Figure 7 - Tickets Platform Interface - Backlog Tickets
A ticket may be in different statuses from the moment that it is created up to the moment that it is completely resolved and the exchange of messages ends. The different ticket statuses are explained in detail:
New: a ticket not assigned to any agent and, consequently, without an answer from a CS agent;
Pending: a backlog ticket assigned to an agent and not solved because the agent is waiting for the sender answer;
On-Hold: a backlog ticket assigned to an agent and not solved because he/she is waiting for an internal answer in order to be able to answer the sender;
Solved: a ticket that is expected to have the exchange of messages ended since the situation is resolved;
Open: a backlog ticket assigned to an agent, waiting for his/her action. These tickets represent the issues being worked on;
Closed: a ticket that keeps its status as solved for more than 30 days becomes automatically closed. From this moment on, it is not possible to exchange messages through this ticket.
Although Courier, Partner Services and Production Teams have their ticket accounts, the Customer Service account is shared with Order Support and Refunds Teams. The account concept is important as a ticket shared between two distinct accounts does not have mandatorily the same status in both. Furthermore, the ticket ID (related to the ticket reference) is also different. The statuses mentioned further in this dissertation refer to the CS account.
3.1.2 Phone Calls
The phone calls provider records all the data related to calls, whether inbound or outbound. Inbound calls take place when customers call Farfetch through the phone number available on the website. In contrast, outbound calls are the ones when a CS agent calls the customer, in cases when the contact is requested to clarify a query.
Farfetch provides a specific version of the website containing, among other features, a specific phone number, according to the customer’s IP Address region. By associating a version of the website to a specific language and phone line, it is possible to have the right agents available for the right phone lines at the right times.
An example of the phone number displayed on the website is represented on Figure 8.
Figure 8 - Phone Number presented on the website
The hours presented on Figure 8 are related to the times when Farfetch promises to have agents available to answer phone calls. Before this project, Farfetch used to promise agents available at hours when there were no agents connected for such languages and phone lines in the offices. In order to manage customers’ expectations, it is vital to assure that the process of allocating personnel takes into account the promises mentioned online, adjusting either the online information or the hours covered by agents on duty. With this work, the hours displayed on the portal have been redefined and the agents are currently being allocated accordingly.
3.1.3 Chat
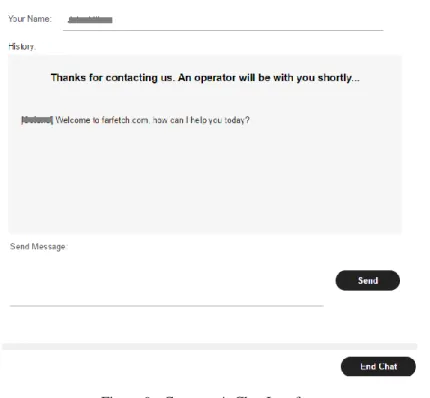
With chat, Farfetch is able to offer a written real time support channel. Customers can find the chat button through the various contact points on the portal and, clicking on it, a pop up window opens. In case agents are available, the conversation customer–agent starts. CS agents answer these chats on the provider’s platform, which allows to keep a history of previous chats messages as well as metrics such as agent, duration or chat status.
Unlike phone calls, the provider does not allow the identification of the customer region and a chat can be answered by any available agent. The chat interface as seen by the customer is represented on Figure 9.
Figure 9 - Customer's Chat Interface
A chat may have one of the following statuses, as defined by the provider:
Unavailable: an attempt by a visitor to initiate a chat when no agents are available; Abandoned: a chat click by a customer that abandons it before the chat starts; Blocked: a visitor whose IP Address is blocked to access Farfetch chat;
Unanswered: a chat not responded by an agent, when at least one of them was available;
Answered: a chat responded by an agent.
Like phone calls, each chat answered generates a new manually created ticket with the same purpose than the ones created by phone calls.
3.2 Former Reporting Methods
Before this project, Customer Service metrics were reported weekly for executives and team managers and daily, only through ticket metrics, for team managers, supervisors and agents, on the Daily Kaizen Team meetings. However, most of the metrics used were not being correctly calculated, giving a wrong perception of the service level.
Moreover, the level of detail of the former reporting methods did not meet current requirements. Executives and Customer Service managers did not have sufficient reporting methods to be able to manage appropriately the customer relationship and increase the level of service provided, according to the target quality levels required by the e-commerce luxury industry.
3.2.1 Former Executive Weekly Report
The metrics available in the original weekly reports were calculated in Structured Query Language (SQL), which was possible due to the providers’ integrations with SQL Server
Management Studio. They allow to have all the data related to the three providers on Farfetch
databases and easily select and manipulate the desired information. The indicators were classified in four different categories: General Metrics, Tickets, Calls and Chats.
General Metrics
The KPIs related to general metrics are also relevant for other Farfetch departments apart from the Customer Service. They show how well the company is performing in various areas, such as technology or operations. The metrics in use were the following:
Total Contacts: The total number of contacts was calculated based on the sum of the number of tickets created, the number of chats answered and the number of calls answered (inbound or outbound). As such, this metric failed for combining contacts solved (chats and calls answered) and contacts created (tickets not mandatorily solved). Total contacts was calculated as follows:
𝑇𝑜𝑡𝑎𝑙 𝐶𝑜𝑛𝑡𝑎𝑐𝑡𝑠 = ∑ 𝑇𝑖𝑐𝑘𝑒𝑡𝑠 𝐶𝑟𝑒𝑎𝑡𝑒𝑑 + ∑ 𝐶ℎ𝑎𝑡𝑠 𝐴𝑛𝑠𝑤𝑒𝑟𝑒𝑑 + ∑ 𝐶𝑎𝑙𝑙𝑠
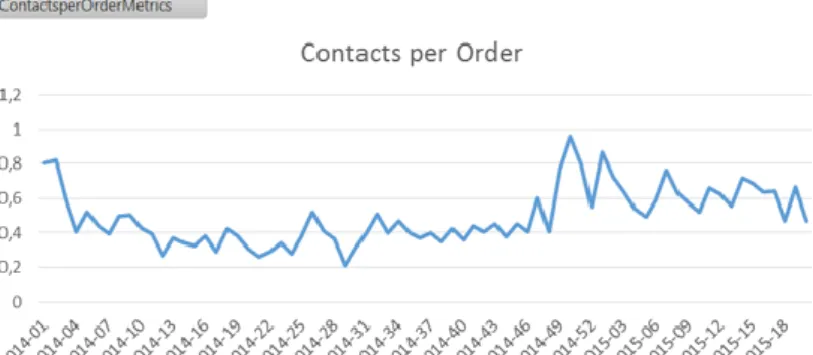
Contacts per Order: The Contacts per Order was calculated as the Total Contacts, above explained, over the Number of Orders, for the same period of time. The formula is represented below:
𝐶𝑜𝑛𝑡𝑎𝑐𝑡𝑠 𝑝𝑒𝑟 𝑂𝑟𝑑𝑒𝑟 =∑ 𝑇𝑖𝑐𝑘𝑒𝑡𝑠 𝐶𝑟𝑒𝑎𝑡𝑒𝑑 + ∑ 𝐶ℎ𝑎𝑡𝑠 𝐴𝑛𝑠𝑤𝑒𝑟𝑒𝑑 + ∑ 𝐶𝑎𝑙𝑙𝑠 ∑ 𝑂𝑟𝑑𝑒𝑟𝑠
Net Promoter Score (NPS): The Net Promoter Score is a management tool metric to measure customer loyalty and it is based on the satisfaction of the customer after completing a purchase. After receiving the purchase, the customer receives an email with a form containing 2 questions about how likely the customer would be to recommend both Farfetch and Boutique in a 0-10 scale (0 for not likely at all and 10 for extremely likely). The first question is used to calculate NPS Farfetch, as follows:
𝑁𝑃𝑆 = % 𝑃𝑟𝑜𝑚𝑜𝑡𝑒𝑟𝑠 − % 𝐷𝑒𝑡𝑟𝑎𝑐𝑡𝑜𝑟𝑠
Answers between 0 and 6 represent a “Detractor”, 7 and 8 represent a “Passive” and 9 and 10 represent a “Promoter”. The main goal of NPS Farfetch indicator is to minimize the number of Detractors.
Tickets
The KPIs related to tickets included the results from Order Support and Refunds Teams. Besides this, they also included tickets created by agents, associated to the tickets created to follow up chats and calls conversations. These contacts will be counted on chats and calls metrics and, for this reason, should be excluded from the tickets calculations.
According to Tate and van der Valk (2008), most of these KPIs are related to Operational Efficiency, with the exception of the Percentage of Tickets Replied in SLA (<8h), which is related to Service Quality, and the Satisfaction Rating, which is related to Customer Satisfaction. The KPIs were the following:
Tickets Solved as a % of Created Tickets: This metric was calculated as the ratio between the number of tickets solved and the tickets created within the selected week, as follows:
𝑇𝑖𝑐𝑘𝑒𝑡𝑠 𝑆𝑜𝑙𝑣𝑒𝑑 𝑎𝑠 𝑎 % 𝑜𝑓 𝐶𝑟𝑒𝑎𝑡𝑒𝑑 𝑇𝑖𝑐𝑘𝑒𝑡𝑠 = 𝑇𝑖𝑐𝑘𝑒𝑡𝑠 𝑆𝑜𝑙𝑣𝑒𝑑
Based on this metric, it is not evident the number of tickets solved and created. Due to the reduced relevance of this percentage, this indicator was not included in the new report.
% Tickets Replied in SLA (<8h): The Service Level Agreement (SLA) has been defined as to respond to 80% of the tickets in less than 8 hours. This KPI was calculated as the ratio between the tickets replied in less than 8 hours and the total tickets replied, as follows:
% 𝑇𝑖𝑐𝑘𝑒𝑡𝑠 𝑅𝑒𝑝𝑙𝑖𝑒𝑑 𝑖𝑛 𝑆𝐿𝐴 (< 8ℎ) =𝑇𝑖𝑐𝑘𝑒𝑡𝑠 𝑅𝑒𝑝𝑙𝑖𝑒𝑑 𝑖𝑛 𝑆𝐿𝐴 (< 8ℎ)
𝑇𝑖𝑐𝑘𝑒𝑡𝑠 𝑅𝑒𝑝𝑙𝑖𝑒𝑑 𝑥 100%
% One Touch Tickets: These tickets represent the tickets solved at the first time the agent went over the ticket, representing a service quality metric. This metric was calculated as the ratio between the tickets solved with 0 or 1 replies and the total tickets solved.
% 𝑂𝑛𝑒 𝑇𝑜𝑢𝑐ℎ 𝑇𝑖𝑐𝑘𝑒𝑡𝑠 =𝑇𝑖𝑐𝑘𝑒𝑡𝑠 𝑆𝑜𝑙𝑣𝑒𝑑 𝑖𝑛 𝑂𝑛𝑒 𝑇𝑜𝑢𝑐ℎ
𝑇𝑖𝑐𝑘𝑒𝑡𝑠 𝑆𝑜𝑙𝑣𝑒𝑑 𝑥 100%
% Tickets Solved in One Hour: This metric represents the ratio between the tickets that have been resolved in less than one hour - from the moment of creation to the moment of resolution - and the total tickets solved. The formula was the following:
% 𝑇𝑖𝑐𝑘𝑒𝑡𝑠 𝑆𝑜𝑙𝑣𝑒𝑑 𝑖𝑛 𝑂𝑛𝑒 𝐻𝑜𝑢𝑟 =𝑇𝑖𝑐𝑘𝑒𝑡𝑠 𝑆𝑜𝑙𝑣𝑒𝑑 𝑖𝑛 𝑂𝑛𝑒 𝐻𝑜𝑢𝑟
𝑇𝑖𝑐𝑘𝑒𝑡𝑠 𝑆𝑜𝑙𝑣𝑒𝑑 𝑥 100%
Once this does not constitute an established target and due to the value of this ratio, this metric was not considered relevant. As thus, it was excluded from the new report.
Satisfaction Rating: After a ticket is solved for the first time by the agent, the customer automatically receives an email containing a form to give feedback to the support service as “good” or “bad”. This metric was calculated as the ratio between the “good” reviews and the total reviews. It was calculated as follows:
𝑆𝑎𝑡𝑖𝑠𝑓𝑎𝑐𝑡𝑖𝑜𝑛 𝑅𝑎𝑡𝑖𝑛𝑔 =𝑇𝑖𝑐𝑘𝑒𝑡𝑠 "𝑔𝑜𝑜𝑑" 𝑅𝑒𝑣𝑖𝑒𝑤𝑒𝑑
𝑇𝑖𝑐𝑘𝑒𝑡𝑠 𝑅𝑒𝑣𝑖𝑒𝑤𝑒𝑑 𝑥 100%
Average Full Resolution Time (Hours): The full resolution time represents the time spent from the moment of creation to the moment of resolution of a ticket. The average full resolution time was calculated as the ratio between the sum of the full resolution times of the Tickets Solved and the total Tickets Solved, as follows:
𝐴𝑣𝑒𝑟𝑎𝑔𝑒 𝐹𝑢𝑙𝑙 𝑅𝑒𝑠𝑜𝑙𝑢𝑡𝑖𝑜𝑛 𝑇𝑖𝑚𝑒 (ℎ𝑜𝑢𝑟𝑠) =∑ 𝐹𝑢𝑙𝑙 𝑅𝑒𝑠𝑜𝑙𝑢𝑡𝑖𝑜𝑛 𝑇𝑖𝑚𝑒 𝑇𝑖𝑐𝑘𝑒𝑡𝑠 𝑆𝑜𝑙𝑣𝑒𝑑 𝑇𝑖𝑐𝑘𝑒𝑡𝑠 𝑆𝑜𝑙𝑣𝑒𝑑
% Ticket Categories: The unique breakdown by category was related to the percentage that each one of them represented in terms of the number of Tickets Solved. This breakdown give an idea of the type of queries more and less solicited. It was calculated as follows:
% 𝑇𝑖𝑐𝑘𝑒𝑡 𝐶𝑎𝑡𝑒𝑔𝑜𝑟𝑖𝑒𝑠 =𝑇𝑖𝑐𝑘𝑒𝑡𝑠 𝑆𝑜𝑙𝑣𝑒𝑑 (𝐶𝑎𝑡𝑒𝑔𝑜𝑟𝑦 𝑥)
Calls
The metrics related to calls were only reported on a weekly basis, every Monday. All the measures referred to Operational Efficiency aspects, and were the following:
Total Calls: This metric was calculated as the sum of the calls, inbound or outbound, answered or not answered. The formula was calculated as follows:
𝑇𝑜𝑡𝑎𝑙 𝐶𝑎𝑙𝑙𝑠 = ∑ 𝐶𝑎𝑙𝑙𝑠
Total Calls Inbound: This metric was calculated as the sum of the calls received by agents. It was calculated as:
𝑇𝑜𝑡𝑎𝑙 𝐶𝑎𝑙𝑙𝑠 𝐼𝑛𝑏𝑜𝑢𝑛𝑑 = ∑ 𝐶𝑎𝑙𝑙𝑠 (𝐶𝑎𝑙𝑙𝐷𝑖𝑟𝑒𝑐𝑡𝑖𝑜𝑛 = 𝐼𝑛𝑏𝑜𝑢𝑛𝑑)
Total Calls Outbound: The total calls outbound was calculated as the sum of the calls made by agents, when the contact to the customer was required. The formula was represented as follows:
𝑇𝑜𝑡𝑎𝑙 𝐶𝑎𝑙𝑙𝑠 𝑂𝑢𝑡𝑏𝑜𝑢𝑛𝑑 = ∑ 𝐶𝑎𝑙𝑙𝑠 (𝐶𝑎𝑙𝑙𝐷𝑖𝑟𝑒𝑐𝑡𝑖𝑜𝑛 = 𝑂𝑢𝑡𝑏𝑜𝑢𝑛𝑑)
% Calls Answered: This percentage was calculated as the ratio between the calls answered, either inbound or outbound, and the total calls, as follows:
% 𝐶𝑎𝑙𝑙𝑠 𝐴𝑛𝑠𝑤𝑒𝑟𝑒𝑑 =∑ 𝐶𝑎𝑙𝑙𝑠 (𝐶𝑎𝑙𝑙𝐶𝑜𝑛𝑛𝑒𝑐𝑡𝑒𝑑 = 𝑌𝑒𝑠)∑ 𝐶𝑎𝑙𝑙𝑠
Average Call Duration: The average call duration was calculated as the ratio between the sum of the calls answered durations and the total calls answered.
𝐴𝑣𝑒𝑟𝑎𝑔𝑒 𝐶𝑎𝑙𝑙 𝐷𝑢𝑟𝑎𝑡𝑖𝑜𝑛 =∑ 𝐶𝑎𝑙𝑙𝑠 𝐷𝑢𝑟𝑎𝑡𝑖𝑜𝑛 (𝐶𝑎𝑙𝑙𝐶𝑜𝑛𝑛𝑒𝑐𝑡𝑒𝑑 = 𝑌𝑒𝑠) ∑ 𝐶𝑎𝑙𝑙𝑠 (𝐶𝑎𝑙𝑙𝐶𝑜𝑛𝑛𝑒𝑐𝑡𝑒𝑑 = 𝑌𝑒𝑠)
Due to their different purposes, it is not desirable to aggregate both inbound and outbound calls for KPIs calculations, such as the % Calls Answered. Furthermore, outbound calls, answered or not answered, do not depend on the performance of the agents. For these reasons, it does not make sense to aggregate the two different types of calls.
Additionally, and similarly to tickets, Order Support and Refunds Teams results were being included on these metrics and, therefore, distorting actual CS results.
Taking into account that there are various phone lines, with different workloads and trends associated, it will be important to have means available to measure and control each one of them. Therefore, with the design of a tool that allows this type of refinement, it should be possible to improve the process of the alignment of resources.
Chats
Regarding chats, there were only three metrics available, all related to Operational Efficiency aspects. Similarly to calls, these indicators were only reported on a weekly basis, so it was impossible to evaluate the performance of the customer support provided on this channel in a shorter term. The metrics were the following:
Total Clicks: The total clicks represented the total customers’ attempts to start a chat, regardless of being answered or not. This KPI was calculated as follows:
𝑇𝑜𝑡𝑎𝑙 𝐶𝑙𝑖𝑐𝑘𝑠 = ∑ 𝐶𝑙𝑖𝑐𝑘𝑠
Total Chats Answered: This KPI represented the total chats that had been answered. It was represented as:
𝑇𝑜𝑡𝑎𝑙 𝐶ℎ𝑎𝑡𝑠 𝐴𝑛𝑠𝑤𝑒𝑟𝑒𝑑 = ∑ 𝐶ℎ𝑎𝑡𝑠 𝐴𝑛𝑠𝑤𝑒𝑟𝑒𝑑
% Chats Answered: This metric was calculated as the ratio between chats answered and total clicks. The formula was represented as follows:
% 𝐶ℎ𝑎𝑡𝑠 𝐴𝑛𝑠𝑤𝑒𝑟𝑒𝑑 =∑ 𝐶ℎ𝑎𝑡𝑠 𝐴𝑛𝑠𝑤𝑒𝑟𝑒𝑑∑ 𝐶𝑙𝑖𝑐𝑘𝑠 𝑥 100%
Based on these metrics, it was not possible to understand the reasons for having unanswered chats. One chat not answered may occur for three reasons: no agents at the office, no agents answering chats or agents busy chatting with other customers.
The only way that top management had to assess performance was through this report. It was not possible to assess daily results, as there was not available a visual tool (such as a dashboard) computed on a daily basis. Furthermore, these indicators were not divided by teams, so the values presented could not provide information of the workload for each CS team. For that reason, it was difficult to develop enhanced methods for resource allocation.
3.2.2 Former Daily Team Reporting
For the Daily Kaizen Team meetings, attended by team managers, supervisors and agents, the results were extracted by team managers or supervisors from the BI software platform integrated with the tickets provider. The metrics evaluated on the daily meetings, within each team, were only related to tickets. These ones were written on a board and discussed at the meetings.
The KPIs reported were the following:
Solved Tickets: total tickets solved by the team;
Assigned Tickets: total tickets previously “New” assigned to the team;
Tickets Replied in SLA (<8h): total tickets replied in SLA by the team,, based on tickets created;
Satisfaction Rate: the percentage of tickets “good” reviewed over the total tickets reviewed solved by the team;
New Tickets: number of new tickets not assigned to any agent;
Assigned Tickets in Backlog: number of assigned tickets in backlog (open, pending and on-hold) by the team.
According to Tate and van der Valk (2008), these KPIs cover the following areas: Operational Efficiency (Solved Tickets, Assigned Tickets, New Tickets and Assigned Tickets in Backlog), Customer Satisfaction (Satisfaction Rate) and Service Quality (Tickets Replied in SLA). Team numbers were posteriorly compared to the global numbers in order to have an idea of the percentages that each team represented in terms of results achieved. Once again, the global numbers included the results for Order Support and Refunds teams, which were distorting CS metrics.
Daily Kaizen meetings were the only way for agents and supervisors to know their teams’ performances. There was not a comparison between teams (only team vs. global and distorted by other teams results) or between agents. Apart from this, the metrics were uniquely related to tickets. There was the need for a tool that allowed the gathering of information in a single solution and the visualization of data through various refinements. With this type of tool, it would be possible to take actions based on alerts whenever results present eminent or existing problems.
3.3 Conclusions
The first issue found on the previous reporting was the inaccuracy of the data presented on both Executive Weekly Report and Daily Team meetings. It is crucial to have the right information when looking at KPIs. The measurement of the wrong KPIs, as well as their wrong calculations, can result in counter-productive behavior.
The metrics available were not enough to address the current Customer Service needs. Both the Executive Weekly Report and the Daily Team metrics did not allow an immediate evaluation of performance. Furthermore, the information was very limited for the different players involved in the Customer Service. Executives did not have available a visual tool and the performance was only reported on a weekly basis. Moreover, data refinements, such as results per team, were not possible for team managers. Agents and supervisors only had available distorted daily ticket results. It was not possible to assess individual performances and the KPIs measured were insufficient for the type of analysis required at the Daily Kaizen Team meetings. After the analysis of the existing KPIs, it was not easy to understand what actually took place in each of the channels. Given that, there was the clear need to improve the performance evaluation, both in terms of KPIs and presentation methods. It was necessary the identification and measurement of complementary performance indicators to give a more comprehensive view of performance in each one of the channels and the development of methods of presentation with multiple refinement options. These developments should allow the improvement of performance of the Customer Service Department at all levels, particularly in terms of Operational Efficiency, Service Level and Customer Satisfaction.