The use of multivariate analysis to characterize carcass and meat
quality of goat kids protected by the PGI
“Cabrito de Barroso”
V.A.C. Santos
⁎
, J.A. Silva, A.M.D. Silvestre, S.R. Silva, J.M.T. Azevedo
CECAV– University of Trás-os-Montes and Alto Douro, Apartado 1013, 5001-801 Vila Real, PortugalReceived 20 November 2006; received in revised form 15 June 2007; accepted 22 August 2007
Abstract
Fifty five suckling kids from three genotypes and two sexes protected by the PGI
“Cabrito de Barroso” European quality label
were used in this experiment. Carcass quality was assessed using indices from carcass measurements, dressing percentages,
refrigerated losses, higher priced joints proportion and tissue composition of the carcass. Meat pH, colour, total pigment, fat, dry
matter, collagen determinations (total and soluble), cooking losses and shear force estimated in longissimus thoracis et lumborum
(LTL) and gluteobiceps (GB) muscles were used to characterize meat quality. Principal component (PC) analysis was performed in
order to examine carcass quality traits (n = 16) and meat quality (n = 16) traits. The five first principal components (PCs) explained
about 86% of the total variability for carcass quality and 75% of the total variability for meat quality. Compactness indices of
carcass and leg, carcass weight and subcutaneous fat were the most effective variables for the PC1, whereas the higher priced joints
proportion, muscle proportions of the higher priced joints and of the carcass and the muscle and bone ratio were useful to define the
PC2. The first PC of the meat quality parameters was characterized by colour traits (L⁎, b⁎, a⁎, C⁎, H⁎ and total pigment) whereas
collagen determinations (total collagen and collagen solubility) defined the second PC. When the carcass quality data were
projected on the plane defined by the first two PCs, two separate groups of points appeared, corresponding to the animals with
slaughter live weight higher or lower than 10 kg. The distribution of the meat quality data on the plane defined by the first two PCs
allowed the identification of two separate groups, corresponding to the muscles GB and LTL. The differences between genotypes
tend to be small and related to slaughter live weight, which implies certain constancy in carcass and meat quality of the PGI
“Cabrito de Barroso”.
© 2007 Elsevier B.V. All rights reserved.
Keywords: Goat kids; Principal component analysis; Carcass; Meat quality
1. Introduction
Carcass characteristics and meat quality of goats can
be affected by genotype (
Dhanda et al., 1999a,b; Oman
et al., 2000
), sex (
Hogg et al., 1992; Todaro et al., 2004
),
diet and production system (
Johnson and McGowan,
1998; Marinova et al., 2001
) and weight at slaughter
(
Marichal et al., 2003
). Nevertheless other factors could
influence meat quality such as pre-slaughter treatment,
carcass chilling, muscle type or ageing time (
Kadim et al.,
2003; Webb et al., 2005
). European meat quality labels,
such as
“Cabrito de Barroso”-PGI, have a recognized
value that should be validated by scientific studies.
“Cabrito de Barroso”-PGI is produced in the “Barroso”
region (North of Portugal) by a traditional method but
Livestock Science 116 (2008) 70–81
www.elsevier.com/locate/livsci
⁎ Corresponding author. Tel.: +351 259350430; fax: +351 259350482.
E-mail address:[email protected](V.A.C. Santos).
1871-1413/$ - see front matter © 2007 Elsevier B.V. All rights reserved. doi:10.1016/j.livsci.2007.08.016
following precise specifications. Carcasses from this PGI
must weight from 4 to 6 kg, be obtained from male and
female kids up to three months of age, raised on pasture
with their mothers in the Barroso highlands, and
belonging to the local Serrana (S) and Bravia (B) goat
breeds or their crossbreeds (S×B). Studies on goats to
characterize carcass quality have mostly focused on
carcass evaluation, with objective or subjective
measure-ments, and tissue carcass distribution (
Oman et al., 2000;
Cameron et al., 2001; Marinova et al., 2001; Marichal
et al., 2003; Sen et al., 2004; Kadim et al., 2003
) at a fixed
slaughter live weight or at variable slaughter live weight.
Studies on goat meat quality are usually based on pH,
objective tenderness and colour measurements, chemical
composition and sensorial analysis (
Marinova et al., 2001;
Sen et al., 2004; Kadim et al., 2003
) and more recently on
muscle fibre population (
Marichal et al., 2003
). To assess
carcass and meat quality several related traits are
considered.
Karlsson (1992)
proposed the use of principal
component (PC) analysis for evaluating meat quality
when several correlated measurements are used. This
multivariate statistical technique is used to find a smaller
set of measurements explaining most of the observed
variability in the measurements taken, but also helps in
examining the relationships between traits and the
differences between the groups of animals compared
(
Hernández et al., 2000
). PC analysis has been used before
to describe carcass characteristics (
Laville et al., 1996;
Hernández et al., 2000; Cañeque et al., 2004
) and meat
quality (
Karlsson, 1992; Næs et al., 1996; Hernández
et al., 1997; Hernández et al., 1998, 2000; Destefanis
et al., 2000; Albertí et al., 2005; Cañeque et al., 2004
) of
several species and seems to be a very useful tool to
visualize and interpret the data. Furthermore, other
multivariate statistical methodologies, such as
discrimi-nant analysis (DA) can also be suitable (
Moreno et al.,
2006; Oliete et al., 2006
). Discriminant analysis is a
supervised classification tool used to differentiate groups
of samples as a function of one of several combinations of
experimental variables (
Brito et al., 2006
). The objective
of this paper is to analyse carcass and meat quality of goat
kids protected by the PGI
“Cabrito de Barroso” applying
multivariate analysis.
2. Material and methods
Animal handling followed the EU directive number 86/
609/EEC concerning animal care.
2.1. Animals
Data on fifty five suckling kids (28 males and 27 females)
of three genotypes (18 B, 19 S and 18 crossbred S×B)
slaughtered at a range of live weight between 7 and 13 kg (21–
27% of mature live weight) were analysed. The kids came
from several farms and were produced according to
“Cabrito
de Barroso-PGI” specifications. The selection of kids was
done regardless of birth type. When very young, the kids were
penned at the farm during the first two weeks, while their dams
spent the day at pasture. After this period, kids were naturally
suckled and left to graze with their dams.
2.2. Carcass characteristics
The slaughter and carcass dressing were performed
following the methods of
Colomer-Rocher et al. (1987)
.
Table 1Mean, standard deviation (SD) and coefficient of variation (CV) of the carcass quality measurements
Variables Mean SD CV (%)
Hot carcass weight (HCW), kg 5.08 1.10 21.7 Dressing percentage (DP1), % 50.49 2.53 5.0 Dressing percentage2 (DP2), % 56.10 2.14 3.8 Refrigerated losses (RL), % 5.45 2.42 44.3 Carcass compactness index (CC) 0.11 0.02 16.7 Buttock/leg index (B/Lg) 0.56 0.07 11.8 Chest roundness index (ChR) 0.60 0.06 10.4 Leg compactness index (LgC) 22.89 3.89 17.0 Higher priced joints (HPJ), % 43.92 1.17 2.7 Muscle higher priced joints (MHPJ), % 47.23 1.16 2.5
Muscle (M), % 64.81 2.71 4.2
Subcutaneous fat (SF), % 4.07 1.15 28.4 Intermuscular fat (InterF), % 8.75 2.55 29.2
Bone (B), % 20.96 1.36 6.5
Muscle:bone ratio (M:B) 3.10 0.22 7.1 Subcutaneous:muscle ratio (SF:M) 0.06 0.02 31.4 Dressing percentage1 (SLW basis).
Dressing percentage2 (ELW basis).
Table 2
Mean, standard deviation (SD) and coefficient of variation (CV) of the meat quality measurements
Variables Mean SD CV (%) pH1 6.54 0.24 3.7 pH24 5.76 0.19 3.3 T1 (°C) 25.94 3.65 14.1 T24 (°C) 4.98 1.13 22.7 Lightness (L⁎) 47.33 4.27 9.0 Redness (a⁎) 16.95 1.77 10.5 Yellowness (b⁎) 5.17 0.89 17.3 Chromaticity (C⁎) 17.84 1.61 9.0 Hue (H⁎) 18.89 4.72 25.0 Dry matter (DM), % 23.60 0.71 3.0
Intramuscular fat (IntraF), %DM 4.41 2.12 48.1 Cooking loss (CL), % 11.13 3.04 27.4 Shear force (SF), kg/cm2 7.74 2.32 29.9 Total pigment (Pigm), mg/g 1.13 0.39 34.6 Collagen solubility (CS), %total 7.77 2.22 28.6 Total collagen (TC), %DM 2.78 0.87 31.4
Carcasses were refrigerated for 24 h at 4 °C. The hot and cold
carcass weights (HCW and CCW, respectively) were recorded
and the refrigeration losses were calculated. The following
carcass conformation measurements were taken: Carcass
width (Wr: widest carcass measurement at the ribs), thoracic
depth (Th: maximum distance between the sternum and the
back of the carcass at the sixth thoracic vertebra), buttock
width (G: widest buttock measurement in a horizontal plane on
the hanging carcass), hind limb length (F: length from
perineum to distal edge of the tarsus) and internal carcass
length (L: length from cranial edge of the symphysis pelvis to
the cranial edge of the first rib). The indices from these carcass
conformation measurements: chest roundness index (Wr/Th),
buttock/leg index (G/F), carcass compactness (CCW/L) and
leg compactness (leg weight/F) were calculated (
Fisher and de
Boer, 1994; Velasco et al., 2000; Cañeque et al., 2004
). The
carcasses were split down the dorsal midline and the kidney
knob and channel fat (KKCF) from the right-half carcass was
weighed. The left side was joined into eight standardized
commercial joints as outlined by
Santos-Silva et al. (2002)
for
lamb carcasses. After weighing, each joint was separated into
dissectible muscle, bone, fat (subcutaneous and intermuscular
fat depots were registered separately) and the remainder (major
blood vessels, ligaments, tendons and thick connective tissue
sheets associated with some muscles) in a dissection room
under controlled environment.
Table 3
Correlations coefficients (r) between the carcass quality measurements
HCW DP1 DP2 CL CC B/Lg ChR LgC HPJ MHPJ M SF InterF B M:B DP1 0.50 DP2 0.49 0.85 CL −0.53 −0.42 −0.41 CC 0.96 0.53 0.54 −0.56 B/Lg 0.13 0.16 0.20 −0.05 0.23 ChR −0.14 −0.16 −0.08 0.41 −0.09 0.41 LgC 0.93 0.47 0.53 −0.46 0.93 0.33 0.02 HPJ −0.10 −0.05 0.07 0.07 −0.02 0.33 0.25 0.09 MHPJ −0.08 −0.01 0.05 0.04 0.00 0.24 0.18 0.09 0.86 M −0.12 −0.14 0.00 0.15 −0.14 0.04 0.15 −0.01 0.51 0.18 SF 0.40 0.34 0.31 −0.18 0.46 0.35 0.13 0.43 −0.10 0.22 −0.67 InterF 0.19 0.19 0.05 −0.15 0.19 −0.06 −0.17 0.09 −0.35 0.01 −0.89 0.65 B −0.40 −0.24 −0.27 0.17 −0.43 −0.17 −0.11 −0.45 −0.28 −0.50 0.15 −0.59 −0.48 M:B 0.31 0.13 0.24 −0.07 0.32 0.19 0.19 0.42 0.55 0.57 0.44 0.15 −0.07 −0.82 SF:M 0.38 0.32 0.27 −0.18 0.44 0.31 0.10 0.39 −0.15 0.18 −0.74 0.99 0.71 −0.56 0.08 HCW, hot carcass weight; DP1, dressing percentage1; DP2, dressing percentage2; RL, refrigerated losses; CC, carcass compactness index; B/Lg, buttock/leg index; ChR, chest roundness index; LgC, leg compactness index; HPJ, higher priced joints; MHPJ, muscle higher priced joints; M, muscle; SF, subcutaneous fat; InterF, intermuscular fat; B, bone; M:B, muscle:bone ratio; SF:M, subcutaneous:muscle ratio.
Table 4
Correlations coefficients (r) between the meat quality measurements
pH1 pH24 T1 T24 L⁎ a⁎ b⁎ C⁎ H⁎ DM IntraF CL SF Pigm CS
pH24 0.34 T1 −0.15 0.12 T24 −0.08 −0.35 0.01 L⁎ −0.38 −0.27 0.18 0.09 a⁎ 0.37 0.16 −0.20 −0.06 −0.88 b⁎ −0.06 −0.08 −0.11 −0.01 0.68 −0.44 C⁎ 0.37 0.15 −0.23 −0.07 −0.80 0.98 −0.27 H⁎ −0.25 −0.13 0.02 −0.01 0.88 −0.79 0.89 −0.66 DM −0.05 −0.21 −0.18 −0.11 −0.12 −0.01 −0.07 −0.02 −0.02 IntraF −0.03 0.21 0.28 −0.30 0.19 −0.11 0.24 −0.07 0.23 0.20 CL −0.11 −0.51 −0.22 0.09 0.18 −0.03 0.20 0.00 0.13 0.27 0.06 SF 0.26 −0.05 0.21 −0.09 0.09 −0.01 0.19 0.02 0.12 −0.10 0.13 0.25 Pigm 0.28 0.30 −0.13 −0.11 −0.85 0.80 −0.55 0.75 −0.74 0.11 −0.03 −0.15 −0.10 CS −0.12 −0.21 −0.23 0.18 −0.01 −0.08 −0.14 −0.11 −0.07 0.12 −0.24 0.09 −0.17 −0.11 TC 0.18 0.41 0.29 −0.14 0.04 0.08 0.24 0.14 0.11 −0.50 0.29 −0.20 0.32 0.03 −0.33 pH1, pH measured at 1 h after slaughter; pH24, pH measured at 24 h after slaughter; T1, temperature measured 1 h after slaughter; T24, temperature measured 24 h after slaughter; L⁎, a⁎, b⁎, chroma-meter values; C⁎, chromaticity; H⁎, hue; DM, dry matter; IntraF, Intramuscular fat; CL, cooking loss; SF, shear force; Pigm, total pigment; CS, collagen solubility; TC, total collagen.
2.3. Muscle sampling
Samples of longissimus thoracis et lumborum (LTL) and
gluteobiceps (GB) muscles were taken 24 h after slaughter,
from the loin and leg, respectively, when carcass left halves
were partitioned into commercial joints. Sub-samples of LTL
were taken for colour and intramuscular fat (4th to final lumbar
vertebra) analysis. Sub-samples of GB (medial portion) were
taken for the same analyses. At the same time, carcass right
LTL, between the 8th rib and 5th lumbar vertebra and the GB
(total) muscles were excised and divided into three parts. One
part of the muscle was vacuum packed and aged at 2 ± 2 °C for
5 days post-mortem for cooking losses and tenderness
objective determinations. After epimysium removal, the
remaining portions were cut and frozen at
−18 °C until
collagen and pigmentation determinations.
2.4. Meat quality measurements
The initial pH and temperature (pH1 and T1) and ultimate pH
and temperature (pH24 and T24) were evaluated at 1 h and 24 h
after slaughter, respectively. These traits were measured directly in
LTL (4/5th lumbar vertebra) and GB muscles (distal part) of the
carcass' left side using a combined glass electrode with a pH-meter
(Crison 2002). The colour was measured on LTL and GB muscles
surface immediately after cutting at the same site as pH. The meat
colour was assessed using the L⁎ (lightness) a⁎ (redness) b⁎
(yellowness) system by a chromo-meter (Minolta 310), which
gives the average of three measurements. The colorimetric indices
of chromaticity (C⁎ = (a⁎
2+b⁎
2)
1/2, quantity of colour) and hue
angle (H⁎ = tang
−1(b⁎ / a⁎), real colour) were calculated as
described by
Wyszecki and Stiles (1982)
. Intramuscular fat was
determined with 20.0 g (in duplicate) of minced meat in a Soxhlet
apparatus using petroleum ether (
NP
–1224, 1982
). The pigment
concentration in muscle samples was analysed according to
Boccard et al. (1981)
. Total collagen was determined, after acid
hydrolysis, by spectrophotometric assay of
L-hydroxyproline
(
AOAC, 1990
). The amount of
L-hydroxyproline in the
supernatant and residue fractions was converted into soluble and
insoluble collagen using 7.25 and 7.52 as factors (
Cross et al.,
1973
). Collagen was expressed as total (soluble + insoluble) and
soluble collagen as the percentage of the total. Cooking loss was
evaluated in refrigerated meat samples of similar geometry,
individually placed inside polyethylene bags in a water bath at
75 °C. Samples were heated until an internal temperature of 70 °C
(monitored with thermocouples introduced in the core) and cooled
for 15 min under running tap water. They were taken from the
bags, dried with filter paper and weighed. Cooking loss was
expressed as the percentage of loss related to the initial weight.
After measurement of cooking loss, samples were stored in a
refrigerator and used for objective tenderness determinations (after
equilibration at room temperature). The Warner–Bratzler shear
force (WBSF) was measured in sub-samples (at least 3) of 1 cm
2cross section and 3
–4 cm in length with fibres perpendicular to the
direction of the blade attached to a Stevens QTS 25 apparatus.
2.5. Statistical analysis
A PC and DA analysis was performed using the Princomp
procedure from the
SAS (1999)
package and the SPSS V. 12.1
package (SPSS Inc., Chicago, USA), respectively.
3. Results and discussion
Tables 1 and 2
show means, standard deviations and
coefficients of variation of the carcass and the meat
quality measurements. The coefficient of variation of
some variables, such as dressing percentage, muscle and
bone content, pH, L⁎, C⁎, and dry matter was lower
than 10%, while for some others, like refrigerated
losses, subcutaneous:muscle ratio, intramuscular fat,
total pigment and total collagen, was higher than 30%.
Tables 3 and 4
display the correlation coefficients (r)
between the variables used for carcass quality and meat
quality, respectively. There are significant correlations
between subcutaneous fat and carcass measurements
indices, for example: CC (r = 0.46, P
b0.001), B/Lg
(r = 0.35, P
b0.01), LgC (r=0.43, Pb0.001), all of them
positive. The positive correlation between carcass
compactness and subcutaneous fat proportion agreed
with results of
Marichal et al. (2003)
with kid goats used
to compare carcass and meat quality at 6, 10 and 25 kg
of slaughter live weight.
The highest correlation coefficient is between hot
carcass weight and carcass compactness (r = 0.96,
P
b0.001), however the correlation coefficients of the
others than can be mentioned are between leg
Table 5
Results from the principal component analysis for the first five principal components of the carcass quality measurements
Component Eigenvalue Portion of variance (%) Cumulative variance (%) 1 5.55 34.7 34.7 2 3.31 20.7 55.3 3 2.52 15.7 71.1 4 1.35 8.5 79.5 5 1.08 6.7 86.3 Table 6
Results from the principal component analysis for the first five principal components of the meat quality measurements
Component Eigenvalue Portion of variance (%) Cumulative variance (%) 1 4.99 31.2 31.2 2 2.65 16.6 47.8 3 1.68 10.5 58.3 4 1.44 9.0 67.3 5 1.23 7.7 75.0
compactness and carcass compactness (r = 0.93,
P
b0.001), between leg compactness and hot carcass
weight (r = 0.93, P
b0.001).
In relation to the meat quality traits it could be
remarked the correlations between the colour parameters,
for example, r for redness and chromaticity (r = 0.98,
Pb0.001), yellowness and hue (r=0.89, Pb0.001),
lightness and hue (r = 0.88, P
b0.001), redness and
pigment content (r = 0.80, P
b0.001), all of them positive.
Negative correlation coefficients were found between
lightness and redness (r =
−0.88, Pb0.001), lightness
and pigment content (r =
−0.85, Pb0.001), lightness and
chromaticity (r =
−0.80, Pb0.001) and lightness and
yellowness (r =
−0.68, Pb0.001) and between ultimate
pH and cooking losses (r =
−0.51, Pb0.001). Significant
positive correlations between muscle pigment
concentra-tion and muscle redness and chroma have previously been
reported by
Dhanda et al. (2003)
. In the same study a
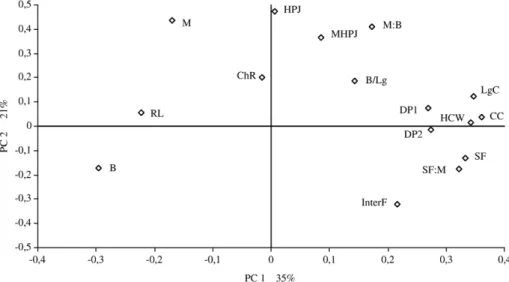
Fig. 1. Projection of the carcass quality measurements in the plane defined by the first two principal components (PCs). Abbreviations: HCW, hot carcass weight; DP1, dressing percentage1; DP2, dressing percentage2; RL, refrigerated losses; CC, carcass compactness index; B/Lg, buttock/leg index; ChR, chest roundness index; LgC, leg compactness index; HPJ, higher priced joints; MHPJ, muscle higher priced joints; M, muscle; SF, subcutaneous fat; InterF, intermuscular fat; B, bone; M:B, muscle:bone ratio; SF:M, subcutaneous:muscle ratio.
Fig. 2. Projection of the carcass quality measurements in the plane defined by the third and fourth principal components (PCs). Abbreviations: The abbreviations are the same as inFig. 1.
negative correlation was found between muscle colour
lightness and pigment content (r =
−0.58, Pb0.01). The
results of the PC analysis are presented in
Table 5
for
carcass quality variables and in
Table 6
for meat quality
variables. The first four PCs explain about 80% of the
total variation for carcass quality measurements (35%,
21%, 16% and 9%, respectively) and 68% for the meat
quality traits (31%, 17%, 11% and 9%, respectively). In
other words, 80% of the total variance for carcass quality
and 68% of the total variance for meat quality, in the 16
considered variables can be condensed into four new
variables (PCs). The results achieved with the PC analysis
applied to analyse carcass and meat quality variables of
goat kids are similar with the results reported by other
analogous studies with other species. In rabbits,
Hernán-dez et al. (2000)
analysed meat quality using 23 variables,
including pH, meat colour, water holding capacity,
cooking loss, fatty acid composition and sensory
para-meters. They found that the first four PCs for meat quality
explained 62% of the total variation.
Destefanis et al.
(2000)
with meat quality measurements (pH, chemical
analysis, colour, hydroxyproline content, lightness, hue,
drip losses, cooking losses, shear force and sensory
variables) in beef showed that 62.5% of the total variation
Fig. 3. Projection of the meat quality measurements in the plane defined by the first two principal components (PCs). Abbreviations: pH1, pH measured at 1 h after slaughter; pH24, pH measured at 24 h after slaughter; T1, temperature measured 1 h after slaughter; T24, temperature measured 24 h after slaughter; L⁎, a⁎, b⁎, chroma-meter values; C⁎, chromaticity; H⁎, hue; DM, dry matter; IntraF, Intramuscular fat; CL, cooking loss; SF, shear force; Pigm, total pigment; CS, collagen solubility; TC, total collagen.
Fig. 4. Projection of the meat quality measurements in the plane defined by the third and fourth principal components (PCs). Abbreviations: The abbreviations are the same as inFig. 3.
is explained by the first three components. In lambs,
Cañeque et al. (2004)
analysed carcass quality and meat
quality measurements as separate sets of variables. Their
results showed that the first four components explained
72% of total variation for carcass quality measurements
and 50% for the meat quality measurements.
In the present study, the first PC of the carcass quality
parameters is characterized by two measurements of
compactness (carcass and leg), carcass weight and
subcutaneous fat (
Fig. 1
). In the loading plot (
Fig. 1
)
these variables are placed far from the origin of the first
PC according to their proportion in the new variable.
The second PC is characterized by higher priced joints
proportion, muscle proportion of the higher priced joints
and the carcass and muscle and bone ratio, all of these
variables are located on the top in the loading plot
(
Fig. 1
). All variables of carcass quality had similar
proportions in the third PC, although muscle and bone
ratio had the lowest value and the muscle in higher
priced joints showed the highest (
Fig. 2
). Ultimately, the
fourth PC is characterized by two indices of carcass
conformations measurements (chest roundness and leg
compactness).
Figs. 3 and 4
show plots of measurements of meat
quality on the first 4 PCs. The first PC of the meat
quality parameters is characterized by colour parameters
(L⁎, b⁎, a⁎, C⁎, H⁎ and total pigment) located far from
the origin, which means that they are important in
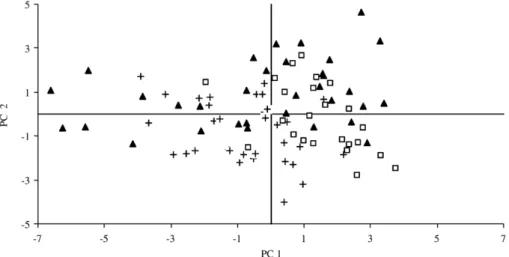
Fig. 5. Projection of the carcass quality data of the two groups of SLW studied in the plane defined by the two principal components (PCs). Symbols: ▴, SLW lower than 10 kg; □, SLW higher than 10 kg.
Fig. 6. Projection of the carcass quality data of the three genotypes studied in the plane defined by the two principal components (PCs). Symbols:⋄, Bravia;□, B×S; ▴, Serrana.
explaining the observed variation (
Fig. 3
). Colour traits
close to each other are positively correlated, whereas if
they are separated by 180°, are negatively correlated.
Collagen determinations (total collagen and collagen
solubility) are located on the second PC in opposition,
expressing a negative correlation. In
Fig. 4
, cooking loss
had high importance defining the third PC, whereas dry
matter, temperature measured at 24 h and intramuscular
fat content are important in explaining the observed
variation in the fourth PC.
Fig. 5
shows the projection of
the carcass quality data in the first two PCs. Two
separate groups can be observed. Kids with a slaughter
live weight lower than 10 kg, located on the left side of
the figure, where the bone and muscle proportion of the
carcass and refrigerated losses lay.
Marichal et al. (2003)
found that kids with 6 kg of slaughter live weight had
greater refrigerated losses and bone content than kids
with 10 and 25 kg of slaughter live weight.
Velasco et al.
(2000)
observed that increased slaughter weight in
Talaverana suckling lambs resulted in a lower
propor-tion of muscle and bone while subcutaneous and
intermuscular fat increased. In the present study the
kids with slaughter live weight higher than 10 kg lie on
the right side of the figure, where the fatness and carcass
conformation traits lay. These relationships among
carcass conformation and fatness are in agreement
with
Marichal et al. (2003)
who reported that carcasses
with high carcass compactness index present more
Fig. 7. Projection of the carcass quality data of the two sexes studied in the plane defined by the two principal components (PCs). Symbols:▴, female; □, male.
Fig. 8. Projection of the meat quality data of the two groups of SLW studied in the plane defined by the two principal components (PCs). Symbols:▴, SLW lower than 10 kg;□, SLW higher than 10 kg.
subcutaneous fat, lower bone content and better muscle/
bone ratio.
Fig. 6
shows the projection of the carcass quality data
of the three genotypes studied (B, B × S, S) in the plane
defined by the first two PCs. Serrana genotype is
preferentially located along the right side of graph where
kids with SLW higher than 10 kg lie, however this group
displays some variability, because some S kids are
placed to the left in the score plot (
Fig. 6
).
Fig. 7
displays the distribution of the carcass quality
data of the two genders studied in the plane defined by
the first two PCs. No defined sets of points are created
with respect to carcass quality of the two groups.
Fig. 8
shows the projection of the meat quality data in the first
two PCs. Kids with a SLW higher than 10 kg are
preferentially located along the right side of the graph,
where the colour parameters a⁎, C⁎ and pigment
content are placed. Kids with a SLW lower than 10 kg
are preferentially located along the left side of the graph,
where the colour parameters L⁎, H and b⁎ traits are
placed. These results show that muscle colour became
darker and more red with increasing age or slaughter live
weight.
Fig. 9
displays the distribution of the meat quality
data of the three genotypes in the first two PCs. Two
separate groups can be observed. Kids of S×B genotype
are located on the right side of the graph where the colour
parameters a⁎, C⁎ and pigment content are placed and
kids of B genotype, are located preferentially on the left
side of the figure, where the colour parameters L⁎, H⁎ and
b⁎ traits are placed. Serrana genotype shows high
Fig. 9. Projection of the meat quality data of the three genotypes studied in the plane defined by the two principal components (PCs). Symbols: +, Bravia;□, B×S; ▴, Serrana.
Fig. 10. Projection of the meat quality data of the two sexes studied in the plane defined by the two principal components (PCs). Symbols:▴, female; □, male.
variability. Significant differences between goat genetic
groups in meat colour (CIE L⁎, a⁎, b⁎ values) had been
reported by
Dhanda et al. (1999b)
.
Fig. 10
displays the distribution of the meat quality
data of the two sexes studied in the plane defined by the
first two PCs. As for carcass quality, no defined sets of
points are created with respect to meat quality of male
and female kids. The differences between sexes in meat
quality of lambs are not in general, very important
(
Sañudo et al., 1998
). Similarly, in the studies conducted
by
Todaro et al. (2004)
with goat kids meat colour, shear
force values and chemical composition were unaffected
by sex.
Fig. 11
displays the distribution of the meat
quality data of the two muscles studied in the plane
defined by the first two PCs. GB muscle is located on
the top in the projection plot, where total collagen (%
DM), ultimate pH, intramuscular fat content and shear
force are placed. LTL muscle is located on the bottom in
the projection plot, where collagen solubility (%total),
dry matter and cooking loss are placed. It is recognized
that considerable differences with respect to
composi-tion and quality exist among the muscles (
Sañudo et al.,
1998
). Histochemical and biochemical properties of a
muscle, such as fibre type, oxidative and glycolytic
capacity, and lipid contents, are factors that may have an
influence on meat quality (
Karlsson et al., 1999
). For
example, variations among muscles in pH24 might be
explained by the fact that muscles differ in red and white
fibre type proportions and therefore, they also differ in
energy metabolism patterns in both ante- and
post-mortem (
Klont et al., 1998
).
Multivariate discriminant analysis was also
per-formed to determine if it is possible to discriminate
kids due to slaughter live weight, genotype, sex and type
of muscle, on the basis of the carcass quality or the meat
quality traits. The results are presented in
Table 7
.
Results for better equations for live weight
identifica-tion, on the basis of the carcass quality traits, show good
accuracy, as 98.2% of the original grouped cases were
correctly assigned to the live weight they belong to. On
the basis of the meat quality traits, 80.4% of original
grouped cases were correctly assigned. Results for better
functions for genotype recognition on the basis of the
carcass quality showed that 89.1% of the samples could
be correctly assigned to the breed they belong to and on
the basis of the meat quality 93.5% were correctly
Table 7
Classification results from discrimination equations for live weight, genotype, sex and type of muscle
Belongs to Carcass quality Meat quality Total Correctly classified Total Correctly classified Trait n n % n n % Live weight ≤10 kg 28 27 96.4 48 39 81.3 N10 kg 27 27 100 44 35 79.5 Genotype B 18 17 94.4 34 31 91.2 B × S 18 17 94.4 25 24 96.0 S 19 15 78.9 33 31 93.9 Sex Female 27 25 92.6 47 33 70.2 Male 28 20 71.4 45 33 73.3 Muscle GB – – – 44 43 97.7 LTL – – – 48 46 95.8
Fig. 11. Projection of the meat quality data of the two muscles studied in the plane defined by the two principal components (PCs). Symbols:▴, GB; □, LTL.
identified. The models developed for sex recognition, on
the basis of the carcass quality traits, were able to
identify almost all female kids (25 of 27), and to a lesser
extent the male kids (20 of 28). On the basis of the meat
quality traits only 33 of 47 female kids were correctly
assigned and 33 of 45 male kids were correctly assigned,
resulting in the lowest accuracy among sex type. The
models developed for muscle recognition were able to
identify almost all samples of GB (43 of 44) and LTL
(46 of 48) muscles. The results showed that 96.7% of
original grouped cases were correctly assigned to the
muscle they belong to. It can be said that carcass
characteristics allow a clear discrimination among
slaughter live weight and meat quality traits allow a
clear discrimination among muscles.
4. Conclusions
The differences between SLW groups in carcass
quality show that, despite the narrow weight range of
SLW, they were enough to make distinctions between
groups with the first PC differentiating with respect to
carcass quality between SLW higher or lower than
10 kg. Nevertheless, the differences between SLW
groups in meat quality tend to be small, which implies
that meat quality among these groups was similar. The
first PC differentiates genotypes in two groups with
respect to meat quality, especially in relation to meat
colour traits while the second PC differentiates LTL and
GB muscles.
References
Albertí, P., Ripoll, G., Goyache, F., Lahoz, F., Olleta, J.L., Panea, B., Sañudo, C., 2005. Carcass characterisation of seven Spanish beef breeds slaughtered at two commercial weights. Meat Sci. 71, 514–521.
AOAC, 1990. Official methods of analysis, 15th ed. Hidroxiprolin in meat and meat products, vol. 1. Association of Official Analytical Chemists, Inc., Virginia.
Boccard, R., Buchter, L., Casteels, E., Cosentino, E., Dransfield, E., Hood, D.E., Joseph, R.L., MacDougall, D.B., Rhodes, D.N., Schön, I., Tinbergen, B.C., Touraille, C., 1981. Procedures for measuring meat quality characteristics in beef production experi-ments. Report of a working group in the Commission of the European Communities' (CEC) beef production research programme. Livest. Prod. Sci. 8, 385–397.
Brito, G., Andrade, J.M., Havel, J., Díaz, C., García, F.J., Peña-Méndez, E.M., 2006. Classification of some heat-treated liver pastes according to container type, using heavy metals content and manufacturer's data, by principal components analysis and potential curves. Meat Sci. 74, 296–302.
Cameron, M.R., Luo, J., Sahlu, T., Hart, S.P., Coleman, S.W., Goetsch, A.L., 2001. Growth and slaughter traits of Boer × Spanish, Boer × Angora, and Spanish goats consuming a concentrate-based diet. J. Anim. Sci. 79, 1423–1430.
Cañeque, V., Perez, C., Velasco, S., Díaz, M.T., Lauzurica, S., Álvarez, I., Ruiz de Huidobro, F., Onega, E., De la Fuente, J., 2004. Carcass and meat quality of light lambs using principal component analysis. Meat Sci. 67, 595–605.
Colomer-Rocher, F., Morand-Fehr, P., Kirton, A.H., 1987. Standard methods and procedures for goat carcass evaluation, jointing and tissue separation. Livest. Prod. Sci. 17, 149–159.
Cross, H.R., Carpenter, Z.L., Smith, G.C., 1973. Effects of intramuscular collagen and elastin on bovine muscle tenderness. J. Food Sci. 38, 998–1003.
Destefanis, G., Barge, M.T., Brugiapaglia, A., Tassone, S., 2000. The use of principal component analysis (PCA) to characterize beef. Meat Sci. 56, 255–259.
Dhanda, J.S., Taylor, D.G., McCosker, J.E., Murray, P.J., 1999a. The influence of goat genotype on the production of Capretto and Chevon carcasses. 1. Growth and carcass characteristics. Meat Sci. 52, 355–361.
Dhanda, J.S., Taylor, D.G., Murray, P.J., McCosker, J.E., 1999b. The influence of goat genotype on the production of Capretto and Chevon carcasses. 2. Meat quality. Meat Sci. 52, 363–367. Dhanda, J.S., Taylor, D.G., Murray, P.J., 2003. Part 1. Growth, carcass
and meat quality parameters of male goats: effects of genotype and liveweight at slaughter. Small Rumin. Res. 50, 57–66.
Fisher, A.V., de Boer, H., 1994. The EAAP standard method of sheep carcass assessment and dissection procedures. Livest. Prod. Sci. 38, 149–159.
Hernández, P., Pla, M., Blasco, A., 1997. Relationships of meat characteristics of two lines of rabbits selected for litter size and growth rate. J. Anim. Sci. 75, 2936–2941.
Hernández, P., Pla, M., Blasco, A., 1998. Carcass characteristics and meat quality of rabbit lines selected for different objectives: II. Relationships between meat characteristics. Livest. Prod. Sci. 54, 125–131.
Hernández, P., Pla, M., Oliver, M.A., Blasco, A., 2000. Relationships between meat quality measurements in rabbits fed with three diets of different fat types and content. Meat Sci. 55, 379–384. Hogg, B.W., Mercer, G.J.K., Mortimer, B.J., Kirton, A.H., Duganzich,
D.M., 1992. Carcass and meat quality attributes of commercial goats in New Zealand. Small Rumin. Res. 8, 243–256. Johnson, D.D., McGowan, C.H., 1998. Diet/management effects on
carcass attributes and meat quality of young goats. Small Rumin. Res. 28, 93–98.
Kadim, T., Mahgoub, O., Al-Ajmi, D.S., Al-Maqbaly, R.S., Al-Saqri, N.M., Ritchie, A., 2003. An evaluation of the growth, carcass and meat quality characteristics of Omani goat breeds. Meat Sci. 66, 203–210.
Karlsson, A., 1992. The use of principal component analysis (PCA) for evaluation results from pig meat quality measurements. Meat Sci. 31, 423–433.
Karlsson, A.H., Klont, R.E., Fernandez, X., 1999. Skeletal muscle fibres as factors for pork quality. Livest. Prod. Sci. 60, 255–269. Klont, R.E., Brocks, L., Eikelenboom, G., 1998. Muscle fibre type and
meat quality. Meat Sci. 49, S219–S229.
Laville, E., Martin, V., Bastien, O., 1996. Prediction of composition traits of young Charolais bull carcasses using a morphometric method. Meat Sci. 44, 93–104.
Marichal, A., Castro, N., Capote, J., Zamorano, M.J., Argüello, A., 2003. Effects of live weight at slaughter (6, 10 and 25 kg) on kid carcass and meat quality. Livest. Prod. Sci. 83, 247–256. Marinova, P., Banskalieva, V., Alexandrov, S., Tzvetkova, V., Stanchev,
H., 2001. Carcass composition and meat quality of kids fed sunflower oil supplemented diet. Small Rumin. Res. 42, 219–227.
Moreno, T., Varela, A., Oliete, B., Carballo, J.A., Sánchez, L., Montserrat, L., 2006. Nutritional characteristics of veal from weaned and unweaned calves: discriminatory ability of the fat profile. Meat Sci. 73, 209–217.
Næs, T., Baardseth, P., Helgesen, H., Isaksson, T., 1996. Multivariate techniques in the analysis of meat quality. Meat Sci. 43, S135–S149.
NP–1224, 1982. Carnes, derivados e produtos cárneos. Determinação do teor de matéria gorda livre. Instituto Português da Qualidade, Lisboa.
Oliete, B., Carballo, J.A., Varela, A., Moreno, T., Monserrat, L., Sánchez, L., 2006. Effect of weaning status and storage time under vacuum upon physical characteristics of meat of the Rubia Gallega breed. Meat Sci. 73, 102–108.
Oman, J.S., Waldron, D.F., Griffin, D.B., Savell, J.W., 2000. Carcass traits and retail display-life of chops from different goat breed types. J. Anim. Sci. 78, 1262–1266.
Santos-Silva, J., Mendes, I.A., Bessa, R.J.B., 2002. The effect of genotype, feeding system and slaughter weight on the quality of light lambs 1. Growth, carcass composition and meat quality. Livest. Prod. Sci. 76, 17–25.
Sañudo, C., Sanchez, A., Alfonso, M., 1998. Small ruminant production systems and factors affecting lamb meat quality. Meat Sci. 49, S29–S64.
SAS, 1999. SAS User's Guide Statistics, Third edition. SAS Institute Inc., Cary, NC. Version 8.
Sen, A.R., Santra, A., Karim, S.A., 2004. Carcass yield, composition and meat quality attributes of sheep and goat under semiarid conditions. Meat Sci. 66, 757–763.
Todaro, M., Corrao, A., Alicara, M.L., Schinelli, R., Giaccone, P., Priolo, A., 2004. Effects of litter size and sex on meat quality traits of kid meat. Small Rumin. Res. 54, 191–196.
Velasco, S., Lauzurica, S., Cañeque, V., Pérez, C., Huidobro, F., Manzanares, C., Díaz, M.T., 2000. Carcass and meat quality of Talaverana breed suckling lambs in relation to gender and slaughter weight. Anim. Sci. 70, 253–263.
Webb, E.C., Casey, N.H., Simela, L., 2005. Goat meat quality. Small Rumin. Res. 60, 153–166.
Wyszecki, G., Stiles, W.S., 1982. Colorimetry. Color science. Concepts and Methods, Quantitative Data and Formulae. Wiley, New York, pp. 117–248.