Sara Isabel Laiginha Silvestre
Bachelor in Micro and Nanotechnologies EngineeringBiopolymer based microneedles patch by laser
technology for biomedical applications
Dissertation submitted in partial fulfillment of the requirements for the degree of
Master of Science in
Micro and Nanotechnologies Engineering
Adviser: Prof. Dra. Elvira Fortunato, Full Professor,
Faculty of Sciences and Technology, NOVA University of Lisbon
Co-adviser: Prof. Dra. Maria Ascensão Reis, Full Professor,
Faculty of Sciences and Technology, NOVA University of Lisbon
Biopolymer based microneedles patch by laser technology for biomedical applica-tions
Copyright © Sara Isabel Laiginha Silvestre, Faculdade de Ciências e Tecnologia, Universidade NOVA de Lisboa.
A Faculdade de Ciências e Tecnologia e a Universidade NOVA de Lisboa têm o direito, perpétuo e sem limites geográficos, de arquivar e publicar esta dissertação através de exemplares impres-sos reproduzidos em papel ou de forma digital, ou por qualquer outro meio conhecido ou que venha a ser inventado, e de a divulgar através de repositórios científicos e de admitir a sua cópia e distribuição com objetivos educacionais ou de investigação, não comerciais, desde que seja dado crédito ao autor e editor.
This document was created using the (pdf)LATEX processor, based in the “novathesis” template[1], developed at the Dep. Informática of FCT-NOVA [2].
Acknowledgements
Agora que dou por concluído o meu percurso académico quero agradecer a todos os que me acompanharam nesta etapa, que me motivaram e que sempre acreditaram nas minhas capaci-dades.
Agradeço especialmente à minha orientadora de tese, a Professora Elvira Fortunato, e à minha co-orientadora, Professora Maria Ascensão Reis, que pertencem às grandes e influentes figuras femininas na ciência e que mostram todos os dias que a engenharia também é um mundo de mulheres. Não só confiaram em mim, como me deram a oportunidade de conhecer outra realidade, de sair da minha zona de conforto e proporcionaram-me todas as ferramentas para trabalhar ao longo desta tese. Também agradeço ao Professor Rodrigo Martins, que em conjunto com a Professora Elvira Fortunato, fundaram este curso e nos deram a oportunidade de seguir os nossos sonhos e a trabalhar arduamente para sermos os Engenheiros do futuro.
À Carolina Marques, um especial agradecimento por todo o tempo disponibilizado, por me ter recebido de braços abertos desde o inicio e ter guiado da melhor forma possível. Sem esquecer a Ana Samouco, que me acompanhou sempre que precisei e demonstrou que podemos ser excelentes profissionais dentro do trabalho, mas também grandes amigas lá fora.
À Dra. Filomena Freitas e Diana Araújo, por me terem recebido com tanta simpatia e dispor na sua "casa"(Departamento de Química) e por terem estado sempre presentes quando precisei. Também à Diana pela iniciativa e pelas ideias em volta deste tipo de aplicação. Agradeço também a colaboração de todas as outras pessoas que trabalham na instalação piloto do grupo BIOENG e aos que fizeram os ensaios de produção, Mariana Matos, Rafaela Cruz e Fernando Silva.
Ao professor Vítor Alves que foi muito prestável e me disponibilizou do seu tempo para proceder aos testes mecânicos no Instituto Superior de Agronomia.
Ao CENIMAT, à Faculdade, aos professores, aos colegas, e a todos que fazem parte deste grupo incrível.
Aos meus amigos do Open Space, por tornarem o ambiente de trabalho tão positivo e motivante. A todos os que me ensinaram a trabalhar com ferramentas que me vão ser bastantes úteis para a continuação do meu percurso profissional, especialmente ao Adão, ao João Coroa, à Daniela Magalhães e a todos os outros que de alguma forma estiveram presentes.
À minha familia, por me apoiar sempre em todas as escolhas que fiz ao longo da vida, por me meterem juízo, por continuarem a fazer-me lutar e a ambicionar sempre por mais.
À Tânia Silva e Lucas Silva, obrigada pela amizade gigante e pelo exemplo que me continuam sempre a passar.
Por fim, quero agradecer a todas as outras pessoas que já passaram na minha vida, façam parte dos bons ou maus momentos, foram vocês que me tornaram o que sou hoje!
Abstract
One of the most important issues in creating new drug delivery methods is improving drug permeation into the skin. Therefore, many techniques have been proposed, such as oral ad-ministration, intradermal vaccines, transdermal patches, among others, but all of them present several limitations. In the past few years, a new effective, innovative and safe drug delivery system was proposed. This technology is named as microneedles (MNs) and it is a hybrid combination of hypodermic injections and transdermal drug delivery systems, which consists in micro-scale needles that can pierce the skin by a simple, minimally invasive and painless route, enabling to transport drugs and macromolecules into the human body. This dissertation reports the development of a biopolymer-based microneedle patch, using biodegradable and biocompatible polymers, polylactic acid (PLA) and poly(hydroxybutyrate-co-hydroxyvalerate) (P(HB-co-HV)), through a low-cost and maskless laser technology. The laser technology was used to engrave specific patterns on a substrate that served as mold for the MNs production. The best results were obtained with a laser power of 30 W at 0.15 m/s, with the spiral model as pattern. The respective MNs had a length of 0.69 mm and a diameter of 0.33 mm, ideal for painless penetration of skin. Moreover, P(HB-co-HV) demonstrated a higher mechanical stability than commercial PLA, confirming its promising use as MNs biomaterial.
Keywords: Drug delivery systems, Microneedles, Biopolymer based microneedle patch, PLA,
P(HB-co-HV), Micromolding, Laser technology.
Resumo
Um dos objectivos mais importantes na criação de novos métodos de libertação de fármacos (drug delivery) no corpo humano é melhorar a permeação destes na pele. Muitas técnicas tem sido propostas, tal como a administração oral, vacinas intradérmicas, adesivos transdérmicos, entre outros, no entanto todas apresentam várias limitações. Nos últimos anos, foi proposto um novo sistema dedrug deliveryeficaz, inovador e seguro. Esta tecnologia é denominada de micro-agulhas (MNs), tratando-se de uma combinação híbrida de injeções hipodérmicas e sistemas de libertação transdérmica de medicamentos, que consiste em agulhas à microescala que podem perfurar a pele de uma forma simples, minimamente invasiva e sem dor associada. Esta permite o transporte de fármacos e macromoléculas para o corpo humano. Esta dissertação relata o de-senvolvimento de um adesivo/penso (patch) de microagulhas baseado em biopolímeros, usando polímeros biodegradáveis e biocompatíveis, o ácido polilático (PLA), e o poli(hidroxibutirato-co-hidroxivalerato)(P(HB-co-HV)) através de uma tecnologia laser de baixo custo e sem ser necessário usar máscara. A tecnologia de laser foi usada para gravar padrões específicos num substrato que serviu de molde para a produção de MNs. Os melhores resultados foram obtidos com uma potência de 30 W e velocidade de 0,15 m/s, com o modelo em espiral como padrão. As MNs tinham um comprimento de 0,69 mm e um diâmetro de 0,33 mm, ideal para a penetração indolor na pele. Além disso, o P(HB-co-HV) demonstrou ter uma maior capacidade de resistên-cia mecânica do que o PLA comerresistên-cial, confirmando o seu uso promissor como biomaterial para as MNs.
Palavras-chave: Drug delivery, Microagulhas, Biopolímero, PLA, P(HB-co-HV), Tecnologia
la-ser.
Contents
List of Figures xv
List of Tables xvii
Acronyms xix
Objectives and Motivation xxi
1 Introduction 1
1.1 Human Skin . . . 1
1.2 Drug Delivery . . . 2
1.2.1 Microneedles: Definition, Advantages and Design . . . 2
1.2.2 Types of microneedles . . . 3
1.3 Biopolymers . . . 4
1.3.1 PLA and P(HB-co-HV) . . . 5
2 Materials and Methods 7 2.1 Microneedles fabrication processes . . . 7
2.1.1 Mold fabrication. . . 7
2.1.2 Biopolymers . . . 8
2.1.3 Fabrication of the MNs . . . 9
2.2 Characterization of the polymers and MNs . . . 10
2.2.1 Differential scanning calorimetry and Thermogravimetry . . . 10
2.2.2 X-Ray Diffraction . . . 11
2.2.3 Fourier-transform infrared spectroscopy . . . 11
2.2.4 Leica Microsystems . . . 11
2.2.5 Scanning Electron Microscopy. . . 11
2.2.6 Texture Analyzer . . . 11
3 Results and Discussion 13 3.1 Characterization of PLA and P(HB-co-HV) . . . 13
3.1.1 Differential Scanning Calorimetry and Thermogravimetry characterization 13 3.1.2 X-Ray Diffraction characterization . . . 15
3.1.3 Fourier Transform Infrared Spectroscopy . . . 17
3.2 Optimization of MNs production method . . . 18
3.2.1 Fabrication of PDMS molds using different types of lens . . . 18
CO N T E N T S
3.2.2 Fabrication of PDMS molds using different laser settings and patterns . . 19
3.3 Influence of the number of MNs per unit area . . . 24 3.4 Mechanical tests . . . 26 3.4.1 Compression test with PLA-based MNs patch varying the pitch. . . 26 3.4.2 Compression test with P(HB-co-HV)-based MNs patch varying the pitch 27
3.5 Parafilm tests with PLA and P(HB-co-HV)-based MNs patches . . . 28
4 Conclusion and Future Perspectives 31
Bibliography 33
I Annex 1 39
List of Figures
1.1 Layers of the human skin . . . 1
1.2 Hypodermic needlesversusMicroneedles . . . 2
1.3 Types of microneedles. . . 4
1.4 Chemical structure of PLA.. . . 5
1.5 Chemical structure of (P(HB-co-HV)).. . . 5
2.1 Schematic fabrication process of PDMS mold using the laser technique . . . 8
2.2 Schematic fabrication process of PLA-based MNs . . . 9
2.3 Schematic fabrication process of P(HB-co-HV) MNs. . . 10
2.4 Photograph of the TA-XT plus Texture Analyser. . . 12
3.1 Differential scanning calorimetry and thermogravimetry of PLA . . . 13
3.2 Differential scanning calorimetry and thermogravimetry of P(HB-co-HV) . . . 14
3.3 XRD characterization of the PLA . . . 15
3.4 XRD characterization of the P(HB-co-HV) . . . 15
3.5 Polymers morphology . . . 16
3.6 SEM images of the polymers morphology . . . 16
3.7 FTIR characterization of the PLA . . . 17
3.8 FTIR characterization of the P(HB-co-HV) . . . 17
3.9 Optical images in side-view of the mold and resultant PLA-based MNs . . . 19
3.10 Variation of PLA-based MNs length and diameter as function of the speed and power 22 3.11 Variation of PLA-based MNs length and diameter as function of the speed and power applied in the mold fabrication, with the spiral pattern. . . 22
3.12 Resultant PLA MNs using the optimized laser conditions . . . 23
3.13 Photograph of PLA and P(HB-co-HV)-based MNs patches . . . 25
3.14 SEM images of PLA based MNs patches . . . 25
3.15 SEM images of P(HB-co-HV) based MNs patches . . . 26
3.16 Compression test of the PLA-based MNs patches . . . 27
3.17 Compression test of the P(HB-co-HV)-based MNs patches . . . 28
3.18 SEM images of PLA and P(HB-co-HV)-based MNs patches with a pitch of 1.2 mm, after parafilm tests . . . 29
3.19 SEM images of PLA and P(HB-co-HV)-based MNs patches with a pitch of 0.6 mm, after parafilm tests . . . 29
I.1 Cross-section of the engraved models of table 3.6 in PDMS molds. . . 39
List of Tables
3.1 Type of lens . . . 19
3.2 Two different imported pattern models from Adobe Illustrator . . . 20
3.3 PDMS molds and resultant PLA-based MNs using circle pattern . . . 20
3.4 PDMS molds and resultant PLA-based MNs using spiral pattern . . . 21
3.5 Optimized laser conditions for the mold fabrication and resultant MNs . . . 23
3.6 Four different imported pattern models . . . 24
3.7 Variation of the conditions applied in the MNs . . . 24
3.8 Cost analysis of the P(HB-co-HV)-based MNs patch . . . 30
Acronyms
BIOENG Biochemical Engineering Group.
CENIMAT Centre for Materials Research.
DSC Differential Scanning Calorimetry.
FTIR Fourier Transform Infrared Spectroscopy.
HPDFO High-Power Density-Focusing Optics.
HV Hydroxyvalerate.
ID Intradermally.
IM Intramuscularly.
IR Infrared radiation.
MNs Microneedles.
P(HB-co-HV) Poly(hydroxybutyrate-co-hydroxyvalerate).
PDMS Polydimethylsiloxane.
PHA Polyhydroxyalkanoate.
PHB Polyhydroxybutyrate.
PLA Poly(lactic acid).
PPI Pulses Per Inches.
RGB Red, Green and Blue.
SC Subcutaneously.
SEM Scanning Electron Microscopy.
TG Thermogravimetry.
ULS Universal Laser System.
UNL Nova University of Lisbon.
XRD X-Ray Diffraction.
Objectives and Motivation
The aim of this master thesis is to focus on the recent drug delivery innovations and develop a simple, maskless and scalable production method for the painless permeation of drug molecules into the skin. Therefore, a biopolymer-based microneedle patch is optimized and produced using laser technology. Different polymers to produce the microneedles are used to achieve improved characteristics enough to overcome the limitations of the already developed ones. Finally, it briefly discusses the characterization tests carry out along the work. This dissertation is concerned with the successfully development of a biopolymer-based microneedle patch, aiming at:
• Being able to insert large as well as small molecular weight drugs into the human body;
• Perforate the skin without causing pain;
• Scalability of the processes used;
• Reduce costs and substitute the already used fabrication processes.
1
Introduction
This chapter describes the innovative idea of microneedles (MNs) and why it has been a subject of great interest in science. Furthermore, it shows all the techniques and steps behind this work, allowing this technology to be widely recognized as a promising alternative to the already used drug delivery systems. Finally, it briefly reviews the microneedles that are already invented, their fabrication methods and explores materials that can be used.
1.1 Human Skin
Skin is the largest organ of the human body and it is the interface between the human body and the external environment. This organ comprises three layers, i.e. epidermis, dermis and hypodermis (Figure1.1).
Hair Follicle Stratum Corneum Epidermis Dermis Hypodermis Blood Vessels Muscle Sweat Gland Fat Connective Tissue
150 - 200 μm
3 - 10 mm 1.5 - 3 mm 10 - 20 μm
Figure 1.1: Layers of the human skin. Adapted from M. Hoffman and L. Engelke et al. [1,2].
The outermost part of the first layer -epidermis- known as the stratum corneum, acts as a pri-mary and an external physical barrier [3–5]. The stratum corneum is a formidable barrier with only 10-20 µm of thickness and it is almost impermeable to large and hydrophilic molecules. Bellow lies the inner part of the epidermis, which generally has a thickness of 150-200 µm [6–8]. Epidermis contains living cells and nerves but does not have blood vessels. Therefore, only a few molecules, with small molecular weight (<500 Da) and high lipophilicity, have the capacity to cross it directly through passive diffusion [9,10]. Deeper, it comes the dermis, with 1.5-3 mm of thickness, that forms the bulk of the skin volume and provides mechanical strength to the skin. This layer not only contains living cells and nerves but also has blood vessels. The last one before the muscles is known by hypodermis. This is the fat storage layer, which has nerve endings and capillaries connecting the tissues. Thus, to reach systemic circulation any
C H A P T E R 1 . I N T R O D U C T I O N
molecule or compound shall penetrate through all three layers. Crossing the stratum corneum, it diffuses rapidly through the epidermis and freely enters dermis blood vessels. Subsequently, it will be taken by the underlying capillaries and enter the main bloodstream [5,9,11].
1.2 Drug Delivery
One of the most important roles of the skin is to protect what enters the body, acting as a natural selector barrier for all the external molecules. With the daily need to perform treatments, tests, and diagnoses in healthcare, there is a need to insert and transport drugs into the human body. There are several methods to perform the aforementioned, but the most commonly used is by oral delivery. In this method where drugs interact with the harsh environment of the gastrointestinal tract and must survive to pass by the metabolism of the liver. To avoid the gastrointestinal path and overcome this limitation, drugs can be administered by hypodermic injections. Thus, delivery from hypodermal administration results in the compound being deposited either intramuscularly (IM), subcutaneously (SC) or intradermally (ID) (Figure1.2) [3,12]. However, conventional injections cause pain and the risk of needle-stick injuries. In addition, they require medical assistance and the drug does not have a controlled release over time. Therefore, as an effective alternative to the oral routes and hypodermic delivery, trans-dermal patches appear as a promising solution. However, the outermost layer of the skin, as mentioned above, severely limits percutaneous permeation of the majority applied drugs and diffusion of most compounds [4,6].
The development of more sophisticated drugs has demanded the need for more sophisti-cated methods to deliver those drugs [5]. As a hybrid of hypodermic needles and transdermal patches, arrays of micron-scale MNs have been created. Using multiple microscopic needles, it is possible to painlessly pierce the skin, and thereby transport drugs into the body, precisely into or just beyond the epidermis [5,13].
Epidermis
Dermis
Muscles
Microneedles Hypodermic needles
IM SC ID
Hypodermis (subcutis)
Figure 1.2: Hypodermic needlesversusMicroneedles. Adapted from N. R. Hegde et al. [13]
1.2.1 Microneedles: Definition, Advantages and Design
Microneedles, so termed as they generally range from 100 to 1000µm in length, were first con-ceptualized in the 1970s [14], designed to perforate skin and to provide a direct and controlled
1 . 2 . D R U G D E L I V E RY
route access of drugs to the underlying viable tissue layers. Since then, due to advances in microfabrication technology, it has been a subject of significant research and became widely available in the 2000s [9,15,16]. Due to their small size, minimally invasive MNs need to be long enough to penetrate to the dermis, but short and narrow enough to avoid stimulation of dermal nerves or puncture of dermal blood vessels, thus, evading the generation of the pain sensation. Besides the aspect of pain-free delivery, numerous other advantages of MNs are pre-sented: (i) minimal skin trauma; (ii) no bleeding or introduction of pathogens/contamination; (iii) easier and effortless application for non-skilled and/or self-administration; (iv) enhanced drug efficacy that may result in dose reduction; (v) drug delivery can be targeted for a specific area; (vi) increases compliance and reduces medical costs. Though, many critical factors need to be controlled on the delivery such as diffusion, permeability, aqueous/lipid solubility ratio, and molecular size that is also fundamental in facilitating permeation [3,11,16].
Over the past few years, MNs have been designed, developed and fabricated according to their use and needs. It has been possible to use different techniques in a wide range of materials to form arrays with different dimensions, geometries, and shapes. To enhance skin penetration ability and get the most of this technology, it is essential to optimize parameters, such as MN shape, tip-radius, base diameter, height, thickness, the force of insertion, the force of fracture, the density of MN arrays, among others [3,15,17].
One of the most important challenges is obviously something less controllable, that is, the inherent elasticity of human skin, as it varies from person to person. Therefore, the develop-ment of MNs technology requires a deep understanding of the mechanical proprieties of the human skin in general. It is necessary to consider that the thickness of different body sites varies, due to age, sex, ethnicity, and body mass index of a person. The MNs must be optimized in a single reproducible model so that it can be used on every individual [16].
1.2.2 Types of microneedles
As mentioned above, due to the different types of mechanisms of drug delivery enhancement, MNs have a wide range of applicability, with an increasing focus on research field of drug delivery systems.
There are currently 5 types of MNs already reported in the literature [3,6,9], whereby drug administration can be achieved according to the type of MNs (Figure1.3):
(a) Solid:creation of ”holes” in stratum corneum prior to the application of a drug onto the
skin surface or with the drug already employed in the MNs;
(b) Coated:MNs already coated with drugs to be released when inserted into skin;
(c) Dissolving:made of biodegradable materials, where drugs are loaded into the MNs and
released after insertion on skin;
(d) Hollow:drug injection through holes in the central part of the MNs;
(e) Hydrogel-forming: MNs composed of non-dissolving crosslinked hydrogels, which are
carried by a drug-loaded patch. When applied, the hydrogel-forming MNs swell and create hydrogel conduits which facilitate the entry of the drug into the skin.
C H A P T E R 1 . I N T R O D U C T I O N Solid microneedles Coated microneedles Dissolving microneedles Hollow microneedles Hydrogel-forming microneedles stratum corneum epidermis
Figure 1.3: Types of microneedles. Adapted from A. Rzhevskiy et al. [6]
As mentioned, MNs must pierce the stratum corneum barrier and expose the tips to the viable skin tissue. Thus, the most important factor when choosing a material is the ability to get in contact with tissues of the human body without causing a risk of infection or an immune stim-ulation and an unacceptable degree of damage to those tissues. Currently, the most commonly used fabrication methods of MNs consist in: lithography processes, electroplating, molding, hot embossing, wet and dry corrosion, among others [18,19]. Therefore, to avoid all the expensive and time-consuming methods, the development of simple and scalable production methods is mandatory. Laser technology appears as an innovative and promising alternative in MNs fabrications and is the focus of this work [20]. Therefore, to fabricate MNs, it is necessary to use materials with desired characteristics, such as biocompatibility and biodegradability, instead of any other type of material. So, despite the great advances in materials like silicon, metals, glass, ceramics, the promising alternative to the previously described materials are the polymeric materials [3,16].
1.3 Biopolymers
The polymers that have attracted the greatest attention to avoid/replace the use of petroleum resources and solve environmental concerns are the biopolymers obtained from renewable resources, known as bioplastics.
These are a new generation of environmentally friendly plastics, bringing great interest due to their excellent biocompatibility, response to biological or physical stimuli, biodegradability, different degradation profiles, low toxicity, and inherent low-cost. In addition, also present strength and toughness. Their characteristics and their plastic nature make them appealing materials to be used for MNs fabrication. Therefore, when a biopolymer-based MN patch penetrates the skin or any other biological tissue, it must be able to resist the compression forces without breaking or bending [16,21].
1 . 3 . B I O P O LY M E R S
1.3.1 PLA and P(HB-co-HV)
In recent years, sustainability, eco-efficiency, and environmental concerns have played an im-portant role to substitute conventional plastics for bioplastics. For this reason, these can have an excellent applicability on MNs technology due to their great characteristics, such as biocom-patibility, biodegradability, low-cost production, eco-friendly, non-toxic composition, among others [22].
Currently, the most commonly used industrial polymer in MNs production is poly(lactic acid), known as PLA. This is an aliphatic polyester produced by carbohydrate fermentation or chemical synthesis. The chemical structure of PLA is observed in figure1.4.
C H3
Figure 1.4: Chemical structure of poly(lactic acid)(PLA) [23].
Although the PLA has been used on various medical applications, such as slings, patches, implant devices and tissue scaffolds, it also has some drawbacks, such as high cost, low avail-ability and limited molecular weight range [24,25].
Therefore, as an alternative to PLA and conventional plastics, emerges a family of bioplastics with great potential, known as polyhydroxyalkanoate (PHA). PHA is accumulated intracellu-larly by several bacteria in the form of storage granules in a response to physiological stress. These microorganisms can be grown on a variety of substrates, including sugars, fatty acids and even gaseous mixtures of carbon dioxide and hydrogen [26]. Subsequently, the polymer is extracted in the form of bioplastic by disrupting the cells [27]. Its proprieties are affected by bacterial strains, type, and concentration of carbon and nitrogen sources in the growth culture [28].
The most well-known PHA is the poly(hydroxybutyrate-co-hydroxyvalerate), known as (P(HB-co-HV)). This polymer can also be synthetized by bacteria [27,28]. The chemical struc-ture of (P(HB-co-HV)) is shown in figure1.5.
Figure 1.5: Chemical structure of poly(hydroxybutyrate-co-hydroxyvalerate)(P(HB-co-HV)) [29].
Its potential for use can be increased by the content of the hydroxyvalerate (HV) incorpo-rated into the PHB molecular chain. Thus, the polymer becomes more elastic and less crys-talline, increasing their toughness and resistance [30,31]. Therefore, this biopolymer appears to be a great alternative to PLA and further research should be conducted on its characteristics to evaluate its potential applications [31].
2
Materials and Methods
This chapter briefly reviews the experimental techniques used throughout this thesis. Firstly, the fabrication of the MNs molds, using a CO2 infrared laser cutting system, is described. Secondly, the methodology employed in the biopolymer production. And finally, the procedure used for the fabrication of the biopolymer-based MNs patch. Additionally, are mentioned the characterization techniques used in this work are mentioned that allow obtaining structural, compositional and morphological information of the produced polymers and the produced MNs.
2.1 Microneedles fabrication processes
As previously mentioned, the main goal of this work is to simplify and optimize all the steps involved in MNs fabrication using biopolymers as material. It involves two major steps: (i) mold fabrication using laser technology and (ii) MNs production using biopolymers and the molds fabricated in (i). All the experimental details are presented below.
2.1.1 Mold fabrication
The molds fabrication is divided into two simple steps: (i) substrate production followed by (ii) pattern engraving with a laser cutting system.
2.1.1.1 PDMS substrate production
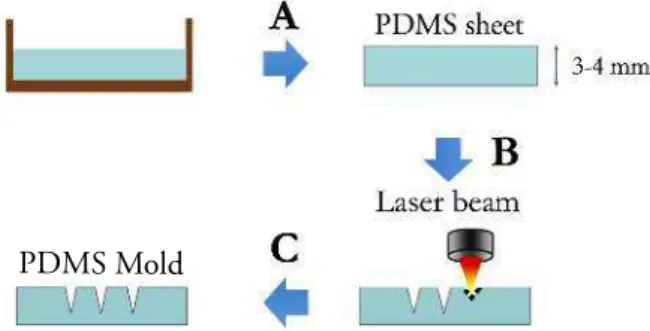
Polydimethylsiloxane (PDMS) is the silicone polymer used as mold due to its availability, low cost, easy fabrication, hydrophobicity, and the ability to withstand high processing tempera-tures. The PDMS sheet is prepared by mixing a 10:1 v/v ratio of PDMS pre-polymer with a curing agent (Silicone Elastomer SYLGARD 184 from Dow Corning). After that, the mixture is poured into Petri dishes, until filling up to about 3-4 mm and is degassed in an 800 Mb vacuum chamber to remove air bubbles. Afterward, to obtain a uniform sheet a curing process is performed at 70℃for 1h. Finally, the resultant PDMS sheet is peeled away from the petri dish.
2.1.1.2 Laser-based pattern engraving
Since the geometry of the MNs has a major influence on their proprieties, a highly controllable technique was chosen for molds production, known as laser, an acronym for ”light amplification by stimulated emission of radiation”. In this work, a pulsed CO2infrared laser cutting system
C H A P T E R 2 . M AT E R I A LS A N D M E T H O D S
(Universal Laser System (ULS) VLS3.5) was used, with a wavelength of 10.6 µm and a focal length of 50.8 mm. This system has a very simple operability, allowing to engrave controlled microstructures, on the PDMS sheet to, posteriorly, form the polymer-based MNs patch. This technology is constituted by two types of lens: (i) the 2.0” lens, with a focus point of 0.127 mm and (ii) the HPDFO (High-Power Density-Focusing Optics) lens with a focus point of 0.025 mm. The computer-controlled laser system works as a printer where with a vector image input it is possible to import the desired patterns, previously designed with an image software (Adobe Illustrator CC). These patterns can encode specific parameters of power, speed and the number of pulses per inch (PPI), in the form of a Red, Green, and Blue (RGB) color code. So, the 3-4 mm thick PDMS sheets were placed on the laser working table to be engraved by the laser beam (Figure 2.1 C) to generate microcavities. Since a fundamental part of this work is to perform a systematic study of the laser technique, a variation of the already mentioned factors was employed: (i) type of lens; (ii) geometry of the engraved patterns; (iii) power and (iv) speed of the laser. With the study of these parameters, it is possible to identify the effects produced in the PDMS molds and, consequently the rendered MNs. Finally, it is optimized and sated up the best engraving conditions of the laser to fabricate a specific MNs mold.
PDMS Mold
Figure 2.1: Schematic fabrication process of PDMS mold using the laser technique, adapted from L. Wang et al. [20]. (A) The PDMS sheet fabrication, as described in 2.1.1.1. (B) Laser beam engraving microcavities on the PDMS sheet surface. (C) PDMS resultant mold.
After using this technique, the molds were washed to remove residues left from the laser engraving process. For that, the molds are placed in an isopropyl alcohol (IPA) container and taken into an ultrasounds bath for 10 minutes. Then the molds are washed with distilled water and dried with a jet of nitrogen. During this work, it was concluded that the molds require a heat treatment prior to their utilization (the reason will be explained in chapter3). Thereby, the molds were placed on a heating plate at 220℃for 2 hours.
2.1.2 Biopolymers
The polymer, used as a reference, was PLA in the form of grains (Ingeo biopolymer 2003D, NatureWorks). P(HB-co-HV) was extracted from a mixed culture biomass produced as described by Albuquerque et al. (2007) [32], using fruit pulp as feedstock. The biomass was provided in broth, being necessary to proceed to a centrifugation process, followed by lyophilization. After a Soxhlet extraction with chloroform was employed, followed by a purification process. In the Soxhlet extraction, the biomass provided (15.51 g) was mixed with chloroform (50 ml) in a Soxhlet extractor. The temperature was kept at 80-90℃, using an oil bath, for 24h. After
2 . 1 . M I C R O N E E D L E S FA B R I CAT I O N P R O C E S S E S
cooling to room temperature, the polymer solution was placed in the food hood for solvent evaporation. The obtained polymer was then purified by dissolving in 50 ml chloroform and adding drop-by-drop into cold ethanol, with a ratio of 1:10 (v/v). Afterward, the precipitated polymer was recovered from the beaker and left exposed to air for 48h, to evaporate the solvent. The P(HB-co-HV) production yield obtained was 41.52%, with an obtained mass of 6.435g.
2.1.3 Fabrication of the MNs
All the MNs were fabricated using the molds prepared in this work according to the method
described in 2.1.1.1. The PLA-based MNs, used as a reference, were produced through an
adaptation of the procedure followed by Wang et al. [20]. For the biopolymer P(HB-co-HV), a new root procedure was created, since there is nothing published about this subject, being the first time that P(HB-co-HV) is used in this type of technology. The fabrication methodologies will be referred in the sections below.
2.1.3.1 Fabrication of PLA-based MNs
Since the reproduction of the existing procedure did not render the exact same results, some adaptations were carried out. The PLA grains did not melt when placed on top of the heated mold, as described, thus, a new approach was developed. The PDMS molds (with the side of the microcavities facing upwards), as well as an aluminum foil with the PLA grains, were placed on top of a hot placed at 180℃, for 5 minutes. After that, the temperature was increased up to 220℃for an additional 5 minutes. Then, with the PLA grains completely melted, the mold was held to be pressed upon the polymer, with a steel sheet, for approximately 5 minutes. The mi-crocavities were filled with the melted PLA, like an inverted micro molding process. Finally, the assembled mold/polymer was removed from the heating plate to lower the temperature. The resultant PLA-based MNs were obtained after a manually demolding process. This fabrication method is described in figure2.2.
Figure 2.2: Schematic fabrication process of PLA-based MNs. (a) Mold and polymer being heated. (b) Mold about to be pressed. (c) Steel sheet being pressed upon the polymer. (d) MNs, mold and steel sheet in rest. (e) Resultant PLA-based MNs.
2.1.3.2 Fabrication of P(HB-co-HV) MNs
For the P(HB-co-HV)-based MNs fabrication, it was used the P(HB-co-HV) aforementioned, produced from a mixed culture ofCupriavidus necatorbacteria. As shown in figure 2.3, the
C H A P T E R 2 . M AT E R I A LS A N D M E T H O D S
P(HB-co-HV) was placed in an aluminum foil and was taken to the oven (Nabertherm), where it was programmed a gradual temperature increase, from room temperature to 220℃along 30 minutes. When at 220℃ it remained another 40 minutes there. At the end of this time, the oven was turned offand the sample was kept inside until the oven temperature lowered to 180℃(approximately 15 minutes). After that, the oven was opened, and the sample was kept inside for more 15 minutes allowing to cool gradually (avoiding a thermal shock with the room temperature). In addition, a weight was placed on top of the assembly to ensure that all the polymer entered in the microcavities. Finally, the sample was withdrawn from the oven and after 10 minutes in rest, it was performed the demolding process to obtain the resultant MNs.
P(HB-co-HV)
P(HB-co-HV)
MNs
Figure 2.3: Schematic fabrication process of P(HB-co-HV) MNs. (a) Gradual heating of the P(HB-co-HV) upon the mold. (b) Constant heating for another 40 minutes. (c) Steel sheet being pressed upon the polymer with the oven open. (d) Mold and polymer in rest. (e) Resultant P(HB-co-HV)-based MNs.
2.2 Characterization of the polymers and MNs
The characterization of the polymers and the resultant polymer-based MNs is a fundamental part of this work to evaluate the quality and the characteristics of them. Thus, the polymers used were characterized in terms of their thermal proprieties by Differential Scanning Calorime-try and ThermogravimeCalorime-try (DSC/TG), crystallographic structure by X-Ray Diffraction (XRD), morphology by Scanning Electron Microscopy (SEM), and chemical structure by Fourier Trans-form Infrared Spectroscopy (FTIR). In addition, the PDMS molds and the resultant MNs were analyzed optically through a stereomicroscope and by SEM to determine their geometry and dimensions. Finally, the MNs mechanical proprieties, namely mechanical compression, were determined using a universal texture analyzer machine.
2.2.1 Differential scanning calorimetry and Thermogravimetry
The different transitions involved in the thermal processing and decomposition of the polymers have been studied using Differential scanning calorimetry (DSC) and Thermogravimetry (TG) (with Simultaneous Thermal Analyzed STA 449 F3 Jupiter from NETZSCH) under air atmo-sphere. The samples were heated from room temperature to approximately 550◦C at a scanning rate of 10◦C/min.
2 . 2 . C H A R AC T E R I Z AT I O N O F T H E P O LY M E R S A N D M N S
2.2.2 X-Ray Diffraction
X-Ray Diffraction (XRD) is the technique that enabled to assess the crystallographic structure of the commercial PLA and the produced P(HB-co-HV). The results were recorded using an X-ray diffractometer (PANalytical X′Pert PRO MRD) with a monochromatic Cu Kα radiation source (45 kV and 40 mA) to scan the samples, which were recorded in a 2θrange from 10◦to 90◦ using a scan rate of 10◦/min with a continuous scanning mode.
2.2.3 Fourier-transform infrared spectroscopy
The Fourier-transform Infrared Spectroscopy (FTIR) was used to chemically analyze the poly-mers with a FTIR Thermo Nicolet 6700, to obtain the infrared characteristic spectrum absorp-tion of which one. FTIR is an analytical technique that covers a wide range of compounds and allows simple polymer identification, being able to measure wavelengths between 350 and 7400 cm-1. After each measurement, it was taken a background spectrum that traced dissolved
gases and solvent molecules of the air. Therefore, when the polymer was put into the FTIR compartment and pressed with the sample holder to be measured, that background spectrum was eliminated giving only the information about that sample. After each measurement, the sample holder was cleaned with ethanol and compressed air stream, removing any traces from the previous sample. The polymers were analyzed before and after the thermal treatment.
2.2.4 Leica Microsystems
The determination of the values of the length and the diameter of the microcavities created in PDMS that served as a mold, and the resultant MNs where obtained with a Leica M80 stereo microscope, providing a wide overview and detailed imaging. However, it was only used for the initial study, using SEM for all the following optical images.
2.2.5 Scanning Electron Microscopy
The biopolymers used in this work were imaged with a SEM Zeiss Auriga CrossBeam Work-station. The commercial PLA and the produced P(HB-co-HV) were coated with 15-25 nm of Au/Pd and imaged to assess their morphology. It is important to observe the morphology of the biopolymers, prior to use and after molding into MNs, to study and compare with the results obtained with the others characterization methods. Posteriorly, the produced MNs were also analyzed by SEM, to observe the microstructures of the final MNs, obtaining images in side view, 45-degree view and top view configurations. It was performed a coating of 15-25 nm of Au/Pd and the SEM images were taken with 5-15 kV of accelerating voltage and a SE-BSE signal mixing. The dimensions of the MNs were determined with the SEM images using a Java-based image processing and analysis software, ImageJ (U. S. National Institutes of Health, Bethesda, Maryland, USA).
2.2.6 Texture Analyzer
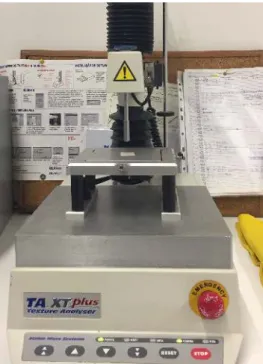
For the mechanical tests, it was used a TA-XT plus Texture Analyzer (figure2.4. The principle of the texture analyser is to physically deform a sample in a controlled manner and measure
C H A P T E R 2 . M AT E R I A LS A N D M E T H O D S
its response. For this reason, it was used to evaluate and analyze the mechanical and physical proprieties of the MNs by the observation of their response to the applied force. For the tests, it was defined specific parameters on the texture analyzer to apply the necessary force to pierce the human skin. This method is well fitted to characterize the MNs since it allows to perform tests under strictly defined and controlled conditions. These tests were performed at the School of Agronomy (University of Lisbon) with the collaboration of Professor Vítor Alves.
Figure 2.4: Photograph of the TA-XT plus Texture Analyser used for the mechanical tests.
3
Results and Discussion
In this chapter, all the work done regarding the MNs fabrication is presented and discussed. First, section3.1presents the characterization of the PLA and P(HB-co-HV) polymers. Secondly, section3.2shows the optimization results of the laser parameters used to engrave microcavities into the PDMS molds and the resultant MNs. In section3.3is described the study of the ratio of the microneedles quantity per unit area, defined as pitch. Finally, in section3.4it is presented the results obtained from the mechanical tests, which provides information about the quality of the final MNs.
3.1 Characterization of PLA and P(HB-
co
-HV)
3.1.1 Differential Scanning Calorimetry and Thermogravimetry characterization
DSC/TG under air atmosphere was performed to obtain thermal transitions and proprieties of the PLA and P(HB-co-HV), as shown in figure3.1and3.2. This characterization technique was essential to determine the thermal stability of the polymers and their melting point (Tm) for the subsequent MNs production. The degradation of polymers is very dependent on a range of factors, such as their molecular weight, purity, crystallinity, pH, additives on it, and so on [33]. In the figures below are shown the quantitative measurement of the polymers mass change, due to the thermal degradation, temperature of the thermal transitions, weight loss region and the maximum temperature of decomposition. Starting with the thermal characterization of PLA, as seen in figure3.1, an endothermic peak is observed around 62℃, being the first change in the polymer and corresponding to its glass transition (Tg).
360°C
332°C
177°C
91°C 62°C
Mass change: -90%
406°C442°C468°C
Figure 3.1: Differential scanning calorimetry and thermogravimetry of PLA.
C H A P T E R 3 . R E S U LT S A N D D I S C U S S I O N
At 91℃ there is an exothermic peak, matching the crystallization temperature (Tc). At 177℃is seen a more significant peak which corresponds to the melting point (Tm) of the poly-mer, which occurs typically at 170-240℃[34]. Up to these temperatures no relevant mass loss occurs, thus no significant degradation occurred. Above, approximately, 300℃up to 400℃ the decomposition is fast, and it completes a mass loss of 90% of the polymer, accompanied by an endothermic peak at 360℃. These observations allowed to determine the working tem-peratures for the PLA-based MNs fabrication. Therefore, the polymer can be molded into the desired shape by melt processing above its Tm and below 250℃to avoid degradation. This analysis was considered for the PLA-based MNs fabrication procedure, in section2.1.3.1.
DSC and TG characterization of the P(HB-co-HV) are shown in figure3.2.
Mass change: -93%
296°C
136°C
Figure 3.2: Differential scanning calorimetry and thermogravimetry of P(HB-co-HV).
As seen, the melting point is approximately 136℃for the P(HB-co-HV), which is in accor-dance with the literature [35]. The low Tm for the P(HB-co-HV) can be explained by the HV units present in their composition [31]. Their degradation occurs at a lower temperature than the commercial PLA, at 296℃, with a mass loss of 93%, respectively. This analysis allowed to determine the thermal stability of the polymers and the working temperatures for the melting process required for the MNs fabrication. Firstly, it was attempted to reproduce the same fabri-cation procedure used in PLA-based MNs, however, the P(HB-co-HV) does not react well to the rapid temperature rising and degrades very easily above 220℃. This degradation is observed because the thermal behavior can vary with the heating rate which can be justified by the re-organization of crystals during heating or by melting unstable crystals present in the polymer. Thus, according to the results of the P(HB-co-HV) thermal characterization, this problem was overcome by using an oven that allows a gradual increase in temperature and it was concluded that is preferable to use slow heating rates on this type of polymers.
Additionally, it was performed a study of the PLA crystallinity degree. The crystallinity percentage (Xc) can be calculated from the enthalpy obtained from DSC results, using the following equation:
Xc(%) =
|∆H
c+∆Hm|
|∆H
m(100%)|
(3.1)
where∆Hcis the heat of crystallization (J/g),∆Hmis the heat of fusion (J/g), and∆Hm(100%)
3 . 1 . C H A R AC T E R I Z AT I O N O F P L A A N D P ( H B -CO- H V )
is the enthalpy of melting of 100% crystalline PLA (approximately 93 J/g) [36].
Using equation3.1, PLA shows a Xc of 63%, which confirms its semi-crystalline structure. It was not possible to calculate the Xc of the P(HB-co-HV) since it is not possible to observe any crystallization peak in DSC analysis.
3.1.2 X-Ray Diffraction characterization
X-ray diffraction was an essential tool to identify the crystalline phases of the polymers and com-pare with the other characterization methods. Figure3.3shows the PLA XRD diffractograms, before, during and after molding process.
0
16.02°
(~190°)
Figure 3.3: XRD characterization of the PLA before and after molding into MNs.
As shown, the absence of Bragg′s peaks in the as-received PLA diffractogram indicates their initial amorphous state. When PLA is submitted to a temperature above its Tm (177◦) is observed an increase in the peak intensity of the PLA. This behavior is in accordance with the results calculated in section3.1.1from DSC data, where PLA revealed being a semi-crystalline polymer. Therefore, the temperature is the condition that can be controlled to dictate the final desired morphology of the MNs [37].
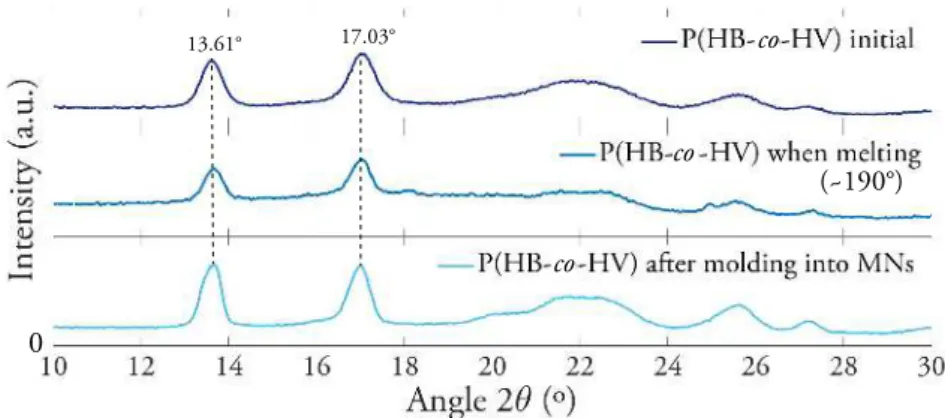
In figure3.4is shown the P(HB-co-HV) XRD diffractograms, before, during and after the molding process.
0
co
co
co 13.61° 17.03°
(~190°)
Figure 3.4: XRD characterization of the P(HB-co-HV) before, during and after molding into MNs.
C H A P T E R 3 . R E S U LT S A N D D I S C U S S I O N
As observed, the polymer shows prominent peaks at 13.61◦and 17.03◦, which correspond to the (020) and (110) reflections of the orthorhombic crystalline lattice. These peaks identify the crystalline nature of the biopolymer and it can be compared and confirmed with similar analysis reported by Oliveira et al. [38]. P(HB-co-HV) shows agreement on all characterization results [39]. The diffraction profile of P(HB-co-HV) shown a slight change on the peaks intensity during the molding process due to their semi-crystalline behavior. This can be explained by the rearrangement of the molecules in the polymer during the MNs fabrication [39].
Figure 3.5 shows the morphology of the PLA and P(HB-co-HV), where is observed the pellet/grain of PLA and the fibrous P(HB-co-HV) used along the work.
P(HB-
co
-HV)
Figure 3.5: Polymers morphology. A 20-cent coin was used for scale purposes.
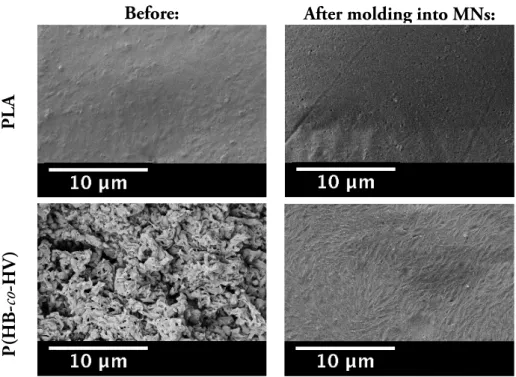
The biopolymers were also observed by SEM. PLA showed a flat morphology without significant changes before and after the molding process. P(HB-co-HV) was obtained in a fibrous form, however, after molding into MNs it shows a flat surface with some reliefs (figure3.6).
Before:
After molding into MNs:
PL
A
P(HB-co
-HV
)
Figure 3.6: SEM images of the polymers morphology before and after molding into MNs.
3 . 1 . C H A R AC T E R I Z AT I O N O F P L A A N D P ( H B -CO- H V )
3.1.3 Fourier Transform Infrared Spectroscopy
The chemical characterization of the polymers was obtained by FTIR by a qualitative analysis of the polymers absorption bands. The study of the peak shifts makes possible to determine
functional group interactions of the samples. The PLA and P(HB-co-HV) spectrums were
compared to the literature, from tables of characteristic IR absorptions [40]. Figure3.7shows the PLA spectrum before and after being used on the MNs fabrication.
C=O
C-H
C-H C-H
C-O
1
Figure 3.7: FTIR characterization of the PLA before and after molding into MNs.
The spectrum of the as-received PLA shows a relatively sharp peak related to the C=O stretch vibration at 1720-1750 cm-1, a typical characteristic of aliphatic polyesters. It is also
observed C-O stretching vibrations at 1000-1250 cm-1 and 1300-1320 cm-1. Other bands can
be found at 1450-1470 cm-1, corresponding to bending vibrations of methyl groups. Then it is observed a C-H stretching vibration of aldehyde group at 2695-2830 cm-1and a C-H stretching
vibration at 2850-3000 cm-1. Both spectra, before and after, show absorption peaks at the
same wavelength however it is observed a decrease in its absorbance [34]. The main reason for the variation of the peaks intensity is the arrangement of molecules in the polymer chain. To adapt to specific processing conditions the polymer establish or break bonds. Therefore, the decrease in the absorbance peaks can be explained by the melting of the polymer along the high processing temperatures during the MNs fabrication. When the polymer starts to degrade it occurs mainly through scission of the main chains or side chains of macromolecules. These results were compared and confirmed with an article by K. Madhavan et al. [33]. For the P(HB-co-HV) was also determined the spectrum before and after molding it into MNs (figure3.8).
1 1 C-H C-H C=O C-O C-O C-H
P(HB-co-HV)
P(HB-co-HV)
Figure 3.8: FTIR characterization of the P(HB-co-HV) before and after molding into MNs.
The P(HB-co-HV) spectrum shows a remarkable and sharp peak at 1665-1710 cm-1derived
C H A P T E R 3 . R E S U LT S A N D D I S C U S S I O N
from the presence of a C=O bond, a typical characteristic of PHAs. The observed peaks at 2850-3000 cm-1correspond to C-H stretching vibrations which indicates the presence of HV, as
expected [28]. The bands corresponding to the C-H bending groups are located at 1350-1470 cm-1. The peaks observed between 1000 and 1320 cm-1 show the stretching of the C-O bond of the ester group. As the PLA, the intensity of the peaks after molding into MNs is lower due to some chemical modifications after the thermal treatment. In general, the polymers have the same functional groups, therefore, they will behave in a similar way as a response to specific stimuli, and for this reason, they can have identical fabrication processes.
3.2 Optimization of MNs production method
For the optimization of MNs production method, the first experimental study was performed with the PLA, that was used as a reference, to reproduce an already published work [20]. The optimization of the laser parameters used in PDMS mold began by the variation of some critical parameters, as mentioned in section2.1.1.2. Finally, the PLA-based MNs patch was compared with the results obtained with the P(HB-co-HV) based MNs patch.
A further study, consisting of a heat treatment temperature of the PDMS mold prior to their utilization, was also performed. The first attempts of molding showed that the biopolymer did not enter completely into the mold microcavities. To overcome this problem molds were heated at 220℃for three different times (45 minutes, 1 hour and 2 hours). Significant differences were observed since the biopolymers were already able to enter the PDMS microcavities. The molds that showed best results were the ones heated for 2 hours. Therefore, resorting to a published article by S. Jindasuwan et al. [41], it was confirmed that heat treatments have an effect on surface topography and hydrophobicity of PDMS. With the thermal treatment, the contact angle decreases and the surface roughness of the PDMS increases. For this reason, a heat treatment was carried out in PDMS molds to render a higher hydrophilic behavior, becoming easier for the biopolymer to enter in the microcavities.
3.2.1 Fabrication of PDMS molds using different types of lens
In this work, two types of lens were used: 2.0” and HPDFO lens. The importance of choosing the type of lens is the application that is intended to have, for this reason, is the first consideration of this work. Therefore, by a previous study of the microstructure created with these two types of lenses is possible to determine the best lens for the mold fabrication. In table3.1is shown the different characteristics of which one.
The working principle is very simple, the laser system focuses the laser beam by using plano-convex lenses, converging to a focal point where diverges out again. The lenses focal length determines how quickly the laser beam converges and diverges out again, meaning that 2.0” and HPDFO lens take the same time to reach the focal point. The focal point is defined as the point where the laser beam can be focused in its smaller size and where the power density is the highest. Hence, when the focal point is higher, the laser beam penetrates the PDMS mold deeper, as seen in figure3.9aand in the resultant MNs microstructure (Figure3.9c), using 2.0” lens. Thus, when using HPDFO lens the laser beam concentrates more energy in a smaller
3 . 2 . O P T I M I Z AT I O N O F M N S P R O D U C T I O N M E T H O D
Table 3.1: Type of lens.
2.0" Lens HPDFO
50.8 mm Focal Length 50.8 mm
2.54 mm Depth of focus 0.76 mm
0.127 mm Focus point 0.025 mm
point, meaning the power density is highest in a smaller area, engraving a microstructure wider instead of sharper, as seen in the figures3.9band3.9d (the increase of the microstructure’s length is a result of 20% power increase applied by the laser system, every two MNs).
1 mm
(a)
1 mm
(b)
1 mm
(c)
1 mm
(d)
Figure 3.9: Optical images in side-view of the mold and resultant PLA-based MNs. (a) PDMS mold engraved with 2.0” lens. (b) PDMS mold engraved with HPDFO lens. (c) Resultant PLA MNs of 3.9a. (d) Resultant PLA-based MNs of3.9b.
Since MNs are intended to present a sharper microstructure to penetrate more easily into the human skin, it was concluded that 2.0” lens is the most suitable to be used for this type of application. Another characteristic also observed that is quite interesting is the roughness that the MNs present (Figure3.9c) when fabricated with the mold engraved by the 2.0” lens. Therefore, the placement of the drug around the MNs occupies a larger surface area, which allows allocating a greater amount of drug in the MNs - to be posteriorly inserted into the body - when compared with the smother MNs obtained with the HPDFO lens.
3.2.2 Fabrication of PDMS molds using different laser settings and patterns
After choosing the best type of lens, it was important to explore the effect of laser power and speed on the created microcavities in PDMS molds and resultant MNs. The influence of using different engraving patterns was also studied. The tested patterns were based on an article already published [20], shown in table3.2.
C H A P T E R 3 . R E S U LT S A N D D I S C U S S I O N
Table 3.2: Two different imported pattern models from Adobe Illustrator, used in the molds fabrication.
Pattern: Circle Spiral
Illustrator Design:
Diameter: a=0.04mm b=0.08mm
Power and speed are controllable parameters in the laser system, whereby it was established specific values to explore its effects on the mold. Using a circle and a spiral, as laser engraving patterns, the laser power was varied between 10 W and 50 W and the laser speed was varied between 0.05 m/s and 0.25 m/s. The PPI, which defines the number of laser pulses per linear inch, was not relevant in the engraving conditions, and for this reason, it was kept constant along all the work with a rate of 1000 PPI (maximum allowed value). Each pattern was engraved as a matrix, where the laser speed was kept constant in each line while each column was settled with different powers. The circle and spiral patterns and the resultant MNs can be observed in table3.3and table3.4, respectively.
Table 3.3: PDMS molds and resultant PLA-based MNs using circle pattern, with different values of laser power and speed. Each condition was performed in duplicate.
Circle model
Mold: Microneedles:
Power (W)
10 20 30 40 50 10 20 30 40 50
Speed (m/s)
0.05
1 mm
1 mm
0.10
1 mm
1 mm
0.15
1 mm
1 mm
0.20
1 mm
1 mm
0.25
1 mm
1 mm
3 . 2 . O P T I M I Z AT I O N O F M N S P R O D U C T I O N M E T H O D
Table 3.4: PDMS molds and resultant PLA-based MNs using spiral pattern, with different values of laser power and speed. Each condition was performed in duplicate.
Spiral model
Mold: Microneedles:
Power (W)
10 20 30 40 50 10 20 30 40 50
Speed (m/s)
0.05
1 mm
1 mm
0.10
1 mm
1 mm
0.15
1 mm
1 mm
0.20
1 mm
1 mm
0.25
1 mm
1 mm
The results above show that using different patterns influence the microcavities engraved in the PDMS mold. This will allow producing desired microstructures with both patterns by optimizing the conditions applied. Therefore, with the spiral pattern are obtained MNs with a higher length than with the circle pattern. Visually, the MNs diameter seemed to present similar values by using both patterns, which was confirmed further ahead (figure3.10and3.11). For this reason, it was concluded that the spiral pattern was the most indicated model to use due to the possibility to apply faster laser speed and lower power values to obtain identical results as the circle pattern. Consequently, it will reduce the energy used by the laser machine and the time of production.
Afterward, a stereomicroscope was used to collect optical images of the MNs produced, to determine their length and diameter followed by the analyzation of all the collected data with Matlab software (MathWorks). This allowed creating graphics relating all parameters simultaneously as shown in figure3.10and3.11). The graphics show the influence of the speed and power, used with the laser to create the microcavities on the PDMS sheet, and the length and diameter of the conical microstructures of the MNs after molding the polymer. In the
C H A P T E R 3 . R E S U LT S A N D D I S C U S S I O N
graphics XYZ, is observed the variation of the length and the corresponding color. It is also represented a graph XY to better confirm the increase/decrease of the MNs diameter by the observation of the circles dimensions and the colors associated with the length.
1.60 1.20 0.80 0.40 0 1.60 1.80 1.40 1.20 1.00 0.80 0.40 0.20 0.60
Figure 3.10: Variation of PLA-based MNs length and diameter as function of the speed and power applied in the mold fabrication, with the circle pattern.
1.60 1.20 0.80 0.40 0 2.00 1.60 1.80 1.40 1.20 1.00 0.80 0.40 0.20 0.60 2.00
Figure 3.11: Variation of PLA-based MNs length and diameter as function of the speed and power applied in the mold fabrication, with the spiral pattern.
The graphics show the influence of the speed and power to create the microcavities on the PDMS sheet on the length and diameter of the conical microstructures of the created MNs. In general, lower power and higher speed render small MNs both in length and diameter. On the contrary, higher power and lower speed render bigger MNs. Regarding the study of the influence of different patterns (circle and spiral) in the resultant MNs microstructure, it is observed that using a spiral geometry, is possible to obtain MNs with a higher length and diameter than using a circle pattern.
It was already mentioned that epidermis thickness has 0.2 mm of length. For this reason, the most suitable dimensions for the MNs were adapted and defined to be painless and have sufficient thickness for resisting compressive forces to not break when inserted into the skin. It was considered and expected that only the tip or half of the MN will penetrate the skin, being incorporated in a patch that will be applied manually. So, the optimized dimensions lie in a range between 0.5-1 mm for the length and 0.3-0.4 mm for the diameter, corresponding to the green color on the graphics shown above. After this analysis, it was concluded that three
3 . 2 . O P T I M I Z AT I O N O F M N S P R O D U C T I O N M E T H O D
different conditions for circle and spiral pattern can be used to obtain MNs with the desired dimensions (table3.5).
Table 3.5: Optimized laser conditions for the mold fabrication and resultant MNs length and diameter, using circle and spiral pattern:
Model Speed (m/s) Power (W) MN length (mm) MN diameter (mm)
Circle 0.05
20 0.64 0.40
30 0.72 0.41
0.10 40 0.66 0.37
Spiral
0.05 20 1.00 0.36
0.10 30 0.99 0.37
0.15 30 0.69 0.33
SEM imaging was used to observe the produced MNs and to help deciding the final condi-tions of laser power and speed (figure3.12).
(a) (b)
Figure 3.12: Resultant MNs using the optimized laser conditions. (a) Using circle pattern (Power: 40 W; Speed: 0.10 m/s). (b) Using spiral pattern (Power: 30 W; Speed: 0.15 m/s).
The best dimensions obtained with a circle pattern was using laser power of 40 W at 0.10 m/s, resulting in a length of 0.66 mm and a diameter of 0.37 mm for the MNs, as shown in figure3.12a. By using a spiral pattern, obtained with a laser power of 30 W at 0.15 m/s, it has resulted in a length of 0.69 mm and a diameter of 0.33 mm for the MNs, as shown in figure3.12b. These results were considered for the mold production where the pattern can be used depending on the application.
The effect of different designed patterns on the geometries of the microcavities in PDMS molds and resultant MNs shown to be an important parameter to study. During this work, it was also created four additional models, shown in table 3.6. To avoid an absurd amount of results to analyze, it was only used a fixed value of laser power and speed (25 W at 0.13 m/s) for the mold production. At the annexIis shown the resultant microcavities engraved in the PDMS mold with the different patterns. However, in this work, these molds were not further used in the MNs production, but they can be used for future and desired applications.
C H A P T E R 3 . R E S U LT S A N D D I S C U S S I O N
Table 3.6: Four different imported pattern models.
Models: Model A: Model B: Model C: Model D:
Pattern: Circle insidecircles Hexagon Hexagon withlines inside Square withlines inside
Illustrator Design:
Diameter/sides: a=0.04mm b=0.045mm b=0.045mm c=0.08mm
3.3 Influence of the number of MNs per unit area
The number of the MNs per unit area is an important parameter when designing the biopolymer-based MNs patch. It was previously studied by Park et al. [42] that skin permeability increases by increasing the number of MNs per area, improving the efficiency of this technology. In this section, this parameter was studied, by varying the distance between each MN - defined as pitch - and consequently the number of MNs per patch. The conditions used are defined in table3.7:
Table 3.7: Variation of the conditions applied in the MNs:
Model: (m/s):Speed Power(W): Array dimension(cm): Number of MNsper column: Number of MNsper patch: (mm):Pitch
Circle 0.10 40
1x1 158 22564 0.61.2
2x2 3015 900225 0.61.2
Spiral 0.15 30
1x1 158 22564 0.61.2
2x2 3015 900225 0.61.2
As mentioned, the PDMS molds can be fabricated with various replicated uniform mi-crostructures, which is controlled by laser lens, power, speed and imported patterns. One of the most important considerations in drug delivery systems is to produce MNs patches with a significant number of MNs per unit area [20], once it allows a high quantity of loaded drugs in the MNs. The figures depicted in figure3.14 and3.15show SEM images of the resultant polymer-based MNs patch by varying the imported patterns, the number of MNs per unit area and the pitch. This analysis was used to assess the quality of the patch and the scalability of the optimized fabrication method. Firstly, PLA was used to study the effect of the pitch variation, reproducing both patterns in arrays of 1x1 cm and 2x2 cm (figure3.14).
Bellow, in figure3.13is shown an photograph of a PLA-based MNs patch with an array of 2x2 cm.
3 . 3 . I N F LU E N C E O F T H E N U M B E R O F M N S P E R U N I T A R E A
Figure 3.13: Photograph of P(HB-co-HV)-based MNs patch (array of 1x1 cm), PLA-based MNs patch (array of 2x2 cm) and patches prepared to be observed in SEM. A 20-cent coin is used for scale purposes.
PLA
Pitch: 1.2 mm Pitch: 0.6 mm
C
ir
cle:
Spiral:
Figure 3.14: SEM images of PLA based MNs patches.
The variation of the array dimension did not show significant differences in terms of MNs morphology. Although, the strength required to demold the MNs with larger array dimensions was higher due to the high surface area, which can create defects in the final patch. Both presented excellent uniformity and quality with almost the same microstructure. However, it was only chosen the spiral pattern to reproduce the P(HB-co-HV) MNs due to the lower laser speed and power applied, as mentioned. Concerning the pitch variation study, major differences were observed. With a pitch of 0.6 mm the rendered MNs microstructures were not entirely intact, due to break-up during mold removal or the polymer not having completely entered the mold microcavities due to surface strength. Contrariwise, by using a pitch of 1.2 mm the MNs present excellent structure.
After that, the same conditions were reproduced for the P(HB-co-HV) biopolymer, using a
C H A P T E R 3 . R E S U LT S A N D D I S C U S S I O N
1x1 cm array with the spiral pattern (figure3.15).
P(HB-
co
-HV)
Pitch: 1.2 mm Pitch: 0.6 mm
Spiral:
Figure 3.15: SEM images of P(HB-co-HV) based MNs patches.
The patches obtained showed to have a good structure and morphology, with adequate dimensions (such as 2x2 cm), to be used in drug delivery. In addition, the patches produced with a pitch of 0.6 mm showed the same good results obtained with a pitch of 1.2 mm, which shows an improvement over the PLA-based MNs.
3.4 Mechanical tests
The MNs ability to penetrate skin without breaking also depends on their mechanical pro-prieties. Thus, to study the strength of the biopolymer-based MNs patch it was performed mechanical tests with a texture analyzer. For that, it was established the desired conditions to test if the patch had strength enough to resist compression forces. It was studied the effect by applying a known axial compression load (i.e. force applied parallel to the MN vertical axis) to the biopolymer-based MNs patch. The arrays were pressed with a metallic block, with 8 mm of diameter, at a rate of 0.05 mm/s for 20 s and the trigger force was set at 0.005 N. It was also defined a maximum compression distance of 1 mm. The tested patches were visualized after 24h using SEM characterization. It is important to refer that these mechanical tests do not accurately simulate the forces that MNs experience when penetrating the skin, but it is a good approximation. For the patches with a defined pitch of 1.2 mm the block area pressed into 32 MNs and for the patches with a defined pitch of 0.6 mm it was pressed on 113 MNs. Park et al. [43], stated that solid MNs can be inserted into the skin between 0.1 to 3 N per needle without fracture.
3.4.1 Compression test with PLA-based MNs patch varying the pitch
Figure3.16and3.17represents the response of the PLA and P(HB-co-HV)-based MNs patches in function of their physical deformation, with a pitch of 1.2 and 0.6 mm. It is also shown the SEM images of the resultant MNs patches to confirm their behavior.
3 . 4 . M E C H A N I CA L T E S T S
PLA
Pitch: 1.2 mm Pitch: 0.6 mm
Compr
ession tests:
MNs after tests:
Figure 3.16: Compression tests and the resultant PLA-based MNs patches. In the left, is repre-sented the patch with a pitch of 1.2 mm, and in the right the patch with a pitch of 0.6 mm.
The MNs patches with a pitch of 1.2 mm can resist compression forces up to approximately 50 N per unit area of the block, corresponding to an axial load of 1.56 N per needle without breaking. With a pitch of 0.6 mm the patches can resist compression forces up to approximately 62 N, corresponding to an axial load of 0.55 N per needle without breaking. As expected from the previous results on pitch variation in section3.3, the force applied to the patch with a 0.6 mm pitch is higher, due to a larger number of needles per unit area, which requires higher compression force to deform. Another interesting detail observed in table3.16is that texture analyzer reached its limit on 62 N, however, the MNs have not break to the applied forces. By analyzing the results shown above, the SEM images confirmed their elastic deformation and the ability to resist to compression forces above the ones required to perforate skin.
3.4.2 Compression test with P(HB-co-HV)-based MNs patch varying the pitch
The second tested was the P(HB-co-HV)-based MNs patch and it showed almost the same results as PLA-based MNs. They also resisted the compression forces applied, but with much less resistance. The compression tests for the patches with 1.2 and 0.6 mm pitch and the resultant MNs are presented in figure3.17.
![Figure 1.1: Layers of the human skin. Adapted from M. Ho ff man and L. Engelke et al. [1, 2].](https://thumb-eu.123doks.com/thumbv2/123dok_br/16698376.743909/23.892.280.619.618.827/figure-layers-human-skin-adapted-ho-ff-engelke.webp)
![Figure 1.2: Hypodermic needles versus Microneedles. Adapted from N. R. Hegde et al. [13]](https://thumb-eu.123doks.com/thumbv2/123dok_br/16698376.743909/24.892.296.596.772.984/figure-hypodermic-needles-versus-microneedles-adapted-from-hegde.webp)
![Figure 1.3: Types of microneedles. Adapted from A. Rzhevskiy et al. [6]](https://thumb-eu.123doks.com/thumbv2/123dok_br/16698376.743909/26.892.145.749.108.455/figure-types-microneedles-adapted-rzhevskiy-et-al.webp)