Ana Carolina Sebastão Pires
Bachelor of Science in Materials EngineeringLaser technology and 3D printing for production
of biopolymer-based hollow microneedles patch
for biomedical applications
Dissertation submitted in partial fulfillment of the requirements for the degree of
Master of Science in Materials Engineering
Adviser: Prof. Dra. Elvira Fortunato, Full Professor, Faculty of Sciences and Technology, NOVA University of Lisbon Co-adviser: Prof. Dra. Maria Ascensão Reis, Full Professor, Faculty
of Sciences and Technology, NOVA University of Lisbon
Examination Committee
Chairperson: Name of the committee chairperson Raporteur: Name of a raporteur
Member: Another member of the committee
Laser technology and 3D printing for production of biopolymer-based hollow microneedles patch for biomedical applications
Copyright © Ana Carolina Sebastão Pires, Faculty of Sciences and Technology, NOVA University Lisbon.
Ac k n o w l e d g e m e n t s
Nesta secção gostaria de expressar a minha profunda gratidão a todos os que, direta ou indiretamente, estiveram presentes nestes últimos 5 anos e que me ajudaram a concluir esta etapa que culmina com a entrega desta dissertação para a obtenção do grau de Mestre em Engenharia de Materiais. É com enorme satisfação que dou por terminada esta importante fase da minha vida!
Em primeiro lugar gostaria de agradecer à minha orientadora, a Professora Doutora Elvira Fortunato, e co-orientadora, a Professora Doutora Maria Ascensão Reis, duas mulheres influentes na área da Engenharia de Materiais e Química. Agradeço por me terem dado o privilégio de desenvolver esta pequena investigação sobre vossa orientação, por me proporcionarem todas as condições necessárias para a realização desta dissertação e por possibilitarem a junção destas duas áreas, permitindo a aquisição de novos conhecimentos.
Gostaria também de agradecer à Carolina Marques, Sara Silvestre por todos os minutos disponibilizados, aconselhamento, apoio, paciência e transmissão de conhecimentos sobre as micro-agulhas.
À Professora Filomena Freitas, por me receber de braços abertos no laboratório de Culturas Puras do Departamento de Química e por todos os esclarecimentos prestados ao longo da produção e caracterização do polímero. À Diana Araújo, pela iniciativa de alear os polímeros produzidos através da biomassa com aplicações biomédicas, como é o caso das micro-agulhas, e por estar sempre disponível para me ajudar e esclarecer todas as dúvidas sobre este MUNDO que me era totalmente desconhecido! Ao João Pereira, por me ter ajudado não só no processo de extração por Shoxhlet mas também nos ensaios de fluorescência. Agradeço também a colaboração da estação piloto (Mariana Matos, Fernando Silva, Pedro Cardoso e David Liebermann) que forneceram a biomassa para a extração do polímero. Obrigada a todos (Grupo BIOENG - UCBIO) por me terem recebido com grande simpatia e por me ajudarem ao longo desta jornada!
Ao Professor Vítor Alves, do Instituto Superior de Agronomia, pela simpatia e disponibilidade na realização dos ensaios mecânicos.
À Professora Maria Helena Godinho, Susete Fernandes e ao Professor Alexandre Velhinho pela ajuda e esclarecimento de todas as dúvidas durante a análise do comportamento térmico e ensaios mecânicos dos polímeros.
Aos meus colegas de Engenharia de Materiais e de Micro e Nanotecnologias que se tornaram grandes amigos nesta jornada académica. Agradeço-vos a amizade, espírito de companheirismo, todas as memórias criadas e por tornarem este percurso mais fácil. São muitos os nomes que marcam e vocês foram, sem dúvida, a minha segunda família durante estes 5 anos. OBRIGADA!
À Ana, Beatriz, Kevin, Soraia e Alice que sempre estiveram presentes na minha vida mesmo quando a distância podia ser um impedimento.
Por fim, gostaria de agradecer à minha família pois sem eles não estaria aqui. Aos meus pais e ao meu irmão pelo apoio constante, compreensão ilimitada e infindável carinho.
Dedico este trabalho ao meu Avô e ao meu Tio Álvaro, duas pessoas que indiretamente e desde que me lembro sempre me contagiaram com as suas engenhocas, espírito e pensamento engenheiro.
The only way to achieve the impossible is to believe it is possible.
A b s t r a c t
One of the major challenges of transdermal drug delivery is the creation of methods that allow greater bioavailability of drugs. Many techniques have been proposed in order to address this issue such as hypodermic injections and transdermal patches. However, all presented several disadvantages, such as the requirement of administration by trained people and poor bioavailability. Thus, microneedles have emerged as a promising alternative, since they are less invasive and a painless method for delivering drugs through the skin. In this dissertation, a low-cost procedure was proposed, without resorting to microfabrication techniques for the production of hollow microneedles on laser technology and 3D printing using biodegradable and biocompatible polymers such as commercially available poly(lactic acid) (PLA) and the poly(hydroxybutyrate-co -hydroxyvalerate) (P(HB-co-HV)) extracted from biomass. Laser technology was used to
carve specific patterns on the PDMS that served as a mould for the production of needles, while 3D printing was used to produce a counter-mould in order to create a hollow profile in the microneedle when it is pressed onto the assembled mould-molten polymer. The best condition for the production of the moulds was obtained with the spiral pattern, a power of 50 W and a speed of 0.051 m/s. The first step of the production was performed successfully, and the microneedles produced were characterized by SEM, XRD and mechanical compression tests while the biomass was submitted to SEM-EDS, FTIR and XRD analysis. To demonstrate the feasibility of the second production step, the geometry of the counter-mould was optimized, and a macroscale proof of concept was performed using an insulin syringe to produce the hollow needle profiles. At the end of this work, the performance of P(HB-co-HV) in the production of microneedles
was satisfactory, leaving good indicators on the feasibility of its use in biomedical applications such as the one studied.
Keywords: Transdermal Drug Delivery, Hollow Microneedles, PLA, P(HB-co-HV), Laser
Technology, 3D Printer
R e s u m o
Um dos maiores desafios da libertação transdérmica de fármacos consiste na criação de métodos que permitam maior biodisponibilidade dos mesmos. Muitas técnicas foram propostas tais como as injeções hipodérmicas e adesivos transdérmicos. Contudo todas apresentavam diversas desvantagens tais como a administração por pessoal treinado e fraca biodisponibilidade. Assim as micro-agulhas surgiram como um método inovador, menos invasivo e doloroso para a entrega de fármacos através da pele. Na presente dissertação é proposto um procedimento de baixo custo e sem recorrer a técnicas de câmara limpa para a produção de micro-agulhas ocas baseado em tecnologia laser e impressão 3D utilizando polímeros biodegradáveis e biocompatíveis como o poli(ácido láctico) (PLA) comercial e o poli(hidroxibutirato-co-hidroxivalerato) (P(HB-co-HV)) extraído a partir de biomassa. A tecnologia laser foi utilizada para gravar padrões específicos no substrato que serviram de molde para a produção das agulhas, enquanto que a impressão 3D foi utilizada para a produção de um contra-molde de forma a permitir a criação de um perfil oco na micro-agulha, quando pressionado sobre o conjunto molde-polímero fundido. A melhor condição para a produção dos moldes, foi obtida com o padrão espiral, potência de 50 W e velocidade de 0.0508 m/s. O primeiro passo da produção foi efetuado com sucesso e as micro-agulhas produzidas foram caracterizadas por SEM XRD e ensaios mecânicos de compressão enquanto a biomassa foi submetida a análises SEM-EDS, FTIR e XRD. Para demonstrar a viabilidade do segundo passo de produção, a geometria do contra-molde foi otimizada e realizou-se uma prova de conceito à macro-escala utilizando uma seringa de insulina para produzir os perfis ocos das agulhas. Por fim, o P(HB-co-HV) foi extraído com sucesso da biomassa
e demonstrou ser um polímero de utilização promissora em aplicações biomédicas como a produção de micro-agulhas.
Palavras-chave: Libertação Transdérmica de Fármacos, Micro-agulhas Ocas, PLA,
P(HB-co-HV), Tecnologia Laser, Impressão 3D.
C o n t e n t s
List of Figures xv
List of Tables xvii
Acronyms xix
Objectives and Motivation xxi
1 Introduction 1
1.1 Skin Structure . . . 1
1.2 Transdermal Drug Delivery . . . 2
1.2.1 Hypodermic Needles vs. Microneedle Mediated Drug Delivery . 2 1.2.2 Types of Microneedles . . . 3
1.3 Hollow Microneedles . . . 3
1.4 Bio-based polymers . . . 4
1.4.1 PLA, PHAs and P(HB-co-HV) . . . 5
2 Materials and Methods 7 2.1 Microneedles Fabrication Process . . . 7
2.1.1 Fabrication and laser engraving of PDMS molds . . . 7
2.1.2 Laser-based pattern engraving. . . 7
2.1.3 Biopolymers . . . 8
2.1.4 Fabrication of the Microneedles . . . 8
2.2 Characterization Techniques . . . 10
2.2.1 Scanning Electron Microscopy. . . 10
2.2.2 Fourier-transform infrared Spectroscopy . . . 10
2.2.3 X-Ray Diffraction . . . 10
2.2.4 Differential Scanning Calorimetry and Thermogravimetry. . . 10
2.2.5 Mechanical tests - Texture Analyzer . . . 10
3 Results and Discussion 13 3.1 Biomass Characterization. . . 13
3.1.1 Structural and Elemental Analysis . . . 13
3.1.2 Fourier-Transform Infrared Spectroscopy . . . 14
3.1.3 X-Ray Diffraction characterization . . . 14
3.2 Thermal Characterization of Polymers . . . 15
3.2.1 Differential scanning calorimetry and Thermogravimetry . . . . . 15
3.3 Effect of laser parameters on PDMS engraving . . . 18
3.3.1 Optimization of microneedles production method . . . 21
3.4 Microneedles Production and Characterization . . . 21
3.4.1 Morphological and Structural Analysis. . . 22
3.4.2 X-Ray Diffraction characterization . . . . 23
3.4.3 Mechanical Compression Test . . . 25
CO N T E N T S
3.4.4 Counter-mold production . . . 27
3.5 Cost Analysis. . . 28
4 Conclusions and Future Perspectives 31
Bibliography 33
L i s t o f F i g u r e s
1.1 Structure of Human Skin (adapted [2]). . . 1
1.2 Layers of human skin and comparison between two systems of transdermal drug delivery: hypodermic needles and microneedles method (adapted [11]). 2
1.3 Types of microneedles-based transdermal drug delivery: solid (A), coated (B), dissolving (C) hollow (D) and hydrogel-forming (E) microneedles. Firstly, they are applied in the skin and then occurs the drug release (adapted [3, 14]). . . 4
1.4 Chemical structure of poly(lactic acid) (PLA), poly(3-hydroxybutyrate) (PHB), poly(3-hydroxyvalerate) (PHV)and poly(hydroxybutyrate-co-hydroxyvalerate) (P(HB-co-HV)) (adapted [23, 26]). . . 5
2.1 Schematic fabrication process of PDMS MN mold using laser technique: PDMS sheet fabrication with 3 mm in thickness (A), Laser beam drilling microcavities on the surface of PDMS sheets (B), obtained micro-cavities on PDMS sheet (C) (adapted [15]). . . 7
2.2 Extraction of the bacterial biopolymer: fermentation broth as received and after centrifuged (A); biomass before (B) and after (C) freeze drying process; biomass before Soxhlet extraction process (D); biopolymer obtained (E). . . . 8
2.3 Schematic of the production of PLA-based hollow microneedles. a) mould and polymer heating b) application of pressure in the mould c) cooling d) mould-PLA heating in press machine c) application of pressure in the counter-mould e) Resultant PLA-based hollow MNs. . . 9
2.4 Schematic of the production of P(HB-co-HV)-based hollow microneedles. a) gradual heating of P(HB-co-HV) upon the mould c) constant heating c) pressure application upon the polymer with the oven open d) mould-P(HB-co-HV) heating in press machine c) application of pressure in the counter-mould e) Resultant P(HB-co-HV)-based hollow MNs. . . 9
3.1 Biomass Microstructure and elemental mapping of C, O and N on Biomass. . 13
3.2 FTIR characterization of the biomass. . . 14
3.3 X-ray Diffraction of Biomass. . . 15 3.4 Visualization of the bacterial cells under the optical microscope (1000x
magnification) for biomass sample. A) phase contrast and B) fluorescent image after Nile blue staining. . . 15
3.5 Differential Scanning Calorimetry and Thermogravimetry of PLA. . . 16 3.6 Differential Scanning Calorimetry and Thermogravimetry of P(HB-co-HV). . 17 3.7 Differential Scanning Calorimetry and Thermogravimetry of
High-Temperature Resin from Formlabs. . . 17
3.8 Lens types (adapted [40]). . . 19
3.9 Cross-section images of PDMS moulds produced with 2.0 and HPDFO lenses. 19
3.10 Relationship between the geometries of drilled PDMS and the laser power, speed and two different patterns: spiral and circle. . . 20
L i s t o f F i g u r e s
3.11 PDMS’ cavity height and diameter as a function of the laser speed and power applied in it drilling using: circle pattern (A) and spiral pattern (B). . . 20
3.12 Polymers morphology: PLA and P(HB-co-HV). . . 22 3.13 SEM images of PLA-based MNs patches produced with different imported
patterns and pitch. . . 22
3.14 SEM images of P(HB-co-HV)-based MNs patches produced with spiral pattern and different base pitch. . . 23 3.15 XRD characterization of PLA. . . 23
3.16 XRD characterization of P(HB-co-HV) before and after molding into hollow microneedles. . . 24
3.17 SEM images of biopolymers morphology before and after moulding into hollow microneedles. . . 24
3.18 PLA-based hollow MNs patches compression tests and their observation with SEM. On the left side are presented a patch with a pitch of 1.2mm and on the other side is represented a patch with a pitch of 2mm. . . 25
3.19 P(HB-co-HV)-based hollow MNs patches compression tests and their observation with SEM. On the left side are presented a patch with a pitch of 1.2mm and on the other side is represented a patch with a pitch of 2mm. . . 26
3.20 Testing the 3D patch obtained and result after the application of pressure on the PLA . . . 27
3.21 Evolution of the design of the counter-mould and its observation with a stereomicroscope, wherehis the cone height. . . 28
3.22 Scale-up of cavities produced in PDMS mould and macroscale proof of concept. 28
L i s t o f Ta b l e s
3.1 DSC-TG parameters for the thermal transitions peaks, enthalphy and crystallinity degree obtaineded for PLA and P(HB-co-HV).. . . 18 3.2 Conversion between percentage and laser speed and power. . . 18
3.3 Two different imported patterns (circle and spiral) produced on Adobe Illustrator and used to drill the molds. . . 19
3.4 Optimized laser conditions for mould fabrication and resultant diameter, heigth and standard derivation, using circle and spiral pattern. . . 21
3.5 Materials costs to produce PLA-based or P(HB-co-HV)-based Hollow Microneedles patches. . . 29
Ac r o n y m s
BIOENG Biochemical Engineering Group.
CENIMAT Centro de Investigação de Materiais.
DSC Differential Scanning Calorimetry.
FT-IR Fourier Transform Infrared Spectroscopy.
HB Hydroxybutyrate.
HPDFO High-Power Density Focusing Optics lens.
HV Hydroxyvalerate.
LDPE low-density polyethylene.
MMCs mixed microbial cultures.
MNs Microneedles.
P(HB-co-HV) poly(hydroxybutyrate-co-hydroxyvalerate).
PDMS poly(dimethylsiloxane).
PHAs Polyhydroxialkanoates.
PHB Polyhydroxybutyrate.
PLA Poly(lactic acid).
PP polypropylene.
PPI Pulses Per Inches.
RGB Red, Green and Blue.
SEM scanning electron microscope.
TG Thermogravimetry.
UCBIO Unidade de Ciências Biomoleculares Aplicadas.
XRD X-Ray Diffraction.
O b j e c t i v e s a n d Mo t i va t i o n
As we live in a world where diseases can end life, we are forced to untiringly search for new ways of healing. Various methods of drug delivery have been tested but the disadvantages always stand out, such as poor bioavailability of oral administration. Thus, transdermal drug delivery systems are shown as a more effective alternative if they can pierce the skin, more specifically the corneum stratum. Compared with existing methods: hypodermic injections and adhesive patches, microneedles appear as a less invasive method that will enable vaccination and cure without pain.
The aim of this master thesis focuses on the creation of biodegradable microneedles-mediated transdermal delivery systems that allow the delivery of liquid formulations through the skin. Therefore, it was intended to produce biopolymer-based hollow microneedles patches without resorting to microfabrication techniques, but instead by using laser technology and 3D printing to produce them. Two different biodegradable biopolymers were used to produce hollow microneedles and finally, it will be presented the production steps and characterization to analyse the performance of produced microneedles.
The objectives of this Master’s thesis are:
• Extract a biodegradable and biocompatible polymer from biomass;
• Use scalable processes to patch production;
• Production of hollow-based microneedles patches without using microfabrication techniques;
• Reduce costs and be able to replace the manufacturing processes currently used.
All steps were performed at CENIMAT, Chemical Department – BIOENG Group (UCBIO) and the mechanical compression tests were performed at Instituto Superior de Agronomia (ISA).
C
h
a
p
t
e
r
1
I n t r o d u c t i o n
1.1 Skin Structure
Basic knowledge of the skin structure is required in order to develop microneedle-based devices for efficient transdermal drug delivery. The skin is constituted by several layers (figure 1.1) and is the largest organ of the human body, it can reach an area of 1.5-2 m2, in adulthood [1]. It protects internal organs acting as primary and external
physical barrier that prevents water loss, and the entrance of micro-organisms, chemicals and harmful agents. Those different layers, from the outside to the inside, are: epidermis, dermis and hypodermis, which are characterized in terms of their biological properties. The application of this dissertation focuses only on the outermost layer of the epidermis, the stratum corneum (SC) [2,3], being the main barrier to transdermal drug delivery.
Epidermis is the most superficial layer of the skin which is constituted of epithelial tissue and generally has a 130-180 µm thickness [4]. On its surface there is an
impermeable and hydrophilic layer which is called stratum corneum [3]. SC has thickness of 15-20µm [1], and is composed of dead cells surrounded by a hard protein
envelope, filled with keratin and embedded in a lipidic matrix [2,4, 5]. As said before, SC is almost impermeable to drugs with a molecular weight higher than 500 Da [3, 6]. The dermis is constituted by connective tissue consisting of living cells, blood vessels and nerves, with a thickness of 2 mm [4], configures structural strength and flexibility to skin [2]. Finally, before the muscles, the hypodermis or subcutaneous tissue that consists of loose connective tissue with abundant fat deposits, collagen and elastin fibres [2,3].
Figure 1.1: Structure of Human Skin (adapted [2]).
C H A P T E R 1 . I N T R O D U C T I O N
1.2 Transdermal Drug Delivery
There are several drug delivery systems in which we can include: oral, nasal, pulmonary, intravenous and intramuscular injection. The oral administration has a low absorption in the gastrointestinal tract, enzymatic degradation of drugs in both gastrointestinal and hepatic metabolism [7–9], while the others had low efficiency and bioavailability. As an alternative to oral and intravenous injection a transdermal drug delivery system can be used, as it increases the bioavailability and efficacy of the formulation, as well as reducing the risk of disease transmission. One of the drawbacks of transdermal administration is that it is severely limited, due to the inability of most drugs to cross the skin because of the impermeable barrier imposed by the SC [5,7]. This theme has gained major importance in the scientific community over the last three decades in various fields, as well as the intensive search for alternatives to circumvent this physical barrier, without questioning its function, which can include hypodermic needles and adhesive patches. Microneedles are a more effective way to release drugs through the skin because they are long enough to pierce the SC, but too short to prevent the stimulation of the nerve endings [10], allowing a faster diffusion of the drugs into the bloodstream due to increased skin permeability [5].
Figure 1.2: Layers of human skin and comparison between two systems of transdermal drug delivery: hypodermic needles and microneedles method (adapted [11]).
1.2.1 Hypodermic Needles vs. Microneedle Mediated Drug Delivery
To avoid the degradation by gastrointestinal and hepatic metabolism, drugs can be administrated by hypodermic injections which include intramuscular, subcutaneous and intradermal needles (1.2). Vaccination with hypodermic needles is considered the classic method of transdermal drug delivery because it is a fast, low-cost and a disposable method, although it has several disadvantages: (i) requires administration by trained people; (ii) inability to cover large populations during periods of mass vaccination; (iii) pain and discomfort with needle insertion, (iv) which leads to poor patient compliance; (v) unintentional bleeding and/or bruising; (vi) production of potentially hazardous biological waste; (vii) when reused, there is the possibility of transmitting pathogens; (viii) poor absorption and rapid degradation, which leads to poor bioavailability of the drug and therefore requires the production of formulations at higher doses in order to obtain optimum concentration in the body [4,7,12].
1 . 3 . H O L LOW M I C R O N E E D L E S
Although the "microneedle" concept was established in the 1970s [13], the earliest papers reporting the possibility of resorting to microneedle-mediated drug delivery date back to the late 1990s [5,8,11,14]. Microneedles have begun to attract the interest of the scientific community in response to the above-mentioned drawbacks, inducing the development of alternative methods and devices for transdermal drug delivery. Microneedles, as the name suggests, are micro-scale needles that have emerged as a promising, less invasive and painless approach that allow the release of drugs through the SC without reaching the nerve endings [5,7,15]. These can be produced by different types of materials and have different geometries, ranging in heights from tens to hundreds of micrometres [3,6]. Thus providing a simple and economical alternative to reduce the existence of needle-like lesions, cross-infections and avoid the sensation of pain, due to the reduction of the length. Other advantage associated to microneedles is the increase of permeability of the skin to drugs, preventing the necessity of using thermal, chemical or physical methods, such as the application of electric field or ultrasound, previously used to increase the permeability [5,13,16].
After the microneedle insertion, the SC will be disrupted, and the substance will be diffused freely along the epidermis until it connects the blood vessels located in the dermis, in which it will be absorbed and enter the main bloodstream [3,17].
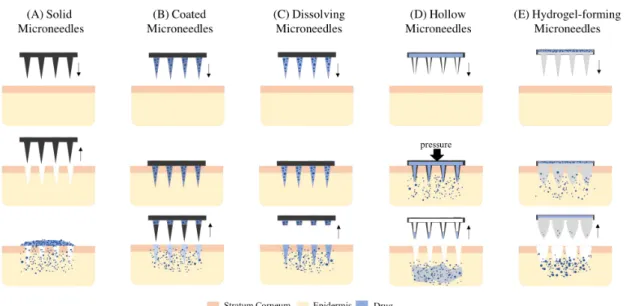
1.2.2 Types of Microneedles
According to the different mechanisms of drug delivery, microneedles (MNs) can be categorized into four groups (figure1.3) [4–6,14,18]:
• Solid MNs: generally stronger and easier to manufacture when compared to hollow microneedles. When perforating the skin, form micro-pores to increase the permeability of the skin to the formulation.
• Coated MNs: coated with dry powder drugs onto a rigid surface called the base micro-needle for dissolution in the skin through interstitial fluid.
• Dissolving MNs: microneedles prepared from a polymer with an encapsulated vaccine for rapid or controlled release in the skin, which avoids wastage of formulations and contributes to the reduction of the cost of its production.
• Hollow MNs: microneedles used to inject liquid substances through the skin. Defined in detail in the section (1.3).
• Hydrogel-forming MNs: composed of non-dissolving crosslinked hydrogels, which are carried by a drug-loaded patch. When MNs pierce the skin, its swells and originates a hydrogel which helps the drug release.
1.3 Hollow Microneedles
Hollow microneedles have a cavity in the central part, from where the drug exits into the tissue [3]. Although they have a more complex production method when compared to solid microneedles, they show higher and continuous drug release rate, allowing a more efficient delivery [14,18]. They are mainly used to inject liquid formulations locally, for example release of insulin for blood glucose control [6]. Also, when compared to the other types of microneedles, Hollow MN are not limited by skin permeability enabling
C H A P T E R 1 . I N T R O D U C T I O N
Figure 1.3: Types of microneedles-based transdermal drug delivery: solid (A), coated (B), dissolving (C) hollow (D) and hydrogel-forming (E) microneedles. Firstly, they are applied in the skin and then occurs the drug release (adapted [3,14]).
the delivery of large amounts of drugs [19].On the other hand, this type of microneedles has a disadvantage, having a poor mechanical behaviour due to the reduced thickness of the walls [20].
In the 1990s, the microelectronics industry provided microbabricaton techniques that allowed not only the start of production of solid microneedles, but also the microfabrication techniques for the production of hollow microneedles [18], which include photolithography systems and MEMS production processes [21]. The first hollow microneedles were produced in silicon and metal, but nowadays there are reports of the production of hollow microneedles with different types of materials such as glass, polymers (SU-8, PLA) and ceramics [14,18].
One of the goals of this thesis is the production of hollow microneedles using cheaper techniques. Instead of using microfabrication equipment, we will use the 3D printing and a pulsed laser engraving machine which are cheaper techniques, allowing the mass production and the creation of a new method to produce hollow microneedles.
1.4 Bio-based polymers
Conventional polymers (such as, low-density polyethylene (LDPE) and
polypropylene (PP)) are produced from non-renewable sources such as petroleum derivatives, which have a very low degradation rate, which leads to environmental and sustainability problems. Several solutions have emerged including reduction, reuse and recycling, but also their substitution by polymers obtained from renewable resources, for example Poly(lactic acid) (PLA) which is a synthetic polymer obtained by natural monomers, and Polyhydroxialkanoates (PHAs) polymers with origin in the microbial fermentation. In the figure1.4is presented the chemical structure of the polymers used: PLA, P (HB-co-HV) and their monomers.
1 . 4 . B I O - BA S E D P O LY M E R S
1.4.1 PLA, PHAs and P(HB-co-HV)
PLA was one of the first synthetic polymers to present medical applications and has also been to produce solid microneedles. This is a chiral aliphatic polyester derived from the building block lactic acid (2-hydroxypropionic acid), produced from renewable resources by chemical synthesis and carbohydrate fermentation [22].Furthermore, is a biodegradable, low toxicity thermoplastic and its physical and mechanical properties have made it appealing to the ideal substitute for petroleum-based thermoplastics. Nowadays, PLA is used in food packaging because it presents good barrier properties that allow maintaining the quality of the fresh products [23, 24], in addition, it is integrated into biomedical devices by absorption of the organism, as is the case of implants, bone scaffold, surgical sutures, screws, fixation pins, plates and drug delivery but its high cost, low availability and limited molecular weight range may limit its use [22,24,25].
Figure 1.4: Chemical structure of poly(lactic acid) (PLA), hydroxybutyrate) (PHB), poly(3-hydroxyvalerate) (PHV)and poly(hydroxybutyrate-co-hydroxyvalerate) (P(HB-co-HV)) (adapted [23,26]).
As an alternative to PLA, a group of environmentally friendly bioplastics emerged, PHAs with great potential in their implementation in several areas, especially in the medical field [27]. PHAs are considered structurally simple polyesters, fully synthesized and polymerized in the bacterial cytoplasm as an energy and carbon reserve [25, 28], allowing the production of various polymers with a wide range of molecular weights. In addition to their biodegradable nature, PHAs are non-toxic, inert, water-insoluble and fully biocompatible and non-gas permeable [29].
The high interest in the implementation of PHA production because these are produced by renewable carbon sources and because they have physical, chemical, thermal and mechanical properties very similar to those of conventional polymers (PP and LPDE) [30,31] the advantage of being biodegradable and biocompatible [28]. IIt is also important to note that its characteristic physical and chemical properties, such as the melting temperature and the glass transition temperature and the degree of crystallinity, are highly dependent on the type of monomers that constitute it and molecular weight distribution. This makes PHAs attractive for applications in areas such as Packaging, Food, Textile, Agriculture and Biofuel industries [27]. The fact that it is biodegradable and biocompatible allows its application in medical and pharmaceutical areas such as the production of sutures, implants and controlled drug delivery systems, and its physical properties and degradation ratio can be adjusted through the use of different bacteria and adjusting the fermentation conditions, which include pH and substrate concentration [30,32].
PHAs can be produced using mixed microbial cultures (MMCs) in order to reduce operating costs by approximately 50% and process energy when compared to pure
C H A P T E R 1 . I N T R O D U C T I O N
cultures requiring high-cost substrates and crop sterility [30, 33] although the cost remains a limiting for PHAs implementation [34]. Finally, it is important to mention that its production at an industrial level will allow the reduction of the environmental impact [27] and the valorisation of by-products and recovery and industrial waste [34].
The first PHA to be produced was the poly(hydroxybutyrate) (PHB), which is also the best known [35]. However, its properties as an homopolymer are not favourable to its use in various applications. This is due to its crystalline and brittle nature [25], alongside with the proximity between its melting temperature and the temperature at which degradation begins, making industrial processing of this polymer impossible [27,
36]. On the other hand, the need to change the thermal properties led to the creation of copolymers such as poly(hydroxybutyrate-co-hydroxyvalerate), P(HB-co-HV). This is
also synthesized by bacterial cells and the content of hydroxyvalerate (HV) incorporated in the molecular chains of HB is increased. It allows to obtain a polymer with distinct mechanical properties (increase of the flexibility, resistance and toughness), less crystalline and a wider thermal processing window, which increases the interest of the industry in its use [25, 36]. Recently the interest in P(HB-co-HV) for medical
applications has increased since it is possible to control the degradation times of this under specific physiological conditions.
C
h
a
p
t
e
r
2
M a t e r i a l s a n d M e t h o d s
2.1 Microneedles Fabrication Process
2.1.1 Fabrication and laser engraving of PDMS molds
PDMS mould was produced by a mixture of the silicone elastomer and curing agent with a weight ratio of 10:1 (Silicone Elastomer Kit, Sylgard 184, Dow Corning). The mixture was degassed in vacuum until all air bubbles had burst, then it was dropped into a Petri dish until filling up to about 3 mm. The Petri dish was cured at 70ºC for 1 hour in the oven after a second degassing step.
2.1.2 Laser-based pattern engraving
In this work, microcavities were generated on the surface of PDMS using a pulsed infrared laser engraving machine (VLS3.50, 50W, Universal Laser System) with a carbon dioxide laser beam with 10.6µm wavelength andHigh-Power Density Focusing Optics
lens (HPDFO)(Universal Laser System) to focus the laser beam, it produces a focal spot size of 25µm in diameter and the laser speed can be adjustable up to 0.25m/s. The pattern
was firstly designed with an image software (Adobe Illustrator CC) and was secondly
imported as a vector image to the computer-controlled laser system in the form of RGB colour code. The laser engraving machine allows engraving in two different modes: raster and vector, and its specific parameters that affectpoly(dimethylsiloxane) (PDMS)mould microstructure is the lens, laser power, speed and pulses per inches (PPI). The PDMS sheet, with 3mm thick, was placed on the laser working table and it was possible to identify its effects on the microcavities produced in the PDMS and consequently in the microneedles by changing laser parameters (figure2.1). After using the laser, the moulds were cleaned to remove possible residues left from the laser engraving process, in an ultrasonic bath for 10 min. in isopropanol, followed by distilled water and dried with a jet of nitrogen. Finally, a heat treatment of the moulds was carried out in the heating plate at 220°C for 2h, making it more hydrophilic and facilitating the entry of the biopolymer into the mould microcavities [37].
Figure 2.1: Schematic fabrication process of PDMS MN mold using laser technique: PDMS sheet fabrication with 3 mm in thickness (A), Laser beam drilling microcavities on the surface of PDMS sheets (B), obtained micro-cavities on PDMS sheet (C) (adapted [15]).
C H A P T E R 2 . M AT E R I A L S A N D M E T H O D S
2.1.3 Biopolymers
In this dissertation, two polymers were used: Poly(lactic acid) (PLA) (Ingeo biopolymer 2003D, NatureWorks) of commercial origin and P(HB-co-HV) extracted from the fermentation broth supplied.
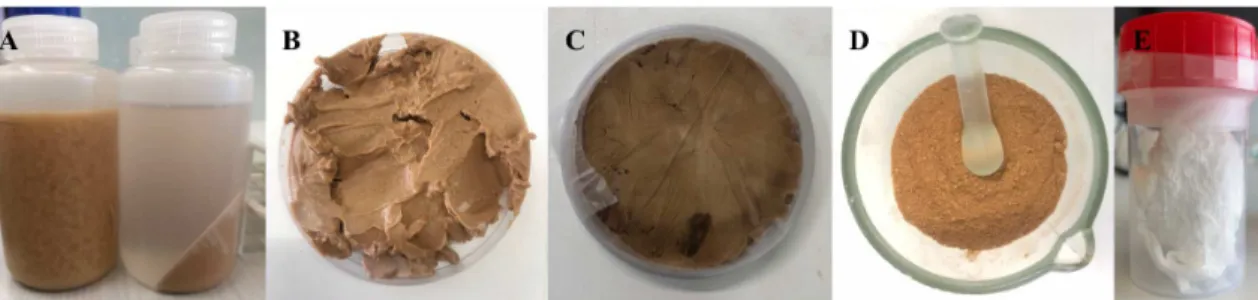
The provided fermentation broth (0.75L biomass) was produced from a mixed of microbial culture biomass using fruit pulp as feedstock. Before starting the extraction of P(HB-co-HV), it was first necessary to perform a centrifugation process, which was followed by lyophilization and a Soxhlet extraction process. On the figure below, it is observed the evolution of the extraction of the polymer from the biomass (figure2.2).
In the beginning, the fermentation broth was centrifuged to divide the supernatant and the biomass by centrifugation for 15 min at 8000 rpm in a Sigma 4-16KS Centrifuge (Sigma Laborzentrifugen GmbH). Then the obtained solid fraction was washed three times with distilled water; in each wash, the pH was neutralized with NaOH 5M, followed by a centrifugation for 10 min at 8000 rpm. Thereafter, obtained biomass was lyophilized to dry the solid fraction and to obtain a high purity bacterial biopolymer, the dried biomass (∼6g) was extracted with chloroform in a Soxhlet (250 ml) extractor running for
24h and temperature was kept at 80-90ºC by using an oil bath. After Soxhlet extraction process and cooling to room temperature, the polymer solution was placed in a beaker for evaporation of chloroform. Afterwards, when the polymer solution has a volume of 50ml, it was subjected to a purification process by adding drop-by-drop the solution into ice-cold ethanol, with a volume ratio of 1:10. Finally, precipitated polymer was recovered and was exposed to air for 48h to evaporate the solvent. In 12g of biomass, it was obtained 4.32g of P(HB-co-HV) with 18 %Cmol of HV, which corresponds to a production yield of 35.95%.
Figure 2.2: Extraction of the bacterial biopolymer: fermentation broth as received and after centrifuged (A); biomass before (B) and after (C) freeze drying process; biomass before Soxhlet extraction process (D); biopolymer obtained (E).
2.1.4 Fabrication of the Microneedles
The moulds used to produce microneedles were prepared according to the method described in section2.1.2. Thereafter the counter-mould was designed in theAdutodesk Fusion 360 Software, exported in STL mode and reproduced on a stereolithography (SLA)
3D printer (Form 2 3D Printer, Formlabs) with High-Temperature Resin (RS-F2-HTAM-01, Formlabs). To produce the polymer-based hollow microneedles patches the process was split into two steps, the first one consisted in filling the PDMS mould with the polymer followed by drilling this structure with the counter-mould which allows producing desired cavities in the cones.
2 . 1 . M I C R O N E E D L E S FA B R I CAT I O N P R O C E S S
To produce PLA hollow microneedles, the PDMS moulds and the PLA grains, previously placed on aluminium, were heated on the heating plate for 5 minutes at 180°C and another 5 min at 200 °C. When the grains were melted, PDMS mould was placed onto the melting PLA and pressed for 5 minutes in order to fill the microcavities present in the mould. finally, the assembled PDMS/PLA was removed from the heating plate and cooled until room temperature. Then, the assembly was placed in the press and subjected to heating from room temperature to 220 °C and it remained for 5 minutes in order to melt the polymer and subsequently pressed with the resin counter-mould which allows the production of desired cavities of hollow microneedles.
Figure 2.3: Schematic of the production of PLA-based hollow microneedles. a) mould and polymer heating b) application of pressure in the mould c) cooling d) mould-PLA heating in press machine c) application of pressure in the counter-mould e) Resultant PLA-based hollow MNs.
To manufacture P(HB-co-HV)-based Hollow Microneedles patch a similar procedure to PLA-based Hollow Microneedles was performed, as shown in figure 2.4. The PDMS mould was preheated on the heating plate (10 min at 200 °C) and then it was placed on the aluminium foil in which P(HB-co-HV) and placed in the oven (Nabertherm Furnace).
The oven was programmed with a gradual heating (room temperature to 220 °C) of temperature over 30 minutes. After reaching the desired temperature, it remained at this stage for 40 minutes and a pressure was applied as soon as the oven was switched off. After cooling for 15 minutes in the oven with the door open, the sample was finally removed from the oven, cooled to room temperature and the second production step was carried out as explained previously.
Figure 2.4: Schematic of the production of P(HB-co-HV)-based hollow microneedles. a) gradual heating of P(HB-co-HV) upon the mould c) constant heating c) pressure application upon the polymer with the oven open d) mould-P(HB-co-HV) heating in press machine c) application of pressure in the counter-mould e) Resultant P(HB-co-HV)-based hollow MNs.
C H A P T E R 2 . M AT E R I A L S A N D M E T H O D S
2.2 Characterization Techniques
2.2.1 Scanning Electron MicroscopyThe biopolymers used in this thesis and produced hollow microneedles were analyzed/imaged by Scanning Electron Microscopy (SEM) (Table Microscope TM3030Plus SEM, Hitachi High-Technologies) at an accelerating voltage of 15kV and a SE-BSE mixing signal. Samples for SEM were coated with 20nm of iridium and it was obtained images in 45-degrees view and top view configuration. To determinate hollow microneedle dimensions, SEM images were analysed by a Java-based image processing and analysis software (Image J, National Institutes of Health, USA).
2.2.2 Fourier-transform infrared Spectroscopy
Infrared transition spectra were performed with a Thermo Nicolet 600 Fourier-transform Infrared Spectroscopy (FT-IR). The biomass spectra was acquired with the wavelength range of 500-4500 cm−1and 2 cm−1step after cleaned the sample holder
with ethanol and dried with compressed air and followed by measure the background spectrum.
2.2.3 X-Ray Diffraction
X-ray diffractometer (PANalytical’s X’Pert PRO MRD, Malvern Panalytical) was used to study the crystallographic structure of PLA and P(HB-co-HV) before and after moulding
into hollow microneedles. Each analysis was performed with a monochromatic Cu k-α
radiation (45 kV and 40 mA) and every scan was recorded in the range of 2θ=10-40º at a
scan speed of 0.5º/s.
2.2.4 Differential Scanning Calorimetry and Thermogravimetry
Thermal analyses were performed using a Simultaneous Thermal Analyzer (STA 449
F3Jupiter, NETZSCH) refers to the simultaneous application of Thermogravimetry (TGA) and Differential scanning calorimetry (DSC) that allows the measurement of mass changes and heat-flux. The profiles were recorded from room temperature to 550 ºC under an air atmosphere at a heating rate of 10 ºC/min.
2.2.5 Mechanical tests - Texture Analyzer
The mechanical tests were made at The School of Agriculture (Instituto Superior de Agronomia (ISA), University of Lisbon) with the collaboration of Professor Vítor Alves. These assays were performed with a Texture Analyser (Texture Analyser, Stable Micro Systems Ltd) with load cell of 5kg, in compression mode, allowing to evaluate the ability of the microneedles to pierce the skin.
Microneedles were attached to the aluminium block of the texture analyser and pressed against to the moveable cylindric probe made of stainless steel (length 3 cm, cross-sectional diameter 8 mm) at a speed of 0.05mm/s for 10 s and the trigger force was set at 0.005N.
2 . 2 . C H A R AC T E R I Z AT I O N T E C H N I Q U E S
´
C
h
a
p
t
e
r
3
R e s u lt s a n d D i s c u s s i o n
In this chapter, it is presented and discussed all the steps involved in the production and characterization of hollow microneedles. First of all, in section 3.1 are presented the characterization of provided biomass follow by the thermal characterization results of PLA, P(HB-co-HV) and resin used on the 3D printer in section3.2. Secondly, it was
studied the effect of the laser parameters and imported patterns to engrave microcavities into PDMS (section 3.3). After this, section 3.4 shows the microneedles produced by the first step of production, optimization of the counter-mould design and the difference between the project and the printed object. Last but not least, it was presented the cost analysis for the biopolymer-based hollow microneedles patch produced in this thesis (section3.5).
3.1 Biomass Characterization
3.1.1 Structural and Elemental Analysis
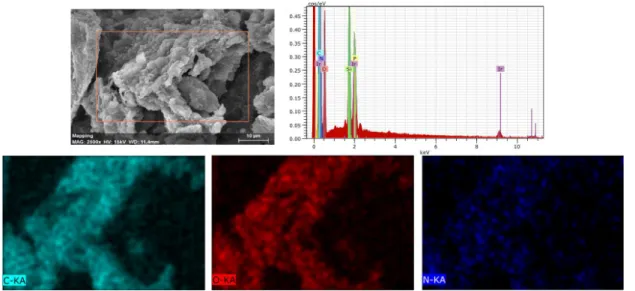
The microstructure of biomass was examined by SEM and it was acquired an Energy Dispersive X-ray (EDX) to identify the element composition of biomass as showed on figure3.1.
Figure 3.1: Biomass Microstructure and elemental mapping of C, O and N on Biomass.
As expected, biomass is composed by carbon (C), oxygen (O) and nitrogen (N), as observed in the mapping image, however, it has been found that N has lower concentration when compared to the other elements. Finally, in the graph, phosphorus
C H A P T E R 3 . R E S U LT S A N D D I S C U S S I O N
(P) is also represented but it is due to the proximity of the x-ray energies between P and Ir. The presence of an intense silicon (Si) peak is due to the use of a silicon wafer as a substrate, on which the sample was placed and later coated with Iridium (Ir).
3.1.2 Fourier-Transform Infrared Spectroscopy
FT-IR spectroscopy, a qualitative analysis which allows the identification of the chemical bonds present in the sample, was performed at room temperature as figure3.2
shows.
Figure 3.2: FTIR characterization of the biomass.
A characteristic weak band that appears in the range of 3100-3500 cm−1reflect the
H-bonded (-OH) and -CH group stretching vibrations of hydroxyl and amine groups on surface of biomass, respectively. The IR spectrum shows the stretching of methyl groups (C-H) between 2750 cm−1and 3000 cm−1, which 2931 cm−1and the peak values of about
2831 cm−1 is allocated to the asymmetric and symmetric stretching of C-H bond. The
presence of aldehyde group (C=O) is expected because it is a marker bond of PHAs and the biomass sample gives an absorption peak at 1722 cm−1of carbonyl ester stretching
vibration. Furthermore, the band vibration near to 1633 cm−1 is assigned to the C=O
bond stretching of bacterial protein amide I, while amide II results from N-H bending vibration at 1540 cm−1and 1456 cm−1which could be assigned to bacterial protein amide
II (-CO-N) present in the cells. Absorption at 1380 cm−1was assigned to terminal -CH
3
groups and 1259 cm−1is due to C-O-C symmetric and asymmetric stretching vibration.
Several absorption bands observed from 1130 cm−1and 750 cm−1were assigned to C-O
of the ester group and C-C stretching vibration bonds and -C-H bending vibration.
3.1.3 X-Ray Diffraction characterization
X-ray diffraction is a technique that allows the identification of crystalline phases of provided biomass as shown in the figure3.3.Biomass has two well-defined peaks (2θ) at
13.6º, 17.1º, one broad peak at 20º and the last one with low intensity at 25.7. Crystalline phases present in the biomass are coincident with the reflections of the orthorhombic crystalline lattice of P(HB-co-HV), as is explained later in section3.4.2, and indicates that
the bacterias present in biomass were able to produce the desired biopolymer as energy source.
3 . 2 . T H E R M A L C H A R AC T E R I Z AT I O N O F P O LY M E R S
Figure 3.3: X-ray Diffraction of Biomass.
To confirm the presence of PHA inside the bacterials cells, it was made a staining test using Nile Blue dye and observed with a fluorescence microscope (BX51, Olympus) under 1000x magnification. The figure3.4shows acquired images of the biomass in the bright field and in fluorescence mode.
Biomass was dissolved in water (25 g/L) and subsequently, the blue nile was added with a volume ratio of 1:10. A heat treatment was carried out in a drying oven for 10 minutes at 50ºC, in order to promote the diffusion of the dye into the biomass cells, staining the lipids of the sample. When biomass was visualized by microscope in the bright field mode, a group of cells were observed and presented as aggregate while in the fluorescence mode it was visible that the PHA was accumulated by some bacteria and the fluorescence intensity increased with the increase in PHA content of the bacterial cell. This is due to the culture medium presenting various types of bacteria being that not all are able to accumulate PHAs.
Figure 3.4: Visualization of the bacterial cells under the optical microscope (1000x magnification) for biomass sample. A) phase contrast and B) fluorescent image after Nile blue staining.
3.2 Thermal Characterization of Polymers
3.2.1 Differential scanning calorimetry and Thermogravimetry
Differential scanning calorimetry and Thermogravimetry (DSC-TG) or thermal characterization of polymers is very important because allows knowing important parameters such as the glass temperature, crystallization temperature melting point which can affect the use of certain types of polymers as a mould, counter-mould as well as the choice of polymer to moulding into hollow microneedles. Furthermore, it allows knowing polymers mass change and thermal transition with the increase of temperature for each sample. It is important to note that the thermal behaviour of the polymers
C H A P T E R 3 . R E S U LT S A N D D I S C U S S I O N
changes with a range of factors, for example, molecular weight, purity, crystallinity, among others.
Figure 3.5: Differential Scanning Calorimetry and Thermogravimetry of PLA.
DSC-TG characterization of PLA is shown in the figure3.5. In the beginning, we can see an endothermic peak at 60ºC which corresponds to the glass transition temperature (occurs between 60-65 ºC [25]) followed by an exothermic peak at 91ºC that refers to the crystallization temperature. In addition, at 170ºC exist another endothermic peak that it concerns to the melting temperature, which occurs typically at 173-178 ºC [25]. Finally, we can notice that until 300ºC no relevant mass loss occurs, however between 300ºC and 400ºC a weight loss of over 90% is noted, which sets the boundary for thermal degradation of the polymer. In consequence of this analysis, it is known that the possible working range temperature for this polymer, in other words, commercial PLA can be exposed to a maximum processing temperature of 250ºC, without reaching its thermal degradation.
Thermal properties of the extracted biopolymer (P(HB-co-HV)) were measured and is
showed on figure3.6. Firstly, is observed two endothermic peaks at 136ºC and 296ºC, which corresponds to the melting point and to thermal degradation of the polymer, respectively. Pure PHB has a melting temperature close to 170ºC, but the reduction of the copolymer melt temperature is expected and justified by the insertion of HV monomers (18%Cmol) into the polymer chain which facilitates processing [38]. The degradation of P(HB-co-HV) occurs at a lower temperature than the PLA and is
accompanied by a mass change of -92%.
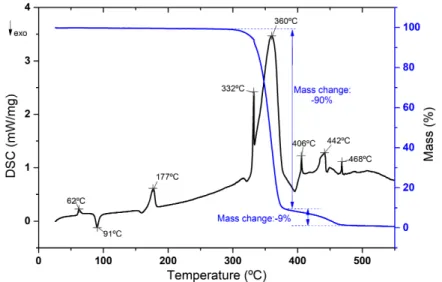
The high-temperature resin was used in the 3D printer to produce a counter-mould able to create a hollow profile in the microneedle and with thermal analysis of the resin is intended to determine its degradation temperature.
The thermal behaviour of the high-temperature resin is shown on figure3.7. In this case, a mass loss of 89% occurs, above to 300 ºC and below to 460ºC, which can represent the region where begins the thermal degradation. Therefore, the production of the hollow microneedles should not exceed 300ºC, avoiding the degradation of the counter-mould.
3 . 2 . T H E R M A L C H A R AC T E R I Z AT I O N O F P O LY M E R S
Figure 3.6: Differential Scanning Calorimetry and Thermogravimetry of P(HB-co-HV).
Figure 3.7: Differential Scanning Calorimetry and Thermogravimetry of High-Temperature Resin from Formlabs.
According to the results of the thermal characterization, the polymers used to produce microneedles are the factors influencing and determining the working temperature for the PLA and P(HB-co-HV)-based hollow microneedles fabrication. In other words, the
moulding temperature of the needles should be higher than the melting point but should not exceed the thermal degradation temperature of each polymer.
Posteriorly and using the following equation, PLA and P(HB-co-HV) crystallinity
degree was calculated from DSC spectra obtained [22]:
Xc(%) =
∆H
c+∆Hm
∆H
m(100%)
(3.1)
where∆H
cis the enthalpy of crystallization(J/g),∆Hmis the enthalpy of melting (J/g) and
∆H
m(100%) is the enthalpy of melting for a fully crystalline polymer (J/g) (∆Hm(100%)
for PLA is 93 J/g [22] and 146 J/g for P(HB-co-HV) [39]).
Through the equation3.1, it was verified that PLA presents a degree of crystallinity
C H A P T E R 3 . R E S U LT S A N D D I S C U S S I O N
of 16.39% it was not possible to calculate the degree of crystallinity of P(HB-co-HV) because it was not possible to determine its enthalpy of crystallization. In the table3.1
are represented a summary of DSC-TG calculated parameters PLA and P(HB-co-HV).
Table 3.1: DSC-TG parameters for the thermal transitions peaks, enthalphy and crystallinity degree obtaineded for PLA and P(HB-co-HV).
Tg (ºC) Tc(ºC) ∆H
c (J/g) Tm(ºC) ∆Hm(J/g) Td (ºC) Xc(%)
PLA 62 91 36.10 177 -20.84 360 16.39
P(HB-co-HV) - - - 136 -4.95 296 N.D.
3.3 E
ff
ect of laser parameters on PDMS engraving
The PDMS moulds were fabricated using a laser engraving machine emitting a carbon dioxide laser beam to drill on the surface of the PDMS sheet and generated microcavities. The mould drilling can be affected by four laser parameters in the laser engraving machine: lens, laser speed, power and PPI, but the imported pattern can also change the obtained microstructure. In order to support the interpretation of the percentages of the laser speed and power, a table (3.2) was created to show the correspondence between the percentage and the real values of laser speed and power.
Table 3.2: Conversion between percentage and laser speed and power.
Percentage (%) Laser Speed (m/s)
vec mode Laser Power (W)
20 0.0508 10
40 0.1016 20
60 0.1524 30
80 0.2032 40
100 0.2549 50
The Universal Laser System at CENIMAT has two lenses available: 2.0 and HPDFO lens with different characteristic represented in figure3.8. In a first step, it is important to choose the type of lens to be used depending on the desired application. In this case, the laser has a great importance in conferring the external shape of the microneedles - conical profile. the influence of the lens type on the microstructures obtained for a fixed velocity of 0.0508 m/s and a variable power between 10 W and 50 W (figure3.9) was analysed for which a sharper profile with the 2.0 lens was obtained contrary to the HPDFO lens. The profile obtained with the HPDFO lens allows a high energy density in a small area which is more favourable to the production of hollow microneedles being more stable for the realization of the channel inside the needle, for which reason the moulds will be made with the mentioned lens.
To study the influence of laser parameters and patterns on the PDMS drilling an identical method was used and based on an article already published by Wang et al.,(2016) [15]. In each experience, the laser speed was fixed in each line while the laser power was set to 5 groups from 10 W (20%) to 50 W (100%) with length step of 10 W (20%) and
3 . 3 . E F F E C T O F L A S E R PA R A M E T E R S O N P DM S E N G R AV I N G
Figure 3.8: Lens types (adapted [40]).
Figure 3.9: Cross-section images of PDMS moulds produced with 2.0 and HPDFO lenses.
with 1000 PPI (maximum value allowed). The resultant cavities were observed with an Optical Stereo Microscope and measured its geometries (i.e., height and diameter). The laser speed also was set to 5 groups from 0,0508 m/s (20%) to 0,254 m/s (100%) with length step of 0,0508 m/s (20%) and with this way we can understand its influence in PDMS engraving. Finally, to analyse the effect of laser pattern, the previous study was repeated for two distinct imported patterns: circle and helix (shown in the the table3.3.) and the resultant relationship between the laser power, speed, imported patterns and the PDMS engraving was represented in the3.10.
Table 3.3: Two different imported patterns (circle and spiral) produced on Adobe Illustrator and used to drill the molds.
Pattern Circle Spiral
Adobe Illustrator
Diameter a=0.08mm b=0.08mm
The results below show that using different parameters and patterns affects the engraving of the mould producing different microstructures. Visually, it is possible to sustain that when the laser speed was fixed, the increasing of the laser power produces an increase of the depth in the cavity. However, when the laser power was fixed, the increasing of the laser speed produced a decrease in the depth of the microcavities. Moreover, it was seen that the imported patterns strongly influence the microcavity in the PDMS and with the use of the spiral pattern it allows achieving to reach a higher depth in the PDMS mould compared to the circular pattern.
The collected data with the stereomicroscope (diameter and height) by creating graphics showed the influence of the laser parameters, such as laser power and speed and imported patterns on the PDMS microcavities. To assist the analysis of the graph, it
C H A P T E R 3 . R E S U LT S A N D D I S C U S S I O N
Figure 3.10: Relationship between the geometries of drilled PDMS and the laser power, speed and two different patterns: spiral and circle.
Figure 3.11: PDMS’ cavity height and diameter as a function of the laser speed and power applied in it drilling using: circle pattern (A) and spiral pattern (B).
was represented the negative of the mould cavity which translates into the realization of several cones with the height of the drilling and its base diameter (figure3.11). In the 3D graphs, a change of height of the cones is accompanied by a change of colour that allows
3 . 4 . M I C R O N E E D L E S P R O D U C T I O N A N D C H A R AC T E R I Z AT I O N
the comparison between the conditions tested. In the graph 2D (laser power vs. laser speed), it is possible to analyse the variation of the diameter of the microstructures by the variation of the dimensions of the circles, being also possible to verify the length variation through the colours.
With this graph, it is possible to confirm the increases or decreases of height and diameter of the microcavities that were produced by the laser. For the same conditions (laser power and speed), it was verified that the diameter was not much affected by the imported pattern. However, the diameter decreases with the increase of the laser speed and increases with the increase of the laser power. Accordingly, to what was already mentioned, the height increases with the laser power and decreases with the laser speed and the spiral pattern allows obtaining microstructures with a higher length than using circle pattern.
3.3.1 Optimization of microneedles production method
Microneedles used in the transdermal drug delivery should have a length below than 1 mm in order to reduce the pain when it pierced the human skin. For this reason, the dimensions of the microneedles were defined to be painless, presented a base diameter which allows the creation of a channel for the drug released and sufficient mechanical strength in order to resist compressive forces without breaking, allowed an efficient drug release. So, the optimized conditions of the moulds, for other words, which had a more favourable geometry for the production of a hollow profile present a range between 0.360-0.800 mm for the height and 0.230-0.290 mm for the base diameter, corresponding to the conditions presented in the table3.4.
Table 3.4: Optimized laser conditions for mould fabrication and resultant diameter, heigth and standard derivation, using circle and spiral pattern.
Imported Pattern Laser Speed (%) Laser Power (%) Mould Diameter (mm) Mould height (mm) Circle 20
80 0.231±0.005 0.371±0.032 100 0.245±0.010 0.377±0.031
40 100 0.234±0.007 0.360±0.007
Spiral 20
80 0.260±0.007 0.561±0.031 100 0.290±0.007 0.794±0.012
40 100 0.250±0.013 0.484±0.007
3.4 Microneedles Production and Characterization
Before the production of hollow microneedles, it is important to characterize the first step of its production which include their morphology, geometry, X-Ray Diffraction (XRD) and mechanical tests.
C H A P T E R 3 . R E S U LT S A N D D I S C U S S I O N
3.4.1 Morphological and Structural Analysis
As said previously, it was used two different polymers along this work to produce hollow microneedles. In figure3.12is possible to observe the differences between their morphologies: PLA grains and fibrous P(HB-co-HV).
Figure 3.12: Polymers morphology: PLA and P(HB-co-HV).
PDMS moulds were fabricated with controlled parameters and posteriorly it was replicated the produced microstructure, as explained earlier in section 2.1.4. For this application, it was fixed a 3x3 matrix with two different base distance between each microstructure or microneedle (pitch): 1.2 mm or 2 mm of pitch. The obtained polymer-based MNs patches (or first production step) were observed via SEM in top and 45-degrees views (figure 3.13 and3.14) in which the imported patterns and the base pitch between needles were changed. The moulds were produced with 0.0508m/s as laser speed and 50 W for laser power. These parameters were chosen because of the real dimensions of the base diameter of counter-mould needles, as explained later in section
3.4.4.
Figure 3.13: SEM images of PLA-based MNs patches produced with different imported patterns and pitch.
3 . 4 . M I C R O N E E D L E S P R O D U C T I O N A N D C H A R AC T E R I Z AT I O N
The first tests were performed with PLA to assess the influence of imported patterns and pitch variation on the obtained microneedles. Both presented patches showed an excellent geometric uniformity, however it was only chosen the spiral pattern to reproduce the P(HB-co-HV)-based hollow microneedle patches because they have higher height and base diameter.
Figure 3.14: SEM images of P(HB-co-HV)-based MNs patches produced with spiral pattern and different base pitch.
3.4.2 X-Ray Diffraction characterization
As said before, X-ray diffraction allows the identification of polymer crystalline phases and this was used to compare the difference between the polymer before and after the first step of hollow microneedles production as shown in the figure3.15and3.16.
(a) XRD before and after molding into hollow microneedles. (b) XRD T=90 ºC.
Figure 3.15: XRD characterization of PLA.
Starting with PLA X-ray diffraction, the diffractogram of as-received PLA shows a broad maximum appearing at approximately (2θ) 16º which indicates that its initial
state is amorphous. However, when PLA was submitted to a temperature increase until 90ºC, two characteristic peaks emerged (2θ) at 16.2º and 18.7º this evolution of the
diffractogram was monitored for 10 minutes as shown in figure3.15b. This behaviour is in accordance with the DSC obtained and analysed in section3.5, where it was determined
C H A P T E R 3 . R E S U LT S A N D D I S C U S S I O N
that the crystallization temperature of the PLA occurs at 90 °C, temperature from which there is a partial alignment of the crystalline domains of polymer chains.
Figure 3.16: XRD characterization of P(HB-co-HV) before and after molding into hollow microneedles.
P(HB-co-HV) was also analysed with XRD and it shows 2 well-defined peaks and another two with lower intensity (2θ) at 13.6º, 17.12º, 21.76º, 25.7º, which correspond to
(020), (110), (101) and (121) reflections of the orthorhombic crystalline lattice, respectively [39]. These peaks agreed with the data found in the literature and the diffractogram revealed the semi-crystalline nature of produced biopolymer. After moulding of the polymer, there was observed a slight increase in the intensity of the intensity of the crystalline peaks which can be explained by the rearrangement of the polymer chains during the first step of needles production. In addition, has emerged a peak with (2θ) 30.7º corresponding to the plane (002) of the orthorhombic crystalline lattice of the polymer [39].
The biopolymers were observed by SEM (figure 3.17) it was verified that the PLA presented a flat surface without reliefs before moulding into microneedles, not showing
Figure 3.17: SEM images of biopolymers morphology before and after moulding into hollow microneedles.
3 . 4 . M I C R O N E E D L E S P R O D U C T I O N A N D C H A R AC T E R I Z AT I O N
significant alterations before moulding. In the case of P(HB-co-HV), it had a fibrous surface, as shown in the SEM image and the figure 3.12, derived from the process of precipitation process in alcohol and after the moulding, the surface was flatter although it does not contain reliefs.
3.4.3 Mechanical Compression Test
The performance of all types of microneedles depends on their ability to penetrate the stratum corneum. Thus, in order to assess its effectiveness, compression tests (effort to which they were subjected when used in the clinic) were performed on the produced patches with a texture analyser. For this reason, was studied the effect of the axial application of a load to the biopolymer-based microneedles patches, previously produced, on other words, the force was applied parallel to the vertical axis of microneedles. The conditions used were presented in section 2.2.5 and remained throughout this study.
In the figures3.18and3.19, were represented the results of the compression tests of the microneedles produced with PLA and P(HB-co-HV), with a variable base pitch: 1.2mm and 2mm. The data were extracted in the form of force-distance and were later converted to a strain-stress graph by approaching the straight section area of the microneedles – multiplication of the number of needles by the cut area of the cone at 1/3 of the base height. After the compression tests, the samples were observed after 72h with SEM to analyse the changes produced, it is important to note that this lead time allowed an elastic recovery of the patch.
With mechanical tests, is pretended to determine maximum compressive forces that microneedles can resist and young modulus, allowing to evaluate microneedles
Figure 3.18: PLA-based hollow MNs patches compression tests and their observation with SEM. On the left side are presented a patch with a pitch of 1.2mm and on the other side is represented a patch with a pitch of 2mm.
C H A P T E R 3 . R E S U LT S A N D D I S C U S S I O N
performance, measuring their ability to pierce the skin. According to Nguyen and Park [10], to pierce the skin without fracture each solid microneedle required a force between 0.1 N and 3 N.
The PLA-patches with a pitch of 1.2mm were able to withstand 15 N forces which correspond to an axial load of 1.7 N/needle without breaking. Afterwards, the mechanical behaviour of patches with 2mm can resist to a compression force of 12N (1.3 N/needle). comparing with the previous sample, it was verified that the pitch increase reduces the compressive strength of microneedles. The young modulus of PLA was determined by the graph in figure 3.18 obtaining a value of 1.90 Pa, which is in agreement with the literature. The analysis of SEM allowed the observation of the deformation imposed on the microneedles after 72h of execution of the compression tests.
The second samples tested form the P(HB-co-HV)-based patch for which similar
graphs were obtained and represented in figure3.19. These are also shown to be able to pierce the skin however their resistance to the application of loads is lower when compared to the PLA-based patch. In the case of the 1.2mm patch, it resisted loads of axial load 6.5N, i.e. 0.7N/needle without breaking. However, in the case of the 2 mm patch, it was found that it was able to resist lower compression forces and value of 4N or 0.4N / needle.
Figure 3.19: P(HB-co-HV)-based hollow MNs patches compression tests and their observation with SEM. On the left side are presented a patch with a pitch of 1.2mm and on the other side is represented a patch with a pitch of 2mm.
By analysing the patches with SEM, it was found that not all needles had their bent end, as had been verified after the mechanical tests. This may indicate the elastic recovery of the polymers however remained some plastic deformation has occurred, as is the case with the Buckling effect. Buckling is a phenomenon that happens when a material is loaded axially in compression and occurs a lateral deflection to applied load [41]. In addition, the compression tests indicated that the tested patches are able to
3 . 4 . M I C R O N E E D L E S P R O D U C T I O N A N D C H A R AC T E R I Z AT I O N
perforate the skin without fracture, which is a positive point for the implantation of this solid microneedles as drug delivery systems. However, it is important to note that the production of the hollow profile into microneedles will reduce the mechanical strength of the microneedles compared to the previously tested solid microneedles.
3.4.4 Counter-mold production
In order to produce the wells on the microneedles, a counter-mold was produced by a stereolithography 3D printer. According to the thermal analysis, the high-temperature resin from Formlabs was the most suitable for the mold production considering that its thermal degradation occurs at temperatures above 250ºC.
Firstly, a counter-mould has a 9-cone matrix (3x3), which the geometry was predefined a base diameter of 0.400 mm and 2 mm width on the Fusion 360 Software. However, when printed it was found to have a length of 0.750 mm, this resulted from the need for the drawing to require a lower resolution than the printer has, in short, it was not possible to draw the end of the cone. Thus, the height of the cone was corrected by doubling the desired value and adding 0.200 mm which makes a theoretical height of 4.200 mm being 2.800 mm the value obtained after printing. During this process, it was found that the resin microneedles presented a base diameter value between 0.400-0.500 mm, being 1 mm from the end of the cone the diameter is 0.100 mm, justifying the use of the laser parameters in the section3.4.1.
Figure 3.20: Testing the 3D patch obtained and result after the application of pressure on the PLA
Subsequently, the production of hollow microneedles was tested as explained in section2.1.4. When testing the 3D patch obtained, it was verified that this fitted to the mould, however, there was a great difficulty in aligning the 3D patch with the PDMS’ mould which resulted in 3D patch break when was applied pressure, although it was found that some resin MNs were able to drill PLA (figure3.20). In the figure3.21, was represented the evolution of the design of the counter-mould and its observation with an Optical Stereo Microscope M80 (Leica Microsystems).
The second step of production was only tested with PLA for lack of resin to produce the counter-mould and, considering the obtained results were not desired, a process magnification was made test the concept to the macroscale through a scale-up of the produced cavities in the mould and the perforation of the microneedles was performed by hand with an insulin syringe. The patch is shown in the figure 3.22and proves the viability of a mould-based and counter-moulding process for the production of hollow microneedles without resorting to clean room techniques.
![Figure 1.1: Structure of Human Skin (adapted [2]).](https://thumb-eu.123doks.com/thumbv2/123dok_br/16692648.743704/23.892.283.608.870.1115/figure-structure-of-human-skin-adapted.webp)
![Figure 1.2: Layers of human skin and comparison between two systems of transdermal drug delivery: hypodermic needles and microneedles method (adapted [11]).](https://thumb-eu.123doks.com/thumbv2/123dok_br/16692648.743704/24.892.306.591.543.775/figure-layers-comparison-systems-transdermal-delivery-hypodermic-microneedles.webp)
![Figure 2.1: Schematic fabrication process of PDMS MN mold using laser technique: PDMS sheet fabrication with 3 mm in thickness (A), Laser beam drilling microcavities on the surface of PDMS sheets (B), obtained micro-cavities on PDMS sheet (C) (adapted [15]](https://thumb-eu.123doks.com/thumbv2/123dok_br/16692648.743704/29.892.133.755.1002.1064/schematic-fabrication-technique-fabrication-thickness-drilling-microcavities-obtained.webp)