UNIVERSIDADE DE LISBOA
Faculdade de Medicina Veterinária
INFLUENCE OF OVERWEIGHT ON ROUTINE PARAMETERS OF RENAL
FUNCTION IN DOGS
ANA CRISTINA HEITOR MACHADO DORES
CONSTITUIÇÃO DO JÚRI:
Doutor Rui José Branquinho de Bessa
Doutora Maria Teresa Mendes Vítor Villa de Brito Dourtora Ana Mafalda Gonçalves Xavier Félix Lourenço
ORIENTADORA Dourtora Myriam Hesta CO-ORIENTADORA
Dourtora Ana Mafalda Gonçalves Xavier Félix Lourenço
2018 LISBOA
“It always seems impossible until it’s done“ by Mandela
i ACKNOWLEDGEMENTS
First, I would like to thank Prof. Dr. Myriam Hesta for giving me the opportunity to know a nutrition research center and made this internship possible. I am also grateful to Sofie Dupont, Veerle Vandendriessche and Wendy Wambacq for teaching me and helping me to improve my skills in clinical nutrition.
Of course I am also thankful to Daisy Liu, for the academic and personal support during my stay at the Nutrition lab, and for allowing me to follow and help with her PhD study and for all support and help writing the dissertation.
I would also like to thank to the teacher Pedro Lemos for the possibility to get to know and be in contact with this institution. I am also thankful to Marta Lourenço for her Portuguese happiness everyday in the laboratory and for her help with the statistic research.
To my dear job partner and friend Daniel, who contributed to make my experience warmer, I am very grateful to you. Since the warm welcome in Belgium to the last day of the internship, he proved to be a friend that I could always rely on.
I would also like to thank Ana Ulrich for her amazing work and her patience.
A special thanks goes to my “Portuguese family” (Filipe Teixeira, João Pereira, Pedro Mota and Pedro Relha) for being such good friends, and supporting me no matter what, during my stay.
Thanks to all my colleagues during my 6-year in Lisbon, I am lucky to have had all your support and motivation to never give up of the course. Special thanks for you girls (Andrea Pires, Carolina Magro, Inês Neves, Rita Assunção, Maria João Freitas, Margarida Paz) and Alex Conduto for everything. Also thanks to all who gave me support in all kinds of situations. I could not be more grateful to my family for allowing me to follow my dreams. This internship and dissertation would not have been completed without their support. Finally and most important, I thank my parents and my brother, my biggest support and inspiration in life. For helping me to become a better person each day, loving me and teaching me to love myself more, for believing in my capabilities, and for never questioning my career choices.
iii ABSTRACT:
INFLUENCE OF OVERWEIGHT ON ROUTINE PARAMETERS OF RENAL FUNCTION IN DOGS
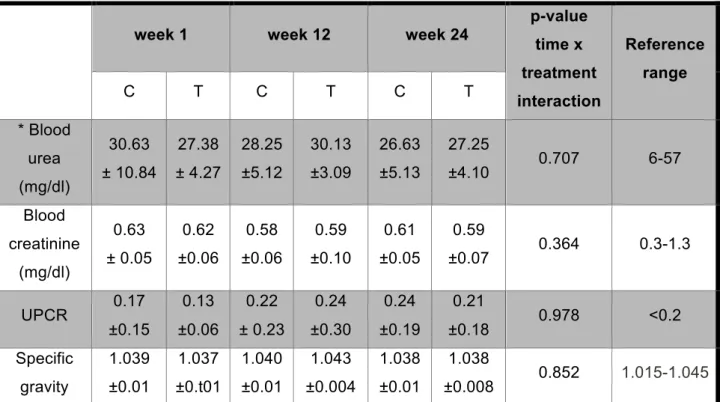
Obesity is one of the most common nutritional disorders in dogs and its prevalence has grown exponentially in recent years alongside with obesity in humans. It is from an accumulation of adipose tissue in such a way that it affects the patient health. In humans, a chronic increase of body weight is a risk factor to develop renal dysfunction. Therefore, the purpose of this study was to investigate the effect of weight gain on renal function in dogs. Renal function was determined using traditional markers of renal dysfunction (blood urea nitrogen and creatinine, urine specific gravity and urine protein-creatinine ratio). A total of 16 beagles were studied, 8 non-obese, which kept a stable ideal body weight, and the remaining 8, gradually increased weight for 24 weeks. Both groups were fed a commercial adult maintenance diet high in fat and protein. The obese group was fed 1.3 times more than the maintenance energy requirements, resulting in an average of 0.328 kg increase in weight per month. Renal markers were measured at times 1, 12 and 24 weeks and the results did not showed a significant difference between the groups. These results suggest that the degree of overweight that was achieved in this study did not cause renal dysfunction based on routine kidney markers.
KEY WORDS: obesity, overweight, canine, renal insufficiency, obesity-related glomerulopathy, proteinuria
iv RESUMO:
A INFLUÊNCIA DO EXCESSO DE PESO EM PARÂMETROS DE AVALIAÇÃO DA FUNÇÃO RENAL DE ROTINA
A obesidade, uma das doenças nutricionais mais comuns em cães tendo a sua prevalência crescido exponencialmente nos últimos anos, a par com a obesidade nos humanos. É uma doença crónica que advém do excesso de acumulação de tecido adiposo de tal forma que afeta a saúde. No homem, uma condição corporal aumentada é um fator de risco para disfunção renal. O objetivo deste estudo foi investigar o efeito do aumento de peso sobre a função renal em cães. A função renal foi determinada através de marcadores renais convencionais de insuficiência renal (ureia e creatinina sérica, densidade urinária, rácio proteína-creatinina de urina). Um total de 16 beagles foram usados, 8 não obesos que mantiveram um peso corporal estável, e os 8 restantes, que aumentaram progressivamente o peso durante 24 semanas. Ambos os grupos foram alimentados com uma dieta comercial de manutenção, rica em gordura e proteína. Ao grupo obeso foi fornecido 1,3 vezes mais que os requisitos energéticos de manutenção, fazendo com que este grupo aumenta-se 0,328kg mais por mês. Os marcadores renais foram medidos às 1, 12 e 24 semanas em ambos os grupos, não tendo demonstrado diferenças significativas, sugerindo que o grau de excesso de peso obtido neste estudo não causa alterações na função renal.
Palavras-chave: obesidade, excesso de peso, canideo, insuficiência renal, obesidade relacionada com glumerolopatia, proteinúria
v TABLE OF CONTENTS
Acknowledgements ... i
Abstract: ... iii
Resumo: ... iv
Table of Contents ... v
Tables index ... vii
Figures Index ... vii
List of abbreviations and symbols ... ix
Part I - Internship Report ... 1
Part II - Review on obesity/overweight and kidney dysfunction ... 3
I. Introduction ... 3
II. The Problem of Obesity ... 5
1 Defining the Problem ... 5
1.1 Definition of overweight and obesity ... Error! Bookmark not defined. 1.2 Prevalence of overweight and obesity ... 5
2 Diagnostic ... 6
2.1 Common clinical methods ... 8
2.1.1 Body weight and Relative Body Weight ... 8
2.1.2 Morphometric measurements ... 9
2.1.2.1 Skinfold thickness measurement ... 9
2.1.2.2 Dimensional evaluations ... 9
2.1.2.3 Body condition scores ... 10
2.2 Research techniques ... 13 3 Adipose tissue ... 14 3.1 Histology ... 14 3.2 Adipogenesis ... 15 3.3 Distribution ... 16 3.4 Physiological functions ... 16
3.5 Adipose tissue as an endocrine organ ... 17
4 Clinical risks associated with obesity in companion animals ... 19
4.1 Clinical evaluation, physiology ... 19
4.2 Anesthetic risk ... 19
4.3 Longevity ... 20
4.4 Endocrine and metabolic diseases ... 20
4.5 Cardiorespiratory changes and systemic hypertension ... 21
4.6 Traumatic and degenerative orthopaedic disorders ... 21
4.7 Effects on renal function and urinary tract disorders ... 22
vi
5 Pathophysiology of obesity ... 24
5.1 Energy balance ... 24
5.2 Physiological regulation of body weight ... 25
5.3 Risk factors ... 26
III. Physiopathology relationship between obesity and renal insufficiency ... 28
1 Renal function and assessment ... 28
2 “Hidden epidemic” ... 30
3 Pathophysiology of obesity-related Renal disease ... 31
3.1.1 Physical compression of the kidneys ... 32
3.1.2 Lipotoxicity ... 33
3.1.3 Systemic arterial hypertension ... 34
3.1.3.1 Sympathetic nervous system: ... 35
3.1.3.2 Leptin ... 35
3.1.3.3 Renin–angiotensin–aldosterone system ... Error! Bookmark not defined. 3.1.4 Low chronic inflammation state ... 38
3.1.5 Structural and functional changes of kidneys due to obesity ... 39
IV. Nutritional Treatment ... 42
1 Energy restriction ... 42
2 Dietary considerations ... 44
Part III – Study of the influence of overweight on routine parameters of renal
function in dogs ... 53
1 Materials and methods ... 53
1.1 Study design ... 53
1.2 Animals and diet ... 53
1.3 Measurements ... 55 1.3.1 Sampling procedure ... 55 1.3.1.1 Blood sample ... 55 1.3.1.2 Cystocentesis ... 55 1.4 Statistical Analysis ... 56 2 Results ... 56
2.1 Body weight during the experiment ... 56
2.2 Laboratory evaluation of renal function ... 58
2.3 Blood urea ... 58
2.4 Blood creatinine ... 59
2.5 UPCR ... 60
2.6 Urine specific gravity ... 61
3 Discussion and conclusion ... 63
vii TABLES INDEX
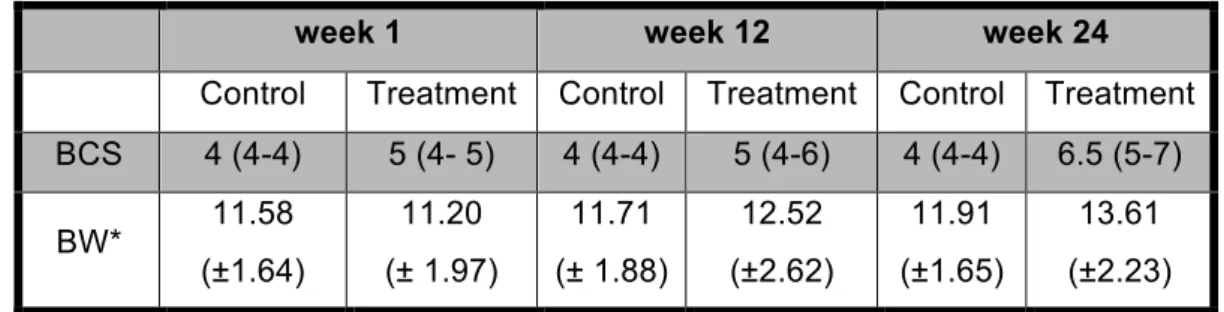
Table 1 - Methods for body composition analysis in dogs (adapted from German, 2006b) ... 7 Table 2 - Equations for converting morphometric measurements into fat mass percentages (Adapted from Mawby et al., 2004). ... 10 Table 3 - Guide to 9-point and 5-point Body Condition Scores in dogs (European Pet Food Industry Federation, 2013) ... 11 Table 4 – Summary of a weight loss programme for healthy overweight dogs (Michel et al., 2012) ... 44 Table 5 – Calculation of the daily energy requirement’s in the two groups ... 54 Table 6 – Analysed nutrient composition (%) of the experimental diet ... 54 Table 7 - Median and range of the body condition scores and average ± standard deviation of weight during the experimental period (week 0, 12, 24) ... 56 Table 8 – Average ± standard deviation results of renal markers weight during the experimental period (week 0, 12, 24) ... 58
FIGURES INDEX
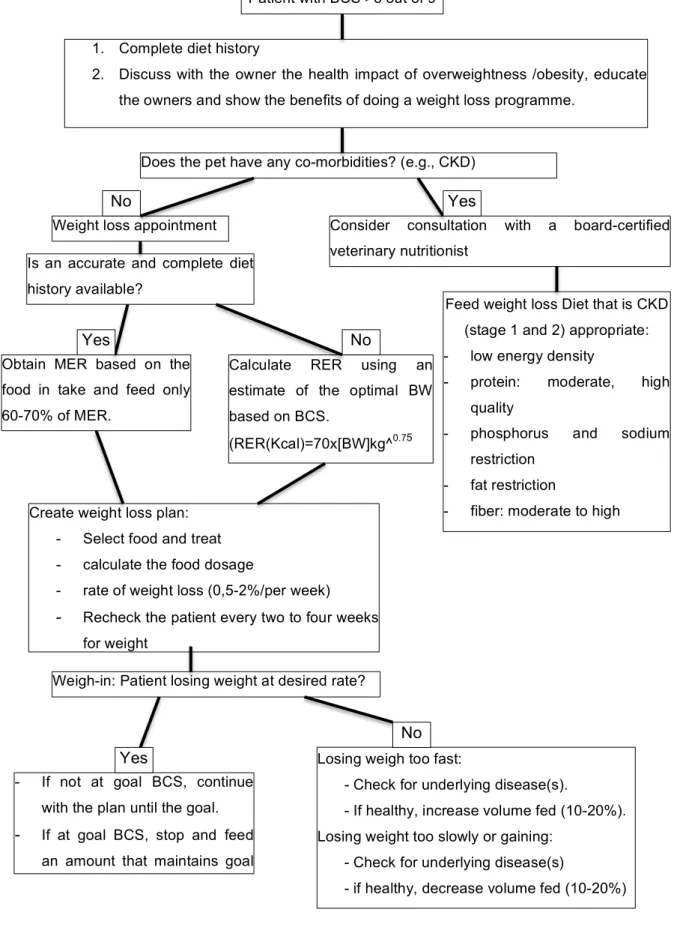
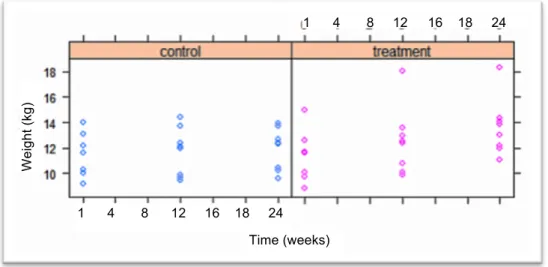
Figure 1 - Anatomical sites to measure zoometric variables in dogs (Adapted from Burkholder, 2000a). ... 10 Figure 2 - View of the biological function of adipose tissue (represented schematically by a single cell), secreting hormones such as cytokines and others. IL, interleukin; TNF-a, tumor necrosis factor-a; TGF-b, transforming growth factor-b (German et al., 2010a) ... 18 Figure 3 - Pathophysiology of the association between obesity and kidney disease. Adapted from Silva et al., 2017 ... 41 Figure 4 - Algorithm – Nutritional management of concurrent canine obesity (Bartoes & Barkitic, 2010; Linder & Parkers, 2016) ... 52 Figure 5 - Overview of the distribution dog weight (kg) results throughout the experimental period (measured at 0, 12 and 24 weeks), for all dietary treatments (each point represent a dog) ... 57 Figure 6 - Average weight (kg) for each dietary group, throughout the experimental period (measured at 0, 12 and 24 weeks) ... 57
viii
Figure 7 - Overview of the distribution of dog blood urea (mg/dl) results throughout the experimental period (measured at 0, 12 and 24 weeks), for all dietary treatments (each point represents a dog. ... 59 Figure 8 - Average dog blood urea (mg/dl) for each dietary treatment, throughout the experimental period (measured at 0, 12 and 24 weeks) ... 59 Figure 9 - Overview of the distribution dog blood creatinine (mg/dl) results throughout the experimental period (measured at 0, 12 and 24 weeks), for all dietary treatments (each point represents a dog) ... 60 Figure 10 - Average dog blood creatinine (mg/dl) for each dietary treatment, throughout the experimental period (measured at 0, 12 and 24 weeks) ... 60 Figure 11 - Overview of the distribution dog urine UPCR throughout the experimental period (measured at 0, 12 and 24 weeks), for all dietary treatments (each point represents a dog) 61 Figure 12 - Overview of dog urine specific weight throughout the experimental period (measured at 0, 12 and 24 weeks), for all dietary treatments (each point represents a dog) 62
ix LIST OF ABBREVIATIONS AND SYMBOLS ACE - Angiotensin-converting enzyme
ACVIM - American College of Veterinary Internal Medicine APOP - Association for Pet Obesity Prevention
APPA - American Pet Products Association BAT - Brown adipose tissue
BCM - Body cell mass BCS - Body condition score BMI - Body mass index BP - Blood pressure BW - Body weight
BUN - Blood urea nitrogen
CCAAT – Cytosine-cytosine-adenosine-adenosine-thymidine C / ebpα - CCAAT / enhancer binding protein α
CKD - Chronic kidney disease CRP - C-reactive protein
DER - Daily energy requirement
DEXA - Dual energy x-ray absorptiometry DM - Dry matter
ESRD - End-stage renal disease FM - Fat mass
FCR - Flat-coat retriever
GFR - Glomerular filtration rate GI - Gastrointestinal
IL - Interleukin
Inos - Nitric oxide synthase
IRIS - International Renal Interest Society Kcal - Kilocalories
Kg - Kilogram
LBM - Lean body mass
LDL – Low Density Lipoprotein LIM - Length of the lower leg ME - Metabolic energy
MER - Maintenance energy requirement MRI - Magnetic resonance imaging Nefas - Non-esterified fatty acids NO - nitric oxide
x NRC - National research council
OA - Osteoarthritis PK - Pharmacokinetic
PDSA - People’s Dispensary for Sick Animals % BF- Percentage of body fat
PPARY - Peroxisome proliferator-activated receptor y POMC - Pro-opiomelanocortin
RAAS - Renin–angiotensin–aldosterone system RBW - Relative body weight
RER - Resting energy requirement SDMA - Symmetric dimethylarginine SNS - Sympathetic nervous system TG - Triglycerides
TNF-α - Tumor necrosis factor alfa UK - United Kingdom
UPCR - Urine protein-creatinine ratio US - United States
USG - Urine specific gravity
VLDL - Very low density lipoproteins WAT- White adipose tissue
1 PART I - INTERNSHIP REPORT
As part of the Integrated Master’s Degree in Veterinary Medicine from the Faculty of Veterinary Medicine, University of Lisbon, I completed the internship with a total duration of six months. The internship took place in the Laboratory of Animal Nutrition, Department of Nutrition Genetics and Ethology, at the Faculty of Veterinary Medicine of the Ghent University, from the end of January to the end of June 2016. In this Laboratory work researchers from all over the world, who perform studies in the areas of nutrition, conduct food-related experiments with dogs, cats, chickens, ponies, pigeons and pigs for third parties, but also do nutritional analysis in the framework of services and clinic. Furthermore, the staff provides dietary advice to veterinarians, pet owners, businesses, government and other agencies. These include clinical consultations concerning dietetics. The main research themes of the lab are feed intake regulation and energy homeostasis, the impact of nutrition on intestinal microbiota and host physiology, the role of nutrition in immune competence and inflammatory diseases and the role of trace elements in the metabolism. I had the opportunity to experience a new working environment and interact with highly dedicated scientists on a daily basis. The atmosphere was friendly and people were welcoming, which contributed to a memorable experience.
During these months, I performed tasks in the area of clinical nutrition of small animals, under the supervision of Prof. Dr. Myriam Hesta. My supervisor also gave me permission to follow her nutritional advice consultations as well as nutrition classes with other master students at the hospital. I also had the pleasure to work with Daisy Liu, who gave me the opportunity to follow and help in her PhD research about the effect of obesity on renal function in dogs. Based on this study I was able to develop and write my Master’s dissertation about the “Influence of overweight and obesity on some parameters (creatinine, blood urea nitrogen (BUN), urine protein\creatinine ratio (UPCR) and specific gravity) of the renal function in dogs”.
With the support from resident students Veerle Vandendriessche and Wendy Wambacq and the teaching assistant Sophie Dupont, and based on our weekly meetings and the nutrition clinical cases they gave me to resolve, I was able to gain a broad range of skills in a short period of time. I performed literature review and analyzed different clinical nutrition cases in dogs and cats in the literature to include in my project. I gained valuable knowledge on interpreting the nutritional necessities in different life stages and also in different disease stages, and how nutrition can treat specific disease conditions such as allergies or food intolerances, nephrology bladder stones. I also learnt, at an advanced level, to understand and be more critical about commercial feed, and I improved my English language skills considerably.
2
In summary, this internship, with its challenges and opportunities, contributed for the successful conclusion of this dissertation.
3
PART II - REVIEW ON OBESITY/OVERWEIGHT AND KIDNEY DYSFUNCTION
I. Introduction
In recent years, obesity has become an escalating global problem in humans. It has become a significant worldwide health epidemic, especially in developing countries, and is already considered the disease of the twenty-first century (WHO, 2016). The World Health Organization (WHO) estimates that 39% of adults (aged 18 years and over) were overweight in 2014, and 13% were obese (WHO, 2016). In 1980 the numbers were quite different, with 23.2% of the population being overweight and only 5.4% were effectively obese (WHO, 2016). This means that the prevalence of obesity more than doubled between 1980 and 2014 (WHO, 2016). The same is happening with our pets: the prevalence of pet obesity is increasing (German, 2006a; Raffan, 2013; Sandøe, Palmer, Corr, Astrup & Bjørnvad, 2014).
This health problem is not just the accumulation of large amounts of adipose tissue, but is also associated with important metabolic and hormonal changes in the body (Zoran, 2010). Obesity also leads to a reduction in longevity in dogs. A study carried out with a group of 48 Labrador retrievers showed that the group with dietary restriction remained leaner and lived longer (median lifespan of 13 years compared to 11.2 years for the moderately overweight group) (Kealy, et al., 2002; Lawler et al., 2005; Osto & Lutz 2015). Obesity in humans is widely recognized as a risk factor for cardiovascular disease and for various metabolic disorders such as type II diabetes and hypertension, but also kidney diseases (German, 2006a). Actually, increases in chronic kidney disease (CKD) prevalence have paralleled increases in the prevalence of overweight and obesity in humans (Hall et al., 2014). However, studies have indicated that even in the absence of diabetes type II or systemic arterial hipertension, which together account for more than 75% of all cases of end-stage renal disease (ESRD), obesity itself can contribute to kidney damage or has a negative impact on the progression of renal disease (Griffin, Kramer & Bidani, 2008; Hall et al., 2014).
Similar relationships may hold true for dogs. However, there isn’t an evident correlation between obesity and kidney disease yet in this species. Experimentally induced obesity in dogs performed by Henegar et al. (2001) showed that blood pressure, pulse rate, glomerular filtration rate (GFR) and renal plasma flow were all significantly higher in obese versus non-obese dogs. Also, at histological analyses the kidney structure of obese dogs demonstrated enlarged Bowman’s space, increased glomerular cell proliferation, increased mesangial expansion and thickened basement membranes, and increased expression of renal transforming growth factor (TGF). However, the glomerulosclerosis scores for obese
4
versus lean dog kidneys were not statistically different (Henegar et al., 2001). In another study that was performed with obese pet dogs in a weight-loss program showed that the increased levels of biomarkers of renal injury (homocysteine, cystatin, and clusterin) and the increased urine protein to creatinine ratios improve after weight-loss (Tvarijonaviciute et al., 2013). Based on this assumption, the present master dissertation consists primarily of a critical evaluation of the pathogenic potential of obesity, which may be responsible for the development of progressive renal disease in obese dogs, irrespective of other common obesity-related diseases. Knowledge of obesity/overweight as a risk factor for renal disease can heighten awareness and target health screening of dogs. And with more evidence from canine research studies as a tool, practitioners may be able to advocate more strongly for obesity prevention and weight reduction plans for their clients' pets.
The present dissertation is divided into 3 parts: the first is a brief description of the completed internship; the second part includes a review of the literature on the problem of overweight and obesity in dogs and the effect of overweight on renal function with focus on the possible pathophysiological mechanisms, and in the final of this part there is also a briefly discussion about the nutritional concerns when a dog has obesity and renal insufficiency; the last part aims to demonstrate the study and the results of the study in question, as well as the discussion of then.
5 II. The Problem of Obesity
Due to the emphasis on dogs as respected and valued members of society, the goals of canine nutrition, defined as longer life, higher quality of life and better performance, are now similar to that of human nutrition (Toll, Yamka, Schoenherr & Hand, 2010). Besides this positive factor, nowadays, it is also more and more common to see pet owners consider their pets as family members (Toll et al., 2010). This human-animal bond is characterized by an excessive anthropomorphic or anthropocentric behavior. Food and other factors play an important role in this relationship, and are responsible for the most common nutritional disorder in companion animals in industrialized countries, obesity (Kienzle, Bergler & Mandernach, 1998). This chapter will approach the problem of obesity in dogs, showing its dimension in our society, as well as the factors that can predispose dogs to this problem and the consequences that it can bring.
1 DEFINING THE PROBLEM
1.1 Definition of overweight and obesity
Obesity has been defined as excessive fat accumulation that may result in a significant impairment of health, and is the most common nutritional disorder in companion animals (National Institutes of Health. 1985; German, 2006a; Zoran, 2010; Laflamme, 2006). This state of energy imbalance is due to excessive dietary intake or inadequate energy utilization (German, 2006a). Accumulation of fat is achieved by increasing the number of fat cells (hyperplastic obesity) and/or due to increasing the size of fat cells (hypertrophic obesity) (Burkholder & Toll 2010). Body composition studies of dogs indicate that animals judged to be in ideal body condition have 15 to 25% body fat (Laflamme, 1997; European Pet Food Industry Federation, 2013). When body fat exceeds 30-40%, the animal is considered obese, while the excess of 25-35%, the animal is considered overweight (Burkholder et al, 2010; European Pet Food Industry Federation, 2013).
1.2 Prevalence of overweight and obesity
Recent years have seen a drastic increase in the rates of overweight and obesity among humans living in developed countries (German, 2006a; Zoran, 2010; Sandøe et al, 2014). The worldwide prevalence of obesity in adults aged 18 years and over more than doubled between 1980 and 2014 (WHO, 2016). The reported prevalence in dogs in several studies in United States of America (USA), Europe and Australia was between 22 percent and 44
6
percent, although there are differences in prevalence in the literature that may reflect differences in sampling (e.g., who has been asked (owners or vets) or local variations) (Sandøe et al., 2014; McGreevy et al., 2005; Robert & Reither, 2004). In dogs, some investigators agree that the prevalence of pet obesity is increasing in a similar fashion to human obesity (German, 2006a). In 2016, in USA, the Association for Pet Obesity Prevention (APOP) has estimated that 53.9% of USA dogs are overweight or obese, which was 1.4% more than in 2012 (Association for Pet Obesity Prevention, 2016). This means, in 2015, 41.9 million US dogs were estimated to be overweight or obese, from a total 77.8 million US dogs, according to American Pet Products Association (APPA) source data from 2016 (Association for Pet Obesity Prevention, 2016). In the United Kingdom (UK), another new report from People's Dispensary for Sick Animals (PDSA) Animal Welfare estimates that around 40% of dogs in the UK are thought to be overweight or to obese, and that the proportion of overweight pets will continue to rise (PDSA Animal Welfare, 2017).
In general, specialists agree that the nutrition-related disorder most seen in companion animals nowadays is the excess weight gain (Sandøe et al., 2014). This statistic is clinically relevant since obesity is not only a huge accumulation of adipose tissue but also involves important changes at the metabolic and hormonal level in the body (Sandøe et al., 2014). Therefore, there is clinical relevance for deciding whether the animal has an ideal, overweight or obese body condition since these two last scenarios might negatively affect an animal’s health. Although, there is no ideal method to evaluate the body condition, many different methods exist.
2 DIAGNOSTIC
In the common routine most of the veterinarians diagnose obesity only through visual inspection. The subjectivity inherent in this practice makes this a method less sensitive from a clinical perspective. The assessment of body composition using objective measurements can identify and quantify excess of body weight (BW) and can set an optimal weight. Methods that estimate of the correct percentage of body fat (% BF) are the most accurate procedure to diagnose obesity (Toll et al., 2010; Laflamme, 2006; Case, Carey, Hirakawa & Daristotle, 2000).
Diagnosis of overweight and obesity in humans is relatively simple, requiring only measurement of height and weight to calculate body mass index (BMI) (BMI >25 is overweight) (WHO, 2016). In dogs, due to body conformation variations across breeds, the variation of frame size within breeds and age variation, the diagnosis of overweight and obesity is more difficult (German, 2006b). There is no ideal, definitive method for deciding whether a dog is in a thin, ideal, overweight or obese body condition (Toll et al., 2010;
7
German, 2006b). Many different systems have been developed for the measurement fat mass (FM) and lean body mass (BM) in companion animals, but few have been validated for use as routine tests due to some lack of accuracy, price or practicability (Toll et al., 2010; German, 2006b). These systems can also be classified into two categories: the clinically relevant techniques and the research techniques (Table 1). The next sections will discuss some of these techniques in detail. The most widely adopted procedures in the clinical routine are the quantitative procedures, namely the BW measurement combined with body condition score (BCS), which is preferred above other morphometric methods (Toll et al., 2006; German, 2006b; Elliott, 2006a).
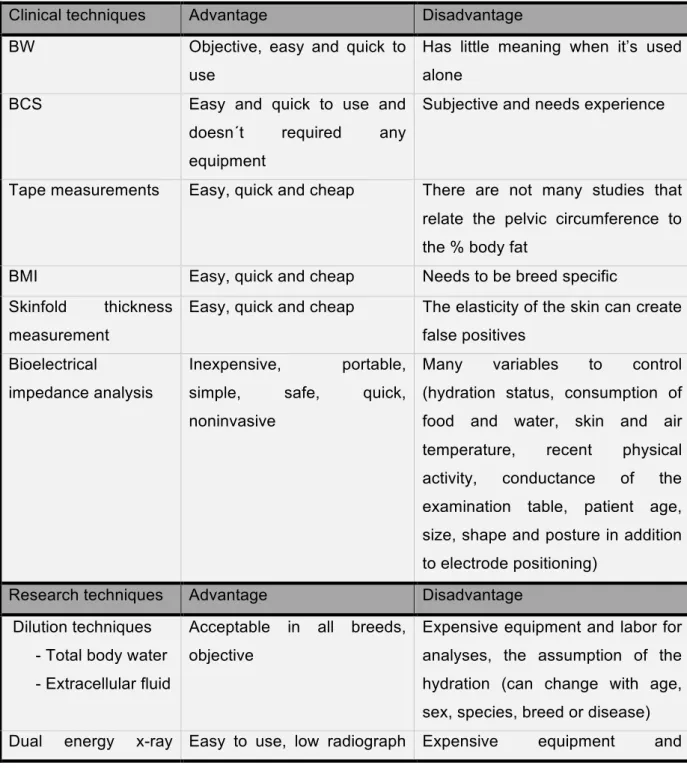
Table 1 - Methods for body composition analysis in dogs (adapted from German, 2006b)
Clinical techniques Advantage Disadvantage
BW Objective, easy and quick to use
Has little meaning when it’s used alone
BCS Easy and quick to use and
doesn´t required any equipment
Subjective and needs experience
Tape measurements Easy, quick and cheap There are not many studies that relate the pelvic circumference to the % body fat
BMI Easy, quick and cheap Needs to be breed specific Skinfold thickness
measurement
Easy, quick and cheap The elasticity of the skin can create false positives
Bioelectrical
impedance analysis
Inexpensive, portable, simple, safe, quick, noninvasive
Many variables to control (hydration status, consumption of food and water, skin and air temperature, recent physical activity, conductance of the examination table, patient age, size, shape and posture in addition to electrode positioning)
Research techniques Advantage Disadvantage
Dilution techniques - Total body water - Extracellular fluid
Acceptable in all breeds, objective
Expensive equipment and labor for analyses, the assumption of the hydration (can change with age, sex, species, breed or disease) Dual energy x-ray Easy to use, low radiograph Expensive equipment and
8 absorptiometry
(DEXA)
radiation exposure, accurate for limb lean and fat
specialized radiology technician required and also anesthesia.
BW (body weight); BCS (body condition score); BMI (body mass index); DEXA (Dual energy x-ray absorptiometry
2.1 Common clinical methods
The combination of BW and BCS has been used to define criterion for canine obesity, because these parameters are easier to measure than body fat (Freeman, et al., 2011).
2.1.1 Body weight and Relative Body Weight
A complete physical exam should include an assessment of BW. BW is the simplest technique and it provides an approximate measure of the total energy stored in the body (Elliott, 2006a). Although BW by itself distinguish say if the patient is overweight, underweight, or in ideal body condition, when it's used complementarily with another method it´s very useful, e.g., BCS (German, 2006b; Burkholder, 2000a; Case et al., 2000). Furthermore, BW can vary from day to day, so it is important to use the same method for an individual animal each time to avoid more external variation (German, 2006b; Burkholder, 2000a; Case et al., 2000).
Relative body weight (RBW) in terms of an animal’s ideal weight has been selected as a criterion for diagnosing obesity since it is easier to measure BW than body fat (Burkholder, 2000a; Case et al., 2000). RBW is the ratio between the current weight an animal and its estimated optimal weight (Burkholder, 2000a; Case et al., 2000). An overweight dog’s RBW range is on average between 10 and 20% above the optimal weight and for obese dogs it is 20% or more above the ideal weight (Toll et al., 2010; Burkholder, 2000a). Although easy to apply, this method presents some critical issues. Establishing an optimum weight is a challenging task for the veterinarian. Domestic canids are the most diverse mammalian species in terms of weight and body size. Burkholder (2000a) suggest that BW is recorded when the animal reaches adulthood as a reference. Most dogs reach adult weight at 12 months, and large breeds may reach it only at 18 months (e.g. Bernese Mountain, Bullmastiff, Dogue de Bordeaux) (Hand et al., 2010). Nonetheless, if an animal does not have access to nutrition that satisfies their nutritional needs during growth, mature adult weight may not match their optimal weight. In cases of pure breeds, the American Breeder Club establishes the averages of optimal weights, although even in the same breed the optimum weight may differ 25% or more (Toll et al., 2010). Thus, determining the optimal weight requires some care.
9 2.1.2 Morphometric measurements
Morphometry is a technique that comprises of a set of simple, economic and non-invasive procedures to assess body composition using different body parameters (German, 2006b; Toll et al., 2010, Eliiot, 2010). According to German (2006b), there are 3 main methods, which are the BCS, the measurement of skinfold thickness and the dimensional evaluations.
2.1.2.1 Skinfold thickness measurement
This morphometric analysis is based on the relationship between the thickness of subcutaneous fat layer and total body fat (Elliott, 2006a). It is widely used in humans to calculate the %BF from measurements of the thickness of the subcutaneous fat layer that lies between the dermis and muscle (Elliott, 2006a). In dogs, this layer is deposited in significant quantities in the thoracic region, the lumbar, coccygeal areas and the intra-abdominal region, usually with a higher fat deposition in the lumbar region (Toll et al., 2010). Unfortunately, the skin in dogs is easily detached from the subcutaneous adipose tissue making skinfold measurement impractical and unreliable in this species (Elliott, 2006a).
2.1.2.2 Dimensional evaluations
Dimensional evaluations estimate mathematically and statistically the %BF by the measurements of various anatomic circumferences and lengths (Fig.1) (Elliot, 2010). Waist circumference measurement in humans, a simple and practical procedure, is an approximate index of intra-abdominal fat and total %BF (WHO, 2000). Burkholder (2000a) refer to two studies that show that the measurement of pelvic circumference in dogs is proportional to the amount of fat and that this is the dimension that alters the most with increasing weight, like in humans (Burkholder, 2000a). In these studies they measured diferents parts of the animal’s body and convert this measurements into a equation (tablet 2) to estimate the percent body fat. The choosen measures to creat these equation was the height at the shoulder (HS) measured in centimeters and the pelvic circumference (PC) at the level of the flank measured in centimeters too. The pelvic circumference measurements is the one who change most with weight gain in the dogs. The reasonable correlation existed between the %BF calculations (using gender-specific or gender nonspecific equation) was determined by DEXA (Burkholder, 2000a; Mawby et al., 2004). However, to obtain reliable results of %BF through the equations, the dog cannot exceed the weight limits of the studied groups (7.3 to 34.5 kg) and the %BF limits obtained (from 1% to 33%).
10
Because of the variaion in body types among breeds these measurements may not always correlate well with %BF (Burkholder, 2000a; Mawby et al., 2004). Despite this, the advantage of these evaluations is that they would be helpful to convince the owners that their animals are indeed overweight and in need of weight loss (Burkholder, 2000a; Mawby et al., 2004).
Figure 1 - Anatomical sites to measure zoometric variables in dogs (Adapted from Burkholder, 2000a).
Table 2 - Equations for converting morphometric measurements into fat mass percentages (Adapted from Mawby et al., 2004).
Dogs
Gender specific formula:
% BF in males = -1.4 (HS in cm) + 0.77 (PC in cm) + 4 % BF in females = -1.7 (HS in cm) + 0.93 (PC in cm) + 5
Non-gender specific formula:
% BF in both sexes = -0.0034 (HS in cm)2 + 0.0027 (PC in cm)2-1.9 / BW(kg)
BF – body fat; Cm – centimeters; HS- hock stifle; PC- pelvic circumference at the level of the flank; BW – body weight; Kg – kilogram
2.1.2.3 Body condition scores
BCS is a semi-quantitative but subjective method for evaluating body composition, particularly the percentage of body fat, and for estimating the degree of over- and underweight (Freeman et al., 2013; European Pet Food Industry Federation, 2013; Michel, 2012; Elliot, 2010; Toll et al., 2010; German, 2006b; Burkholder, 2000a).
This scoring system requires prior training and observer experience to carefully follow the criteria that are defined, which are the visual assessment of the pet and palpation to assess body fat over the ribs, abdomen, lumbar area, and tail base (Freeman et al., 2013;
pelvic circumference
11
European Pet Food Industry Federation, 2013; Elliot, 2010; Toll et al 2010). Various systems of 3-, 5-, 6- and 9-points were proposed (Elliott, 2006a; Hand et al., 2010). The two most common in clinical practice are 5- (Edney and Smith, 1986) and 9-point systems (Laflamme, 1997), where the classification for ideal body condition is 3 and 5, respectively. The most widely accepted and validated system is the 9-point system (European Pet Food Industry Federation, 2013; Hand et al, 2010; German et al. 2006; Burkholder, 2000a; Laflamme, 1997). Laflamme (1997) demonstrated a good correlation between BCS and %BF measured with DEXA, a noninvasive technique that can be used to estimate body composition, in which for each unit increase in BCS on a nine-point scale there is approximately 5% increase in body fat (Burkholder, 2000a). Moreover, studies show good concordance between BCS measurements from diferent experienced observers (Raffan et al., 2006; Mawby et al., 2004).
Table 3 shows the BCS (9-point and 5-point system) in dogs, including a description of the palpation location and the corresponding percentages of body fat as well as the increase or decrease of BW under or above optimal BW. Using the BCS in conjunction with BW gives a clinician a more complete perspective on a patient’s body condition and provides a good basis for determining energy requirements (Michel, 2012; Burkholder, 2000a). The combination of these two measures can be extremely helpful for owners that usually do not recognize if their animal is overweight or obese and thus may contribute to the success of weight-loss programmes (Toll et al., 2010).
Table 3 - Guide to 9-point and 5-point Body Condition Scores in dogs (European Pet Food Industry Federation, 2013) (page 11-13)
Score Location Feature Estimated body fat (%) % BW below or above BCS 5 9 points 5 points 1 Emaciated 1
Ribs and bony prominences are visible and easily palpable with no fat cover. Severe abdominal tuck when viewed from the side and an exaggerated hourglass shape when viewed from above. Tail base prominent, raised bone structures with no tissue between the skin and bone. Obvious loss of muscle mass and no discernible body fat.
≤4% - ≥40%
2
Very Thin
Ribs and bony prominences are visible and easily palpable with no fat cover. Severe abdominal tuck, when viewed from the side
12
Continued from page 11 (11-13)
2 Very Thin
and a marked hourglass shape when viewed from above. Tail base prominent, raised bone structures with no tissue between the skin and bone. Minimal loss of muscle mass.
4-10% - 30-40%
3
Thin 2
Ribs and bony prominences are easily palpable with minimal fat cover. Marked abdominal tuck when viewed from the side and an obvious waist when viewed from above. Tail base raised bony structures with little tissue between skin and bone.
5-15% - 20-30%
4 Slightly underweight
Ribs and bony prominences are easily palpable with minimal fat cover. Abdominal tuck when viewed from the side, and a well-proportioned waist when viewed from above. Tail base raised bony structures with little subcutaneous tissue.
10-20% - 10-15%
5
Ideal 3
Ribs and bony are not visible, but easily to palpable with thin layer of fat, as well other bony prominences are palpable with a slight fat cover. Abdominal tuck is present when viewed from the side, and a well-proportioned lumbar waist when viewed from above.
Tail base smooth contour or some thickening, bony structures palpable under a thin layer of subcutaneous fat.
15-25% 0%
6 Slightly overweight
Ribs and bony prominences can be felt under a moderate fat cover. Abdominal tuck and waist are less pronounced. Tail base smooth contour or some thickening, bony structures remain palpable under moderate layer of subcutaneous fat. 20-30% +10-15% 7 Overweight 4
Ribs and bony prominences can be felt under a moderate fat cover. Little abdominal tuck when viewed from side or waist, and back slightly broadened when viewed from above. Tail base Smooth contour or some thickening,
13
Continued from page 12 (11-13) 7
Overweight 4
bony structures remain palpable under
subcutaneous fat. 25-35% +20-30%
8 Obese
Ribs and bony prominences are difficult to palpate, under a thick fat cover. Other bony prominences are distended with extensive fat deposit. Tail base appears thickened, difficult to palpate bony structures. General ventral bulge under abdomen, no waist, and back markedly broadened when viewed from above. Fat deposits over lumbar area and neck.
30-40% +30-45%
9 Grossly
Obese 5
Ribs and bony prominences are very difficult to feel under a thick fat cover between bone and skin.
Tail base appears thickened, bony structures almost impossible to palpate.
General pendulous ventral bulge under abdomen, no waist, back markedly broadened when viewed from above.
Fat deposits over lumbar area, neck, face, limbs and in the groin. A dip may form on the back when lumbar and thoracic fat bulges dorsally.
>40% +>40%
2.2 Research techniques
Body fat can be accurately measured by other sophisticated techniques, e.g. dilution techniques, bioelectrical impedance analysis, computerized axial tomography, magnetic resonance imaging, total organic determination of potassium and DEXA (German, 2006b). Often, these methods are expensive and require specialized equipment and/or general anesthesia and are not practical or available for clinical applications (German, 2006b; Elliot, 2010). DEXA is a noninvasive and quick technique to measure the bone mineral, whole body fat, and non-bone lean mass (Son, d’Avignon & Laflamme, 1998). Because it is easily adaptable for use in small animals, it has been extensively studied and used to determine an accurate estimation of body composition in dogs (Toll, Gross, Berryhill & Jewell, 1994; Munday, Booles, Anderson, Poore & Earle, 1994; Mawby et al., 2004;). This x-ray technique uses photons of two different energy levels (70 and 140 kVp) (Mawby et al., 2004). These two different energy levels cross differently through the bone, the muscle and
14
the fat, (Elliott, 2006b), which allows one to calculate the mineral density, the lean mass and the fat mass with a high degree of precision (Toll et al., 1994; Munday et al., 1994; Elliott, 2006b). However, this technique is neither practical nor economical for common use in veterinary clinics, because dogs must be sedated or anesthetized for the procedure and requires expensive initial set-up costs and experienced personnel to interpret results (Gosselin, Wren & Sunderland, 2007; Lauten, Cox, Brawner & Baker, 2001).
3 ADIPOSE TISSUE
Adipose tissue has been considered throughout the years as a diffuse and wrongly defined tissue with as main role the storage of energy in the form of triglyceride, and insulation and protection of other body organs. Nowadays, adipose tissue is considered to be a much more complex organ containing a variety of cell types (Zoran, 2010; German, Ryan, German, Wood & Trayhurn, 2010a). In this chapter, a brief overview of the characteristics of adipose tissue (histology, distribution and physiology) and new perspectives of this tissue will be given.
3.1 Histology
Adipose tissue is a special kind of conjunctive tissue which, although containing adipocytes as the most prevalent cells (about 50%), comprises of various others types of cells, including pre-adipocytes, mesenchymal stem cells, fibroblasts, endothelial cells, pericytes, and immune cells such as macrophages, dendritic cells, mast cells, granulocytes and lymphocytes, as well as nerve cells bound to the autonomic nervous system (Haugen & Drevon, 2007; Sethi & Vidal-Puing, 2007; Sharkey, 2007; Prins, 2002). The primary and popular classification of adipose tissue divides this tissue into two types: white adipose tissue (WAT) and brown adipose tissue (BAT) (Zoran, 2010; Joazeiro, 2008; Haugen et al., 2007).
WAT is characterized by cells that contain only a droplet of fat and whose colour, depending on the type of diet, can range between white or yellowish, which is due to accumulation of carotenes dissolved in fats (Joazeiro, 2008). These adipocytes can accommodate much larger lipid droplets than any other cell type (Haugen et al., 2007). These cells have a considerable capacity for expansion and when filled with lipids they become spherical (Joazeiro, 2008). In one mature white adipocyte the lipid droplet comprises approximately 85% of the cellular volume, and the nucleus and other organelles are usually compressed against the cell membrane (Haugen et al., 2007; Joazeiro, 2008). Therefore, they differ in size, having diameters of up to 100 µm, which is larger than most
15
other cell types (Haugen et al., 2007). Although considered unilocular lipid droplets, when viewed under the electron microscope these cells also have, in addition to the main lipid droplet, much smaller droplets, however devoid of surrounding membrane (Joazeiro, 2008). BAT is different from WAT because of the presence of multilocular lipid droplets, whose colour is due to the abundant vascularization and numerous mitochondria present in the cytoplasm (Joazeiro, 2008; Haugen et al., 2007). This tissue is actively involved in thermogenesis and is found in higher proportions in neonates (Haugen et al., 2007; Joazeiro, 2008).
However, in obesity multiple changes occur in the adipose tissue. In obesity an excess of caloric intake causes the adipose depots to expand (Fuster, Ouchi, Gokce, Walsh, 2016). This expansion is mediated by an increase in adipocyte numbers (hyperplasia) and an enlargement of adipocyte size (hypertrophy) (Fuster et al., 2016). The hyperplasia is mediated by the formation of functional adipocytes (adipogenesis) (Fuster et al., 2016). In contrast, adipocyte hypertrophy typically leads to lipid-laden, dysfunctional adipocytes that undergo cell death and contribute to adipose tissue inflammation and dysfunction (Cildir, Akincilar, Tergaonkar, 2013). These quantitative and qualitative changes in the cellular composition of adipose tissue are mainly composed of mononuclear cells, such as macrophages, the most abundant immune cell in the adipose tissue of obese individuals (Cildir et al., 2013). Studies in animals demonstrate that adipose tissue expansion is accompanied by macrophage infiltration, and switch in macrophage activation to a more proinflammatory state, and also high expression of inflammatory cytokines (Weisberg et al., 2003; Lumeng, Bodzin, Saltiel, 2007). Also, there is recruitment of T cells, B cells, macrophages, neutrophils, and mast cells that are increased in visceral adipose tissue of obese individuals or diet-induced obese mice (Cildir et al., 2013). By contrast, specific subsets of T cells – helper T cell type 2, regulatory T cell, and invariant natural killer T cell – and eosinophil numbers are decreased in the obese adipose tissue (Cildir et al., 2013).
3.2 Adipogenesis
Stem cells and pre-adipocytes play an indispensable role in the expansion of adipose tissue that occurs in obesity (Fischer-Posovaszky et al., 2007). These cells are recruited when existing adipocytes reach a critical level of hypertrophy, and consequently in adipose tissue hyperplasia (Trujillo & Scherer, 2006). The peroxisome proliferator-activated receptor y (PPARy) and the CCAAT / enhancer binding protein α (C / EBPα) are the main regulators of adipogenesis (Sethi et al., 2007).
16 3.3 Distribution
WAT is mainly distributed between the subcutaneous and visceral compartments. The subcutaneous level forms the adipose panicle, a layer disposed between the dermis and the muscular layer. At the visceral level, the deposits are located at the thoracic (mediastinal) and abdominal (omental, mesenteric, perirenal, retroperitoneal, parametrial, periovaric and epididymal) levels (Sharkey, 2007; Trujillo et al.,2006). In humans, the pathologic consequence of obesity is mainly influenced by the deposition of fat into visceral deposits instead of subcutaneous deposits (Saisho et al., 2013; Kley, Caffall, Tittle, Ferguson, Hoenig 2008). This phenomenon has been called metabolic syndrome in humans, and is associated with abdominal obesity (accumulation of visceral adipose tissue), blood lipid disorders, inflammation, insulin resistance or type II diabetes, and increased risk of developing cardiovascular disease (Ader et al., 2014; Hoenig, Traas & Schaeffer, 2013). Similar symptoms have been reported in dogs too (Hoenig, Pach, Thomaseth, Devries & Ferguson, 2012; German et al.,2009 ). However, a true metabolic syndrome has not described, which may be due to differences in risk factors for cardiovascular disease and blood lipid abnormalities (Hoenig et al., 2012; German et al.,2009).
BAT has a more limited and residual distribution in the adult, surrounding most of the vital organs (heart, kidney, aorta, circulatory routes, among others) (Sharkey, 2007; Trujillo et al.,2006).
3.4 Physiological functions
There are various functions of adipose tissue that make it a vital organ. In addition to the classical functions of adipose tissue, including thermal insulation (fats are poor heat conductors) and mechanical protection, adipose tissue is recognized mainly because of the large energy storage in the form of triglycerides (Zoran, 2010; Sharkey, 2007; Prins, 2002). During periods of increased ingestion and/or decreased energy expenditure, the surplus energy is effectively stored in WAT in the form of lipids, mainly triglycerides (TG). These are hydrolysed in free fatty acids (FFA) and glycerol by the action of lipoprotein lipase. These FFA penetrate into the adipocytes and are transported, intracellular, through the fatty acid binding proteins. They are activated on Acyl-CoA and esterified in the endoplasmic reticulum in different classes of lipids like TG, phospholipids and cholesterol esters. Subsequently, these energy reserves are used by the body in situations of caloric restriction, physical exercise and between meals, in order to meet the energy needs of other organs (Haugen et al., 2007; Beylot, 2007).
17
The mobilization of TGs is made from lipolysis (hydrolysis of intracellular TG), which results in the release of glycerol and fatty acids. Glycerol is used at the gluconeogenesis level to synthesize new glucose molecules. Fatty acids are circulated in the form of non-esterified fatty acids (NEFAs), transported by albumin, which will later be used by muscles (oxidation), liver [complete CO2 oxidation, incomplete ketone bodies, synthesis of TG, secretion and storage of very low density lipoproteins, (VLDL)] and adipose tissue (re-esterification of fatty acids), for example (Haugen et al 2007; Beylot, 2007). In normal conditions the adipocyte has the capacity to integrate a significant number of hormonal and nervous signals, in order to maintain an adequate balance between synthesis (lipogenesis) and catabolism (lipolysis) of TG, responding to the physiological needs (Haugen et al., 2007; Sethi et al., 2007). In addition, the adipocyte is able to limit an abnormal plasma increase of NEFAs (Haugen et al 2007; Lafontan, 2005). The adipose tissue also stores cholesterol and fat-soluble vitamins, in particular vitamins D and E (Sethi et al., 2007).
3.5 Adipose tissue as an endocrine organ
Previously, it was believed that adipose tissue was a relatively inert tissue primarily responsible for the storage of excessive energy in the form of TG (Sethi, Antonio & Vidal-Puig, 2007). However, beginning in 1994 with the discovery of leptin, a regulator of energy homeostasis, it has become clear that adipose tissue is a metabolically active organ (Sethi et al., 2007). The white adipose tissue (WAT) is now recognised as an active endocrine organ (Fig. 2) that communicates with the brain and peripheral tissues by secreting several hormones and protein factors, termed adipokines (Trayhurn, 2005). This term is restricted only to the proteins secreted by adipocytes themselves, and this way exclude all the other proteins secreted by other cells that exist in WAT such as macrophages (Trayhurn & Wood, 2004). Over the last 10 years, there have been over 100 different adipokines have been discovered and characterised in humans and rodents (German et al., 2010). Adipokines act centrally to regulate appetite and energy expenditure, and peripherally affect insulin sensitivity, oxidative capacity, and lipid uptake (Gray & Vidal-Puig, 2007). Nevertheless, as a dynamic organ, the adipokine profile changes in response to the amount and condition of adipose tissue (Gray & Vidal-Puig, 2007).
Adipokines include classic cytokines (e.g., TNFα, IL-6), antigenic factors, growth factors, and proteins involved in vascular homeostasis, regulation of the arterial pressure (eg., Angiotensinogen), lipid metabolism, homeostasis of glucose (eg. adiponectin), the complement system, as well as proteins of the acute phase and response to the stress (Trauhurn & Beattie, 2001; Trayhurn et al., 2004; Haugen et al., 2007).
One of the most well know adipokines and best characterized in dogs is leptin and it’s secretion by the adipocytes is proportional to fat mass, which means in obese individuals
18
plasma levels are higher (regardless of race, gender and age) and decreases with weight loss (Considine et al. 1996; Ishioka et al., 2002). Experimentally induced obesity in dogs demonstrated that the increased fat mass, with increased BCS, resulted in measurable increases in serum leptin and the reduction in fat mass showed the opposite (Ishioka et al., 2007; Ishioka et al., 2002).
Leptin acts in multiple centers in the central nervous system (CNS), especially at the hypothalamic level (Kershaw & Flier, 2004). The primary action of leptin is to regulate the energy balance by decreasing appetite and stimulating energy expenditure (thermogenesis) (Rahmouni et al., 2005; Mathieu, Poirier, Pibarot, Lemieux & Després, 2009). Specifically, leptin acts on the nervous system to increase satiety (Kershaw et al., 2004). However, in obese humans and pets, the higher leptin concentrations do not seem to suppress appetite, leading to a hypothesis of leptin resistance (Nishii et al., 2006; (Vazquez-Vela, Torres, Tovar, 2008). Leptin resistance can be explained by several mechanisms, including defects in leptin transport across the blood–brain barrier by the saturation of the transport systems for leptin (Caro et al., 1996), impaired neuronal leptin signaling in target neurons (Munzberg, Flier, Bjorbaek, 2004) or altered signaling in downstream target cells and neuro-circuits (Faouzi et al., 2007). This leptin resistance is selective: peripheral leptin receptors continue to function and this may be important in the pathogenic metabolic effects of hyperleptinemia that occurs in obesity such as the chronic activation of the SNS and consequently hypertension that occurs in obesity and will be discussed in chapter III (Margetic, Gazzola, Regg, Hill 2002).
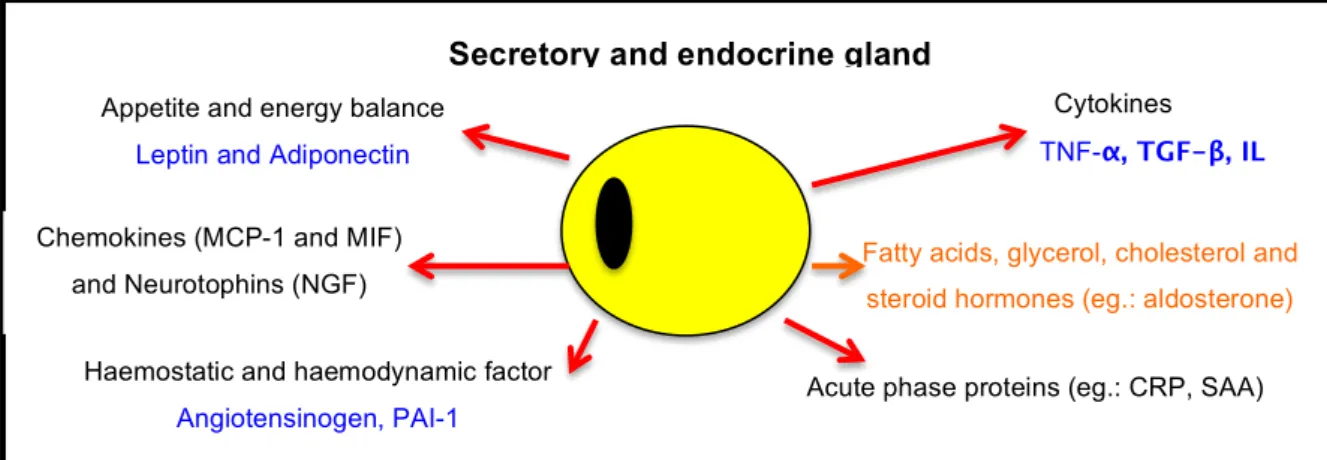
Figure 2 - View of the biological function of adipose tissue (represented schematically by a single cell), secreting hormones such as cytokines and others. (German et al., 2010a)
MCP-1 monocyte chemoattractant protein-1; MIF, macrophage migration inhibitory factor; NGF, nerve growth factor; IL - interleukin; TNF-a - tumor necrosis factor-a; TGF-b - transforming growth factor-b; PAI-1
plasminogen activator inhibitor-1; CRP- C-reactive protein; SAA - serum amyloid A
Secretory and endocrine gland
Cytokines
TNF-α, TGF-β, IL
Acute phase proteins (eg.: CRP, SAA) Haemostatic and haemodynamic factor
Angiotensinogen, PAI-1
Appetite and energy balance
Leptin and Adiponectin
Fatty acids, glycerol, cholesterol and steroid hormones (eg.: aldosterone)
Chemokines (MCP-1 and MIF) and Neurotophins (NGF)
19
4 CLINICAL RISKS ASSOCIATED WITH OBESITY IN COMPANION ANIMALS
In humans, obesity has detrimental effects on health and increases mortality risk (WHO 2000). The diseases associated with or exacerbated by obesity arise from two mechanisms: metabolic changes associated with excess fat and the increase of fat mass itself. Obesity is not just a pathological state of overweight, adipose tissue is now recognised as an active endocrine organ having local, peripheral and central effects by secreting adipokines, as mentioned in the previous section (Trayhurn et al., 2004). On the other hand, the increase of fat mass induces physico-mechanical changes (Osto et al., 2015; German et al., 2010a; Sandøe, 2014). Like humans, dogs are also susceptible to the many and varied health consequences of obesity that we will approach now in the following section.
4.1 Clinical evaluation, physiology
In general, clinical evaluation is more difficult in an obese dog compared with a dog with ideal body condition. Physical examination of an obese patient, namely, chest auscultation, abdominal palpation and complementary diagnostic tests, especially ultrasound, are difficult to implement due to excess adipose tissue. Blood collection techniques, cystocentesis and aspiration of peripheral lymph nodes are also problematic (German, 2006b).
4.2 Anesthetic risk
As in obese humans, weight excess affects most vital organs of the obese dog as changes occur in cardiovascular, respiratory and metabolic systems (Diez & Nguyen, 2007; Love & Cline, 2015). In human medicine, anesthetic drugs are administered according to lean BW to avoid over- or under- dosing (Diez et al., 2007; Love et al., 2015). However, the risk varies with the type and dose of anaesthetic used and the duration of the surgery (Diez et al., 2007; Love et al., 2015). The major risks are an overdose of anesthetic and the prolongation of the recovery period due to the storage in body fat of soluble anesthetics in the lipids. Obesity has effects on pharmacokinetic (PK) parameters (bioavailability, volume of distribution, and clearance) because of the changes in body composition, circulating and extracellular volume, organ perfusion, and the compromise on ventilatory capacity (Love et al., 2015; Michel et al., 2012). A study performed by Boveri, Brearley, and Dugdale (2013) compared the effect of body condition on propofol requirements in dogs and demonstrated that overweight dogs required a lower IV propofol dose per kg of total body mass to allow tracheal intubation than did normal BCS animals. This suggests that IV anaesthetic doses
20
should be calculated according to lean body mass like humans (Boveri, Brearley & Dugdale, 2013).
Other risks are associated with concomitant disorders, which are common in these patients, such as cardio-respiratory disorders (Diez et al., 2007) that lead to an increase in mortality after surgery in obese patients (Love et al., 2015).
4.3 Longevity
Obesity leads to a reduction in longevity in dogs, as was shown in one study (Kealy et al., 2002). In the study, 48 Labrador retrievers divided in two randomly selected groups, 24 dogs for the treatment group and the other 24 for the control group, were used to evaluate the effects of 25% diet restriction on the average life expectancy (Kealy et al., 2002). The dogs in the group with dietary restriction remained leaner and lived longer; the median lifespan was 13 years while the group without restriction was 11.2 years (Kealy et al., 2002).
4.4 Endocrine and metabolic diseases
Several endocrinopathies are associated with obesity, such as insulin resistance in dog and humans or diabetes type II in humans (Lund, Armstrong, Kirk & Klausner 2006; Mattheeuws, Rottiers & Kaneko, 1984), and hyperlipidemia (Park, Lee & Oh, 2014; Jeusette, Lhoest, Istasse & Diaz, 2005).
Pancreatic βcells, in the Langerhans islets, are responsible for the secretion of insulin, which manages uptake and use of glucose in peripheral tissues (Michel et al., 2012). In humans, the constant excess of calories ingested leads to decreased tissue sensitivity to insulin (i.e. become ‘insulin resistant’) (Michel et al., 2012; German, 2006b). There is a positive correlation between plasma concentrations of insulin and BMI in humans (Michel et al., 2012; German, 2006b). In overweight dogs this obesity-induced insulin resistance and hyperinsulinemia has also been reported (Gayet et al., 2004). However, the degree of insulin resistance associated with diet-induced obesity appears to be dependent on age, with older dogs being more insulin-resistant than young dogs (Serisier et al., 2008a). Weight-loss leads to a recovery of insulin sensitivity and decreased insulin concentrations (Diez et al.,, 2004; Yamka et al., 2006a). Contrary to obese humans, insulin resistance in obese dogs does not spontaneously progress to type II diabetes mellitus (Verkest, Fleeman, Rand & Morton, 2011; Verkest, Fleeman, Rand & Morton, 2012).
Beside insulin resistance, obesity is one of the principal causes of hyperlipidemia in dogs. Even with moderate obesity the levels of serum triglycerides and total cholesterol are higher than lean dogs (Pena, Suarez, Bautista, Montoya & Juste, 2008; Jeusette, et al., 2005).
21
Both alterations are reversed by weight loss (Jeusette et al., 2005). The long-term effects of hypertriglyceridemia observed during obesity have been associated with an increased risk of acute necrotizing pancreatitis in humans (Kota & Jannula, 2012). For dogs this association has been proposed as a risk factor for pancreatitis, however, further studies have to be performed to assess cause and effect relationships (Osto et al., 2015, Weeth, 2016).
4.5 Cardiorespiratory changes and systemic hypertension
Obese dogs have an increased prevalence of cardiovascular disease in the form of congestive heart failure (Edney et al., 1986). The adverse effects of obesity on left ventricular function can be explained by three mechanisms: an increased plasma volume which increases ventricular preload, hypertension that raises left ventricular afterload, and alterations in the myocardial genome that result in systolic and diastolic dysfunction (Diez & Nguyen, 2010; German, 2006b; Diez et al., 2007). Increased blood pressure has been documented in overweight and obese dogs (Bodey & Michell, 1996; Montoya et al., 2006; Mehlman, et al., 2012). The largest study of blood pressure in dogs to date showed that the obesity effectively increases the blood pressure, however this increase was small (5 mmHg), and insufficient to lead to clinical consequences (Bodey et al., 1996). Another early study showed similar alterations (Remillard, Ross, Eddy & 1991). The American College of Veterinary Internal Medicine (ACVIM) has considered the effects of obesity on blood pressure as small and the prevalence of hypertension as very low (Brown et al.,, 2007.). However, obese dogs have left ventricular hypertrophy (Mehlman et al., 2012), which is reversible with weight loss (Neto, Brunetto, Sousa, Carciofi & Camacho, 2010.; Pelosi, Rosenstein, Abood & Olivier, 2013).
Obesity can also exacerbate, aggravate or be responsible for several respiratory diseases. The most notable examples are laryngeal paralysis and brachycephalic airway obstruction syndrome that are aggravated by obesity (German, 2006b; Diez et al., 2007; White & Williams, 1994). Obesity also exacerbates heatstroke and there is a high risk of tracheal collapse development in dogs (German, 2006b). The main symptoms in obese patients are exercise intolerance and shortness of breath (Toll et al., 2010).
4.6 Traumatic and degenerative orthopaedic disorders
Dogs with overweight have a high risk to develop traumatic and degenerative orthopedic disorders (Edney et al., 1986; Michel et al., 2012; German, 2006b). There is a greater osteoarthritis (OA) severity in dogs with BCS above ideal (Toll et al., 2010). An improvement of OA in obese dogs was demonstrated with weight loss of 6.1% onwards,
22
with a decrease of lameness (Marshall et al., 2010). The mechanical stress due to the weight increase appears to be the major factor associated with this relationship and to be a predisposing factor in humeral condylar fractures, cranial cruciate ligament rupture and herniated disc (Case et al., 2000; German, 2006b). Because there is also a strong association between obesity and severity of OA in others joints such as the hand joint in humans that are not a mechanically stressed, it has been questioned whether obesity has only a strictly mechanical impact (Frye, Shmalberg & Wakshlag, 2016). These findings led to further interest in the inflammatory mediators released from adipose tissue (e.g., cytokines IL-6 and TNF-a, and the adipokines leptin, visfatin, adiponectin, and resistin) (Frye et al., 2016). A recent study in humans, was performed to find the role of BW in the pathogenesis of osteoarthritis (OA) and the results have suggested that obese adipokine concentration, mainly the adiponectin, in synovial fluid may contribute to the metabolic changes associated with OA (Gross, Guillaume & Gegout-Pottie, 2014). However, which adipokines and their exact role in osteoarthritis are still unclear (Frye et al., 2016). In dogs there is paucity of information about the relationship of adipokines with osteoarthritis, and unlike in people, would be even more difficult because all major affected joints are weight bearing (Frye et al., 2016)..
Besides the fact that orthopedic problems can be cause by obesity, these orthopaedic disorders alone predisposes these individuals (humans and dogs) to be less active, which is a risk factor for obesity and thus requires an adaptation of energy intake in order to prevent overeating and excess weight and avoid the aggravation of the pathology (Michel et al., 2012; Toll et al., 2010; German, 2006b).
4.7 Effects on renal function and urinary tract disorders
In humans, obesity is known as a risk factor for CKD due to the fact that prolonged obesity can cause structural and functional changes in the kidney (e.g., greater kidney weight, higher plasma renin activity and insulin concentration, high arterial pressure and high GFR, an expanded bowman´s capsule, increased mesangial matrix, and increased thickened glomerular and tubular membranes (Chang, Ryu & Choi, 2016; Zhang & Lerman, 2015; Griffin et al., 2008). In a prospective cohort study with 62,249 metabolically healthy persons performed by Change the risk for CKD the results demonstrated that persons with BMI of overweight and obese (23 to 24.9 kg/m2, and 25 kg/m2 or greater, respectively) were associated with an increased incidence of CKD, with an incidence rate of 2.9 cases per 1000 person-years for overweight and 3.6 for obese compare with the 2.1 for normal weight (Chang et al., 2016).
In dogs, experimentally induced obesity resulted in increased arterial pressure (+12 +/- 3 mmHg) and high levels of plasma renin activity, which can alter the renal function and