Surface Modification of Ti6Al4V Alloy by Pulsed Lasers: Microstructure and Hydrophobic
Behavior
Milton Sérgio Fernandes de Limaa*, Ivan Almeidaa
Received: February 23, 2017; Revised: August 01, 2017; Accepted: August 17, 2017
In many aerospace applications, it is important to produce hydro-repellent surfaces because water and ice accumulation could lead to malfunctioning of the part or component with a potential critical failure. In this study, it was investigated the texturing of a titanium alloy (Ti6Al4V) by applying a pulsed
Nd:YAG laser, aimed at the surface characterization by microscopy, X-ray diffraction, roughness and
nano-indentation tests as well as free fall drop test. The experimental procedure aimed to understand the
influence of three variables: (N) the number of laser runs 1, 2, 5 and 10; (V) laser speeds of 25, 50 and 100 cm/s and (P) laser power of 5, 10 and 20 W on the microstructure and the hydrophobic behavior.
The Vickers hardness and elastic modulus of laser processed surfaces were similar to the untreated
surfaces. When the number of the laser runs (N) increased, a TiO phase amount increases as a result
of increasing heat input. The measured roughnesses decreased with increasing P as a direct result of
remelting. As the number of runs (N) increases the surface became more and more flat, consequently
the overlapping runs induced polishing of the titanium surfaces. The mean roughness Ra attained 0.23
µm after 10 runs at V=100m/s and P=10W, compared to Ra=0.41 µm of the virgin surface. The water repellent conditions were N1V50P05, N1V100P05, N2V25P05, N2V50P05, N5V25P05, N5V50P05, N5V100P10 and N10V25P10. These conditions were associated with a homogeneous remelted layer, low power, partial superposition of the laser shots of 50% or 75%, and a surface finish slightly rougher
than the original material.
Keywords: Texturing, Laser, Titanium, Hydrophobicity.
*email: [email protected]
1. Introduction
In recent years, laser processing of materials has become an engineering solution to enable the development
of advanced materials and consequently of great relevance
in coating and surface treatment applications. In contrast to other conventional processes, light sources are tools with numerous advantages, especially due to the possibility of precise control of the applied energy. Some of the surface
modifications with the use of lasers are shown in Figure 11. The nature of the interaction between light and matter and
the flexibility of changing of the processing parameters
permits the very precise tuning of the morphology and structure, allowing reaching the desired behavior, from the atomic scale to the macro dimensions.
The principle of the laser surface treatment is basically the result of the interaction among the coherent light beam, the high energy density, the substrate nature and the surrounding atmosphere. The high laser energy density implies the occurrence
of the light absorption that causes thermal effects, such as heating, melting or vaporization, or athermal effects, such
as peening (Figure 1). The mechanisms of these interactions
are influenced by several factors, such as wavelength, beam
intensity, surface absorptivity and temperature.
Among the most studied laser processes, the laser texturing is one of the most relevant for surface engineering. In the early 90s, magnetic disk drives had been laser textured for increasing the magnetic response between disk and driver2,3.
Other applications of laser texturing include mechanical tools
with superior tribological behavior4,5, surface preparation before adhesive bonding6,7 and surface functionalization of implants8.
Even though the Nd:YAG laser has been used in many studies of titanium alloy implants8, a more detailed study
about the influence of laser parameters on the microstructure
and wettability is missed in the literature. Nevertheless, Goetz et al.8 found that very rough surfaces, e.g. with 200 µm wide pores, are the best for osseointegration of Ti6Al4V prosthesis. These rough surfaces are hydrophilic by nature,
because the spread of the cells requires large wetting. Other
uses of Ti6Al4V, including aerospace, sports and medical instruments, demand the converse behavior, i.e. hydrophobic surfaces. Two good examples are the leading edge of the wings that must be icephobic9 and the surgical instruments
which could slip off the hands when wet. Although the
literature for laser textured hydrophobic Ti6Al4V already exists10, they are limited in terms of the number of possible laser variables and also the correlation between the surface roughness, chemistry and mechanical behavior.
Figure 1. Laser surface treatments1.
The present study intends to investigate the effect of
various laser texturing strategies in the roughness, surface structure, hardness, elastic modulus and the water wettability of a Ti6Al4V alloy substrate, thus contributing to the
understanding of the effect of laser processing in the final product annealing at 955ºC for 1 h and aging at 620ºC for 2 h.
2. Experimental
The material used in this work was the class 5 titanium
alloy, called Ti-6Al-4V, furnished in the form of an
as-annealed (950°C/1h) and aged (620°C/2h) 1-mm thick
plate. The chemical composition, provided by the company Realum Indústria e Comércio de Metais Puros e Ligas Ltda, is shown in Table 1.
Table 1. Weight percent (wt.%) of each element in the current alloy.
C Fe O N H Al V Ti
0.018 0.17 0.17 0.010 0.007 6,10 4,00 rest
The laser was a Nd:YAG source of Coherent Co., model Corona®, working on the green emission mode (532 nm). The maximum laser output power was 20 W, with a pulse repetition rate ranging between 1 and 25 kHz and a beam quality (M2) of 36. For the current study, the pulse repetition
rate (f) was fixed at 1 kHz and the pulse length (tp) was 100 ns.
The beam delivery system comprised a scanning head composed by a collimator, two galvanometric-mounted
mirrors and a flat-field lens for focusing. The working
distance between the lens and the material surface was 200
mm. Under the current optical configuration, the minimal spot radius (R) was 50 µm at the focal position. The beam
speed was controlled by a computer and can be selected from 1 mm/s to 1 m/s.
The experiments were designed to change three independent variables: laser power (P), scanning speed (V) and the number of runs (N). This later one is the number of the laser processing cycles. The laser power divided by
the pulse frequency (f) gives the energy of each laser shot.
The pulse overlap (S) between adjacent pulses is given by
Equation (1)11:
(1)
fR
V
S
1
2
=
-After some trial outs to decide the range of process parameters to be studied, the following parameters were
found: P = 5, 10 and 20 W; V = 25, 50 and 100 mm/s and N = 1, 2, 5 and 10 runs. As described in Equation (1), the pulse superposition for V25, V50 and V100 were 75%, 50% and 0%, respectively. The lateral shift was fixed at S = 0% with a displacement of 100 µm
after each row.
The procedure for laser texturing includes cutting of
Ti6Al4V sheets in squares of 20 mm edges, slight grinding using a 600-mesh SiC paper, washing up, ethanol rising and drying using a heat gun. Each Ti6Al4V square was placed
normal to the optical axis and the process was carried out
accordingly to a specific P, V and N combination.
After texturing each surface was observed in optical
microscopy using a Zeiss Imager2® microscope. Some specific areas were observed using a Hitachi TM3000®
scanning electron microscope.
Nanohardness measurements of the surfaces were
carried out by an Anton Paar equipment model NHT, using
a Berkovich indenter. The maximum load was 100 mN with the same loading and unloading rate of 200 mN/min and a pause of 10 seconds. The associated indentation
method was due to Oliver&Pharr12 for both hardness and elastic modulus evaluations. Each sample was indented ten times. The standard deviation of the measures was
10%, as evaluated using the untreated surface. When the
roughness was too high, some measures fails or present unreliable values and then the measures were repeated
until the deviation of the population was below or equal to 10%.
The textured surface roughness was measured using
a a Holmes TR200 Digital Surface Roughness Tester®.
The roughnesses of the samples were measured six times
for each square. The arithmetic average of absolute
roughness, Ra, and the vertical distance from the highest
peak to the lowest valley within five sampling lengths,
Rz, were evaluated.
X-ray diffraction equipment is an Ultima IV Rigaku with a copper anode with Bragg-Bretano configuration. The fraction of phases obtained from the diffractograms
followed the Relative Intensity Ratio13 algorithm of the Rigaku software PDXL.
The wettability of the treated surface was measured according to Furmidge formalism14. The sample surface
was placed on a bench 55° inclined with respect to a needle
contained distilled water. A water drop of exactly 12 mm3
free fell 7 mm before touching the surface. A high definition
camera recorded the event and allows to divide the samples
in two cases. On one hand, if the liquid drop, or part of it,
became attached to the surface, it is called here a hydrophilic
surface. On the other hand, if the liquid drop bounced and
fell away from the surface, it is called here hydrophobic or
3. Results and Discussion
3.1 Topography and roughness
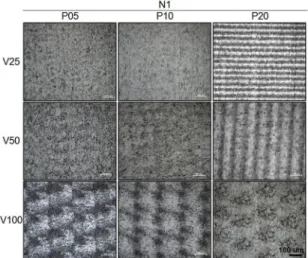
Figure 2 presents the surfaces produced at different
power (P) and speed (V) levels for a single run (N1). The
topographic features are visible under the same magnification. The surfaces obtained at low power, 5 and 10 W, and low speeds, 25 and 50 mm/s, presented homogeneous molten-like
topography. For the same speed levels, but increasing the
laser power to 20 W, the laser marks are more visible since
ablation occurred in the laser track direction. Under high laser speeds, V100, discrete laser shots are visible in all three powers (Figure 2), because the superposition between each
laser pulse was 0%, according to Equation (1).
Figure 2. Evolution of the surface topography for one run of the
laser (N=1) and different power (P) and speed (V). The scales are
the same.
The roughness of the surfaces are influenced by the laser
processing as presented in Table 2. The standard deviation
of all data was considered as 10%. Considering the initial (unlasered) surface roughness Ra = 0.41±0.05 µm and Rz =
2.3±0.2 µm. For the sake of understanding, Ra and Rz values below the base material reference are marked light gray in
Table 2. When the measured roughness is above this level, it
is marked dark gray. Rougher surfaces were produced when the laser has enough energy to produce discrete craters. This
effect occurred at N1V50P5 and N1V100P5 because the laser became unstable in 5 W and produced smaller spots. The same result was not visible at N1V25P5 because the high superposition (S=75%, Equation 1) hindered this feature. A
relatively rough surface was also observed in N1V100P20 because of the same reasoning. In other conditions, such as
N1V100P10, N1V25P20 and N1V50P20, the Ra roughness
was slightly below the reference value Ra~0.34 µm because of surface remelting.
Table 2. Average values of Ra and Rz for each experimental condition after one run N1 (in µm).
N1 P5 P10 P20
Ra Rz Ra Rz Ra Rz
V25 0.38 2.25 0.38 2.45 0.34 1.77
V50 0.55 3.01 0.43 2.60 0.34 2.01
V100 0.56 3.13 0.32 1.99 0.53 3.63
Until now the analyses concern a single run (N1). With an increasing number of runs the effects of roughening or polishing
of the Ti6Al4V become nonlinear. A previous surface run could increase the laser absorptivity due to texturing or by oxidation.
Different laser powers could induce different oxide types, growth behavior or thicknesses. Additionally, subsequent runs could raise the substrate temperature, which affects both the laser absorptivity
and the oxide evolution. Disregarding all these complications, it
is important to evaluate the surface quality and roughness of the
material because sometimes the operator makes several laser runs.
One practical explanation for this is because every workpiece surface comes with different finishing, and thus some laser runs are necessary to standardize the final result.
Two laser runs (N2) results are similar to a single run (N1) in terms of topography, as comparing Figure 3a and Figure 2.
Four conditions, N2V25P05, N2V25P10, N2V50P05 and N2V50P10, presented a homogeneous surface melting. When the power was raised to 20 W, N2V25P20 and N2V50P20,
the laser track is more visible because the superposed shots
produce a groove in the scan direction. When V = 100 mm/s,
the void between each laser pulse produced a discrete pattern. All these features are visible in Figure 3a.
As a consequence of many laser runs, N5 and N10
presented in Figure 3b and Figure 3c, the laser tracks became
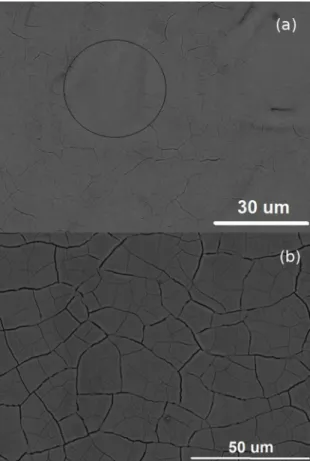
more visible. After 10 runs, all the surfaces, but condition P5, presented visible parallel tracks. It was verified that 5 W is low level for an effective use of the Nd:YAG for texturing,
because the laser pulses became unstable, i.e. its intensity varies from one shot to another. A region of a discrete laser interaction was encircled in Figure 4a. Although the experimental measured spot diameter was 100 µm, the circle measures only 30 µm in diameter. This reduced diameter is due to the unstable laser cavity operation at low power, such
as 5 W, thus producing a small interaction.
Titanium oxide was evident in all lasered surfaces and its thickness changed from one condition to another. Figure 4
shows the scanning electron microscope images for N2V25P05 and N10V25P20. Oxide craquelure is visible in both images, but more pronounced for N10V025P20, Figure 4b, because
of the higher laser power and the number of passes. As shown in Figure 4a, the laser shots transfer their
pattern to the substrate. The effect of superposed laser
Figure 3. Evolution of the surface topography for N2, N5 and N10 using different power (P) and speed (V). The scales are the same.
Figure 4. Scanning electron images of the laser treated surfaces:
(a) N02V025P05 and (b) N10V025P20. The circle represents a
single laser shot.
the variation between the crests and the peaks is above the
original roughness and is typically related to the Rz value. On
the other hand, the ablation mechanism combines remelting
and partial vaporization of the substrate, thus flattening the
original surface imperfections if they are not excessive.
Table 3 presents the values of Ra and Rz for each surface
after 2, 5 and 10 runs. The white cells are those values similar to the unlasered surface, Ra = 0.41±0.05 µm and
Rz = 2.3±0.2 µm. Similarly to Table 2, light gray cells are polished surfaces and dark gray are rough surfaces, compared to the original material values (white cells).
The roughening effect of superposed laser shots was observed for a laser power of 5W with N2V100P5 and N5V25P5, as
presented in Table 3. A rougher than the original surface,
related to the Rz-value, was also noticed in N10V25P05 and N10V50P05. At low laser power levels, such as 5 W, the laser pulses become unstable, i.e. each laser pulse is different
from the other in terms of power distribution and transversal
electromagnetic mode (TEM). Therefore, the origin of roughened
surface, dark gray cells in Table 3, may be correlated to an
unstable ablation process. On the other hand, for power levels of 10 W or 20 W the surface became polished, excepting for N10V50P10. The polishing effect of superposed laser shots
has been reported in the literature as well15.
3.2 Surface structure
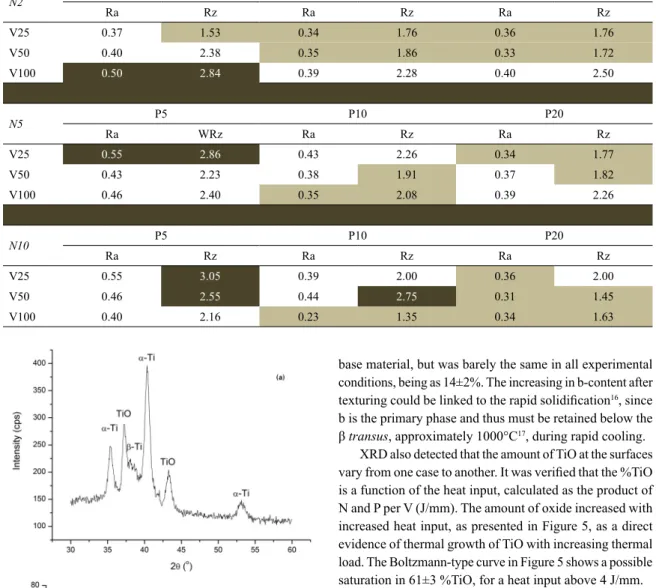
Table 3. Average values of Ra and Rz for each experimental condition after N=2, 5 and 10 (in µm).
N2 P5 P10 P20
Ra Rz Ra Rz Ra Rz
V25 0.37 1.53 0.34 1.76 0.36 1.76
V50 0.40 2.38 0.35 1.86 0.33 1.72
V100 0.50 2.84 0.39 2.28 0.40 2.50
N5 P5 P10 P20
Ra WRz Ra Rz Ra Rz
V25 0.55 2.86 0.43 2.26 0.34 1.77
V50 0.43 2.23 0.38 1.91 0.37 1.82
V100 0.46 2.40 0.35 2.08 0.39 2.26
N10 P5 P10 P20
Ra Rz Ra Rz Ra Rz
V25 0.55 3.05 0.39 2.00 0.36 2.00
V50 0.46 2.55 0.44 2.75 0.31 1.45
V100 0.40 2.16 0.23 1.35 0.34 1.63
Figure 5. (a) X-ray diffraction spectrum of the sample in condition N10V50P10. (b) Influence of heat input in the amount of titanium
oxide on the textured surface.
the original material. The β-Ti amount of the base material was 11.5%, as evaluated by X-ray diffraction (XRD). After laser processing the amount of β-Ti was higher that the
base material, but was barely the same in all experimental
conditions, being as 14±2%. The increasing in b-content after texturing could be linked to the rapid solidification16, since b is the primary phase and thus must be retained below the
β transus, approximately 1000°C17, during rapid cooling.
XRD also detected that the amount of TiO at the surfaces vary from one case to another. It was verified that the %TiO
is a function of the heat input, calculated as the product of N and P per V (J/mm). The amount of oxide increased with
increased heat input, as presented in Figure 5, as a direct evidence of thermal growth of TiO with increasing thermal load. The Boltzmann-type curve in Figure 5 shows a possible saturation in 61±3 %TiO, for a heat input above 4 J/mm.
3.3 Surface mechanical properties
Figure 6 shows the values of Vickers hardness (HV) and elastic modulus (E) for each experimental condition. The base material hardness was 410±70 HV and elastic modulus was 110±10 GPa. The hardness value is slightly higher than those reported in the literature18 due to the nanoindentation method. The large variation in both values is due to the
presence of two phases, α and β, with different mechanical
properties. The distribution of HV and E seems random around the base material values and, with few exceptions, the elastic properties of the laser treated material is similar
to the base material. Consequently, the laser processing did
not change the mechanical behavior of the textured part.
3.4 Water drop test
As discussed before, the water drop test evaluates if a water droplet bounces away from the surface just after
Figure 6. Values of the Vickers hardness (HV) and elastic modulus (E) for each sample, compared to the base material values. The error bars apply to all data.
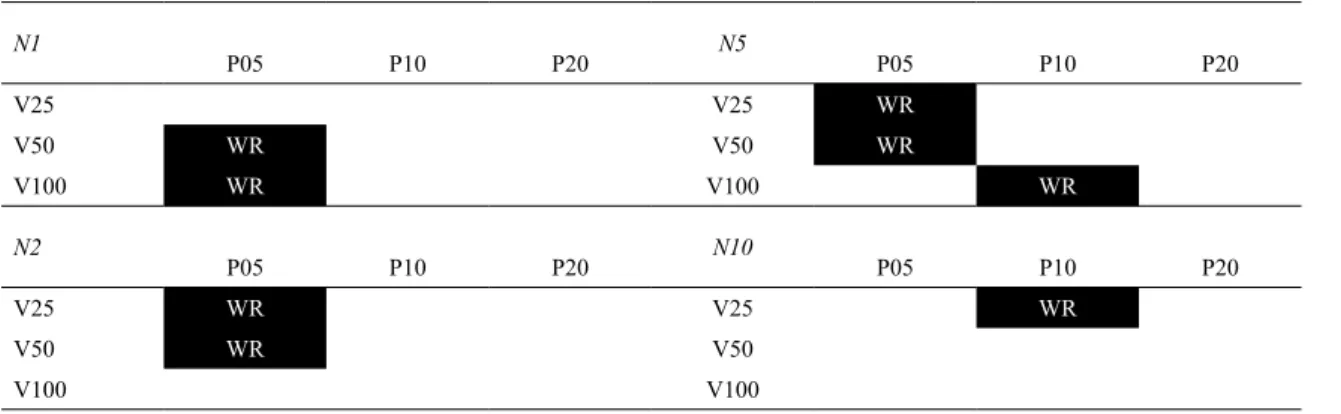
Table 4. Water drop test results for each sample. WR is for the Water Repellent conditions.
N1 N5
P05 P10 P20 P05 P10 P20
V25 V25 WR
V50 WR V50 WR
V100 WR V100 WR
N2 N10
P05 P10 P20 P05 P10 P20
V25 WR V25 WR
V50 WR V50
V100 V100
Table 4 presents the results for each N, P and V combination.
Six of nine surfaces treated using 5 W laser power and with a number of runs between one and five presents hydrophobic behavior. Using a 10 W laser power only N5V100P10 and N10V25P10 presented water repellent characteristics. When
comparing Table 4 to Tables 2 and 3, it could be concluded
that a rougher surface is preferable for WR than a polished one. Moreover the water repellent conditions present an
average hardness and elastic modulus (Figure 6) similar to
the base Ti6Al4V unlasered material. WR characteristics
were independ of the presence, or not, of a measurable oxide
coating (Figure 5).
4. Conclusions
100 mm/s, the discrete shots on the surface were visible
and, at low speeds and high power, i.e. 25 or 50 mm/s and 20 W, the trail marks were noticeable. Some experimental evidence indicated 5 W processing power was unstable
from the laser side.
The texturing strategy reflected on the measured roughness. Considering the initial values of Ra = 0.41±0.05 µm and Rz
= 2.3±0.2 µm, the textured surfaces could be polished or roughened. The minimum values of roughness were 0.23 µm
(Ra) and 1.35 µm (Rz) for N10V100P10 and the maximum values were 0.53 µm (Ra) and 3.63 µm (Rz) for N1V100P20. The amount of β phase in the laser textured surface was slightly higher than the base material, 14±2% compared to 11.5%, because of rapid cooling.
A TiO layer was detected by X-ray diffraction after
texturing. It was estimated that the thickness of the oxide increased with increased heat input up to the limiting value of 61 J/mm. Here, the heat input was considered as the product of N and P divided by V.
The surface mechanical behavior, hardness (HV) and elastic modulus (E) in indentation, are similar to the base
material. Therefore, it is not forecast any influence of the
laser texturing on the part mechanical characteristics. Some results scattered around the reference values, but more related
to the different characteristics of α and β phases.
The water repellent conditions were N1V50P05, N1V100P05, N2V25P05, N2V50P05, N5V25P05, N5V50P05, N5V100P10 and N10V25P10. These conditions were
associated with a homogeneous remelted layer, low power,
partial superposition of the laser shots of 50% or 75%, and a surface finish slightly rougher than the original material.
5. Acknowledgements
The authors thank the financial support of FINEP project Strategic Materials under grant number 01.09.0546.03.
6. References
1. Gna Na Muthu DS. Laser surface treatment. In: Proceedings of Conference Applications of Lasers in Material Processing;
1979 Apr 18-20; Washington, DC, USA. Metals Park: American Society for Metals; 1979. p. 177-211.
2. Ranjan R, Lambeth DN, Tromel M, Goglia P, Li Y. Laser texturing for low-flying-height media. Journal of Applied Physics. 1991;69(8):5745-5747.
3. Baumgart P, Krajnovich DJ, Nguyen TA, Tam AG. A new laser
texturing technique for high performance magnetic disk drives.
IEEE Transactions on Magnetics. 1995;31(6):2946-2951.
4. Neves D, Diniz AE, Lima MSF. Efficiency of the laser texturing
on the adhesion of the coated twist drills. Journal of Materials Processing Technology. 2006;179(1-3):139-145.
5. Neves D, Diniz AE, Lima MSF. Microstructural analyses
and wear behavior of the cemented carbide tools after laser surface treatment and PVD coating. Applied Surface Science.
2013:282:680-688.
6. Lima MSF, Sakamoto JMS, Simoes JGA, Riva R. Laser Processing of Carbon Fiber Reinforced Polymer Composite for Optical Fiber Guidelines. Physics Procedia. 2013;41:572-580.
7. Sakata FY, Santo AME, Miyakawa W, Riva R, Lima MSF. Influence of laser surface texturing on surface microstructure
and mechanical properties of adhesive joined steel sheets.
Surface Engineering. 2009;25(3):180-186.
8. Götz HE, Müller M, Emmel A, Holzwarth U, Erben RG, Stangl R. Effect of surface finish on the osseointegration of laser-treated
titanium alloy implants. Biomaterials. 2004;25(18):4057-4064.
9. Shen Y, Tao J, Tao H, Chen S, Pan L, Wang T. Anti-icing Potential
of Superhydrophobic Ti6Al4V Surfaces: Ice Nucleation and Growth. Langmuir. 2015;31(39):10799-10806.
10. Li M, Soboyejo W, inventors. Spectra-Physics Inc., assignee.
Systems and methods for laser texturing of surfaces of a substrate.
United States patent US 20050211680A1. 2005 Sep 29. 11. Dahotre NB, Paital SR, Samant AN, Daniel C. Wetting behaviour
of laser synthetic surface microtextures on Ti-6Al-4V for bioapplication. Philosophical Transactions of the Royal Society A. 2010;368(1917):1863-1889.
12. Oliver WC, Pharr GM. Measurement of hardness and elastic
modulus by instrumented indentation: Advances in understanding
and refinements to methodology. Journal of Materials Research.
2004;19(1):3-20.
13. International Centre for Diffraction Data - ICDD. Quantitative
Analysis Reference Intensity Ratio (RIR). Avaliable from:
<http://www.icdd.com/resources/tutorials/pdf/Quantitative%20 Analysis%20RIR.pdf>Access in: 24/8/2017.
14. Furmidge CGL. Studies at phase interfaces. I. The sliding of liquid drops on solid surfaces and a theory for spray retention.
Journal of Colloid Science. 1962;17(4):309-324.
15. Perry TL, Werschmoeller D, Li X, Pfefferkorn FE, Duffie
NA. Pulsed laser polishing of micro-milled Ti6Al4V samples.
Journal of Manufacturing Processes. 2009;11(2):74-81.
16. Lima MSF. Phase transformations during laser processing of
aerospace metallic materials. Advanced Materials Research.
2016;1135:179-201.
17. Pederson R. Microstructure and Phase Transformation of Ti-6Al-4V. [Licentiate Thesis]. Luleå: Luleå University of Technology; 2002.
18. Rocha SS, Adabo GL, Henriques GEP, Nóbilo MAA. Vickers
hardness of cast commercially pure titanium and Ti-6Al-4V alloy submitted to heat treatments. Brazilian Dental Journal.