Effect of thermophysical property and coating
thickness on microstructure and characteristics
of a casting
*Tie-tao Zhou
Male, born in 1963, Professor, Ph.D. Research interests: casting process and numerical simulation; high strength metallic structural materials.
E-mail: [email protected]
Received: 2016-08-10; Accepted: 2016-10-24 Ai-chao Cheng1
, Bo-lin Jia2
, Ren-fei Guo1
, Xiu-ping Ren3
, Hui-bin Xuan2
, and *Tie-tao Zhou1 , 1. School of Materials Science and Engineering, Beihang University, Beijing 100191, China
2. Yuncheng Guanlv Equipment Material Co., Ltd, Shanxi 444501, China
3. State Key Laboratory of Nonlinear Mechanics, Institute of Mechanics, Chinese Academy of Sciences, Beijing 100190, China
I
n recent years, the shipping container corner itting's great attraction is attributed to its extraordinary application in container building [1–3]. In fact, ocean shipping and mass transit mainly use shipping containers [4–6]. The corner itting is one of the important components of the container, playing a key role in lifting and bearing the whole body weight. Moreover, it is generally believed that the inside and outside angles of the container corner fitting are prone to cause defects. Finally, the service environment is very harsh and the container corner fitting is an international standard component with strict requirements on microstructure and properties. Therefore, it is necessary to study itsAbstract:
A new improved investment casting technology (IC) has been presented and compared with the existing IC technology such as lost foam casting (LFC). The effect of thermophysical property and coating thickness on casting solidification temperature field, microstructure and hardness has been investigated. Theresults show that the solidiication rate decreases inversely with the coating thickness when the coating contains
silica sol, zircon powder, mullite powder and defoaming agent. In contrast, the solid cooling rate increases as the
coating thickness increases. However, the solidiication rate and solid cooling rate of the casting produced by
the existing IC and the improved IC are very similar when the coating thickness is 5 mm, so the microstructure
and hardness of a container corner itting produced by the improved IC and the existing IC are similar. The linear
regression equation for the grain size (d) and cooling rate (v) of the castings is d= –0.41v+206.1. The linear
regression equation for the content of pearlite (w) and solid cooling rate (t) is w=1.79t + 6.71. The new improved
IC can greatly simplify the process and decrease the cost of production compared with the existing IC. Contrasting
with LFC, container corner ittings produced by the new improved IC have fewer defects and better properties. It
was also found that the desired microstructure and properties can be obtained by changing the thermophysical property and thickness of the coating.
Key words:
improved investment casting; thermophysical property; coating thickness; microstructure; propertyCLC numbers: TG223 Document code: A Article ID: 1672-6421(2017)01-046-09
production process.
It is well known that steel castings with long low-cycle fatigue life, thick walls, high melting point, high surface quality and mass production capabilities have often been produced by IC in the practice of engineering manufacturing. Container corner fittings belong to this kind of situation. IC is used to produce high value-added components, as IC usually has adequate surface finish, good dimensional tolerances, production capabilities for complex (net) shapes, and excellent surface quality [7–11]. However, traditional IC processes use wax as the expendable material, which
is complex and diicult to control. The most pressing
problem is that this leads to more intensive labor and higher costs [12, 13].
representative RP technologies [14, 15]. SLS has been used to produce a small number of wax-like patterns with CastForm polystyrene (CF) material for shell IC. FDM machines extrude molten plastic to build an expendable pattern, usually using acrylonitrile butadiene styrene (ABS) and polycarbonate (PC) [16]. However, a plastic pattern made of the above materials easily cracks the ceramic shell due to its large expansion stress, and it
is very diicult to demould after the ceramic shell has dried.
Compared with traditional IC, LFC is a cost-effective, environment-friendly mass production technology for production of near-net shape castings [17]. In the LFC, an expendable foam pattern has been introduced to manufacture castings, which greatly reduces the cost of production [18–20]. Nevertheless, the surface quality of the part in LFC is inferior to that in the IC, especially for steel castings with thick walls [21]. The expendable pattern shell casting process has been proposed to produce Mg-Al alloy castings, which combines the foam pattern preparation of the LFC process with the shell precision fabrication of investment casting[22-26]. Although this process can improve the production of complicated and thin-walled Mg-Al alloy precision castings, it has not been applied in manufacturing steel castings with thick walls.
The coating applied on the pattern is a key factor for producing high quality castings [27, 28]. The composition and thickness of the pattern coating are two critical parameters controlling the casting process [29, 30]. Composition mainly refers to the thermophysical properties of the coating. It is therefore necessary to investigate how the thermophysical properties and
thickness of the coating would afect the casting characteristics.
In this paper, a new improved investment casting technology (IC), also known as the expendable pattern shell casting process, has been introduced to produce a steel casting with thick walls. A series of numerical simulation calculations of casting temperature fields under different coating thermophysical
properties have been carried out utilizing the commercial inite
element simulation software ANSYS. The microstructure and properties of the castings have also been studied in this work.
1 Experiments and simulations
1.1 Finite element modeling
Three-dimensional thermal finite element modeling was used to simulate the thermophysical properties. Three-dimensional
solid models of the container corner itting, sprue, and riser were prepared using Solidworks Oice Premium 2012 software and exported as a Parasolid ile to ANSYS simulation software. The
thermophysical property parameters of alloy were measured and are shown in Table 1.
With the help of ANSYS software, the process was modeled
with element types SOLID 90. Correction speciic heat method
was used to deal with the latent heat of phase change, which converted the latent heat between the solidus and liquidus temperatures into specific heat, and added to the actual heat capacity. Correction specific heat can be seen as a constant
when the temperature is between the solidus and liquidus temperatures, as in Equation 1:
where Cm is the correction specific heat capacity, C is the actual specific heat capacity, L is the latent heat of phase
change, 256,000 J•kg. Tliquid and Tsolid are the liquidus and solidus temperatures, respectively. The liquidus and solidus temperatures based on the above formula are 1,506 °C and 1,428 °C, respectively, with a mushy zone spacing at about 78 °C. It is assumed that the beginning temperature of all the
hot metal illed in the mold is 1,580 °C. Following the above
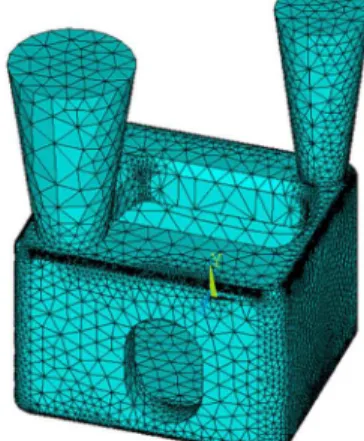
conditions, this research attempts to simulate the container corner fitting and designs the gating system on the basis of the simulation results. Figure 1 shows the element grid of the
container corner itting for the casting process.
(1)
Tliquid-Tsolid
Table 1: Thermophysical property parameters of cast alloy
Temperature (°C)
0 400 800 1,200 1,580
Thermal conductivity
W•(m•°C)-1
45 38 27 31 32
Speciic heat
capacity
J•(kg•k)-1 480 650 600 680 800
Density, kg•m-3 7,850
Fig. 1: Element grid of container corner itting
1.2 Mold and simulation
As Table 2 shows, two diferent types of pattern were produced.
The first type of pattern was made of foam material which is
expanded polystyrene (EPS) with a density of 20 kg•m-3. The
foam was cut using a wire cutting machine, and it was then assembled into a shaped model. In addition, a pouring cup was cut from the same foam material and attached to the top of the
pattern. The patterns were then coated with diferent types of
I: quartz powder 80%, white emulsion 0.6%, bentonite 3%, CMC0.5%, and the thickness of the coatings were designed as 3 and 5 mm. Three patterns made of foam were coated with facing layer, depletion layer and back layer, marked as Coating II, with the thickness of the coatings being set at 3, 5, and 8 mm, respectively. The other patterns were made of wax, and patterns were assembled to a wax tree. Coating II was applied to this wax pattern and the thickness of coating was set at 5 mm. The parameters of Coating II is given in Table 3.
Table 2: Different techniques involved in this work
Technique Pattern
material Coating
Thickness of
coating, mm Casting
I foam I 3 I
II foam II 3 II
III foam I 5 III
IV wax II 5 IV
V foam II 5 V
VI foam II 8 VI
Table 3: Composition and parameters of coating II
Facing layer
Depletion
layer Back layer
Silica sol, kg 10 10 10
Zircon powder, kg 36-40 -
-Mullite powder, kg - 16-17 14-15
Defoaming agent, mL 12 -
-Viscosity of low cup, s 31-33 18-20 12-14
Speciic gravity, g•m3 2.7-2.8 1.82-1.85 1.81-1.83
After all the mold materials were set and dried, patterns coated with the Coating II were baked in a kiln at 750 °C for more
than 20 minutes, with a heating rate of 0.3 °C•s-1
from room temperature to 750°C, which would remove the foam and wax patterns. Patterns coated with coating I would be melted during pouring. The thermophysical property parameters of Coatings I
and II as well as the illing sand were measured and are shown
in Table 4. All the molds should be buried in the sand before pouring except the mold used in Technique IV. The sandbox is
Table 4: Thermophysical property parameters of different
coatings and illing sand
Thermal conductivity
W•(m•°C)-1
Speciic heat
capacity
J•(kg•k)-1
Density
kg•m-3
Coating I 0.5 2,500 2,009
Coating II 1.5 3,350 1,646
Sand 0.52 1,220 1,630
Fig. 2: Revolving section view of the assembly
a cube with equivalent side lengths of 320 mm. Figure 2 shows
a revolving section view of the assembly. Casting solidiication temperature ield under diferent techniques has been simulated.
Table 5: Chemical composition of Fe-Si-Mn-RE alloy (wt.%)
C Mn Si P S CE
0.14 1.18 0.41 0.02 0.015 0.36
1.4 Microstructure and mechanical properties
According to the results of simulation calculation, specimens were taken from different locations, including the highest temperature position (HIGH), the intermediate temperature position (INT) and the minimum temperature position (LOW) of castings. After mechanical polishing, specimens were etched in a solution of 5% (volume fraction) HNO3 in ethanol to reveal grain boundaries. Microstructures were observed using an optical microscope (OM). The linear intercept method was applied to measure the mean grain size using the Eq. (2):
d=1.74L
where d is the mean grain size, L is the linear intercept of grain size, determined by optical microscopy [17]. Vickers hardness testing was performed using 98 N loads with a holding time of 10 s, and hardness value was measured through Vickers.
(2)
1.3 Melt and casting
2 Results and discussion
2.1 Simulation calculation
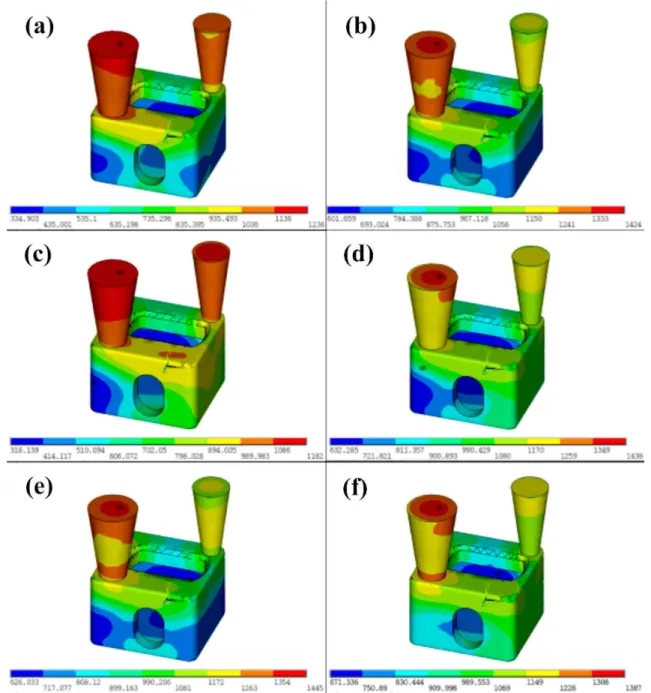
Figure 3 shows the temperature contour of the container corner fitting at 120 s under different casting techniques. As can be seen from Fig. 3a and c, with increasing the coating thickness, the solidification rate increases due to the specific heat capacity and density of Coating I being larger than that
of sand. In contrast, the solidiication rate decreases inversely
with the coating thickness (Fig. 3b, e and f), because the shell mold with larger thermal conductivity and specific heat was baked at 750 °C before pouring, more heat would be stored in
the greater thickness positions. However, the solidiication rate
of Techniques IV and V (Fig. 3d and e) are very similar. The temperature contour also indicates directional solidification in the casting will appear and start from the bottom of the
casting to sprue as the melt cools down. The solidiication time
decreases with the increasing distance from sprue, so the sprue and risers designed are reasonable.
Figure 4 shows the temperature contour of the container corner fitting at 1000 s under different casting techniques. It is evident that the solid cooling rate increases as the coating thickness (Fig. 4b, e and f) increases. Moreover, the solid cooling rates of the two castings (Fig. 4d and e) are the same.
From Figs. 3 and 4, it is also observed that the solidiication
rates and solid cooling rates of casting I are faster than that of casting II whether the thickness of the coating is 3 or 5 mm. The
shell molds with larger speciic heat and density in Techniques II
and V have been baked at 750 °C and stored a lot of heat before pouring. It can be inferred that the grain size of the Casting I is smaller than that of the Casting II, while the grain number is opposite, and the pearlite content and the hardness of Casting I are much greater than that of Casting II.
Fig. 4: Temperature contour of container corner itting at 1000 s: a) Tech I, b) Tech II, c) Tech III, d) Tech IV, e) Tech V, f) Tech VI
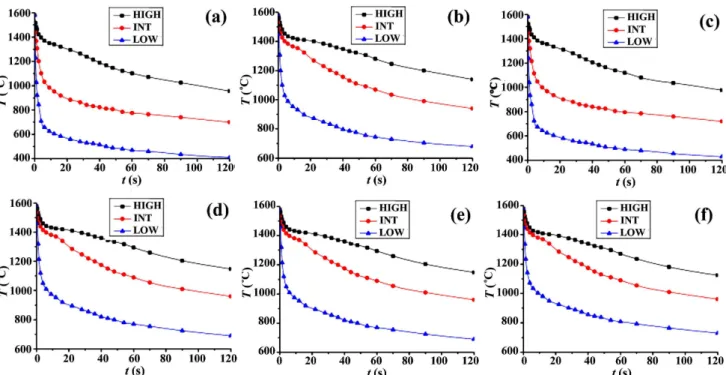
The nodes which have the highest temperature, the intermediate temperature and the lowest temperature on the three samples were selected. The cooling curves of three nodes at 120 s and 1000 s were drawn and are shown in Figs. 5 and 6. These two photographs more clearly demonstrate the conclusions of the above analysis.
It is also clearly seen that the nodes with the higher temperature have a plateau which is lower than the solidus temperature, while the node with the lowest temperature has no plateau. The metal would emit a lot of latent heat during
solidiication and the heat is diicult to conduct away in a short period of time through the coating and sand in the solidiication
process, so the cooling rate of casting decreases and a plateau occurs. When the cooling rate is very great, the heat conduction
rate is greater than the solidiication latent heat release rate, so
the plateau cannot be seen. The dual function of super-cooling degree and constitutional super-cooling makes the plateau lower than the solidus temperature.
The solidification rate of Castings IV,V and VI in the temperature range of 1,580 °C to 1,420 °C can be calculated by
Figs. 5d, e and f. The solidiication rates are 10 m•s-1, 43.2 m•s-1 ,
228.6 m•s-1; 12 m•s-1, 45 m•s-1, 235 m•s-1; 7.5 m•s-1, 38.1 m•s-1 and
200 m•s-1
, respectively.
The solid cooling rate of Castings IV,V and VI in the temperature range of 1,420 °C to 730 °C can be calculated by
Fig. 6d, e and f. The solid cooling rates are 0.7 m•s-1, 1.8 m•s-1, 8.1
m•s-1; 0.7 m•s-1, 1.9 m•s-1, 8.4 m•s-1; 0.82 m•s-1, 2.3 m•s-1 and 9.2
m•s-1, respectively.
2.2 Coating integrity and casting
characteristics
Fig. 5: Cooling curves of three nodes in 120 s: a) Tech I, b) Tech II, c) Tech III, d) Tech IV, e) Tech V, f) Tech VI
Fig. 6: Cooling curves of three nodes in 1,000 s: a) Tech I, b) Tech II, c) Tech III, d) Tech IV, e) Tech V, f) Tech VI
mould filling time is controlled by how fast the gases escape through the coating and the sand [31–33].
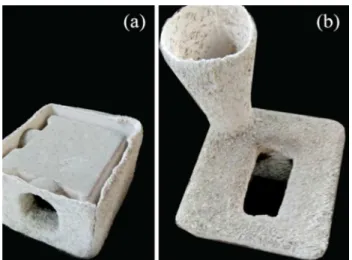
Figure 7 shows the molds under diferent coating conditions.
It can be seen that the mold with 3 mm thickness was prone to collapse in the process of casting, no matter whether the mold was made of Coating I or II, because the wall of the mold is too thin to bear the weight of the sand and the impact of molten liquid.
Figure 8 demonstrates the effect of coating thermophysical property and thickness on the castings. As can be seen, when
Fig. 7: Mold of different techniques: a) Tech II, b) Tech IV
Fig. 8: Castings produced by different techniques: a) Casting III, b) Casting IV, c) Casting V, d) Casting VI
appear on the casting. As the permeability of the thicker coating reduced, gas escaping through the coating and the sandbox become slower. However, high quality castings can be obtained when the material of the mold is coating II and the thickness of mold is 5 mm (Fig. 8b and c), because the thermal conductivity
and speciic heat capacity of coating II are larger than that of
coating I, and the melting point of facing layer of coating II is greater than 1,580 °C.
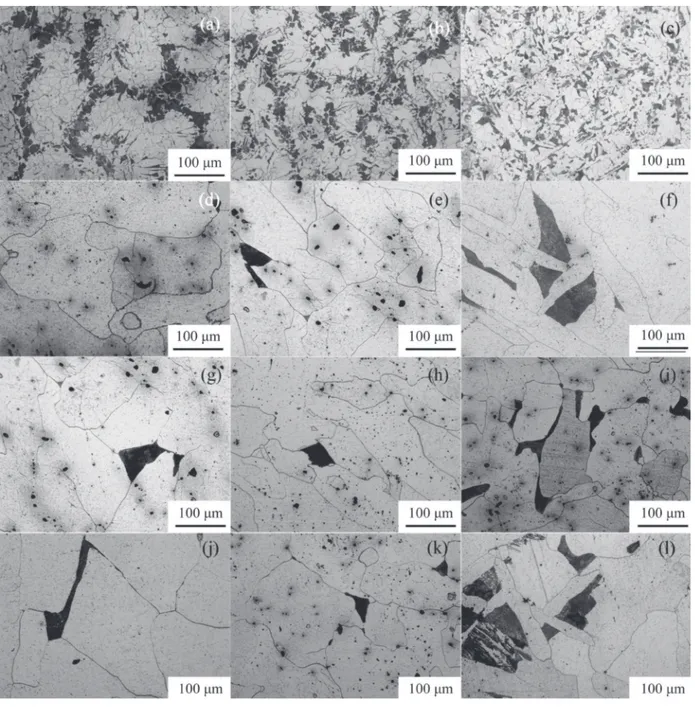
The microstructures of the as-cast alloys are shown in Fig. 9. It is evident that as-cast microstructures of the alloys prepared by Techniques III, IV, V and VI are similar, with a series of pearlite distributing along the grain boundaries. However, the average grain sizes of Castings III, IV, V and VI at three
positions (HIGH, INT, LOW) are 29 μm, 25 μm, 21 μm; 202 μm, 133 μm, 92 μm; 198 μm, 132 μm, 88 μm; 210 μm, 189 μm and 121 μm, respectively. The grain size becomes smaller
from the highest temperature position to the lowest temperature position in the same kind of technique, which is consistent with the earlier prediction. The grain refinement of the lost foam
cast alloy is supposed to be caused by the rapid solidiication
rate and the inclusions that reduced the work of nucleation and
improved the nucleation rate. Therefore, Casting III has a iner
microstructure compared to Casting IV and Casting V under the same coating thickness. The average grain sizes of Castings V and IV are similar. The microstructures of all the alloys are mainly composed of ferrite and pearlite, but the content of
pearlite is diferent. The average content of pearlite for Castings
IV, V and VI at three positions (HIGH, INT, LOW) are 3%, 10%, 18%; 3%, 10%, 20%; 6%, 11%, 24%, respectively.
The linear regression equation for the grain size and
solidiication rate of Casting IV is proposed as Equation 3:
d=-0.41v+206.1
where d is the mean grain size, v is the cooling rate of the casting. The equation is still valid when the grain size and cooling rate of Casting V and Casting VI are brought into Eq. (3), and it can be used to estimate the grain size after the cooling rate of the casting is calculated in simulation.
The linear regression equation for the content of pearlite and solid cooling rate of the casting IV is proposed as Equation 4:
w =1.79t+6.71
(3)
(4)
where w is the content of pearlite, t is the solid cooling rate of casting. The equation is still valid when the content of pearlite and solid cooling rate of Casting V and Casting VI are brought into Eq. (4).
Fig. 9: Microstructures of as-cast alloys: a) Casting III HIGH, b) Casting III INT, c) Casting III LOW, d) Casting IV HIGH, e) Casting IV INT, f) Casting IV LOW, g) Casting V HIGH, h) Casting V INT, i) Casting V LOW, j) Casting VI HIGH, k) Casting VI INT, l) Casting VI LOW
3 Conclusion
From the aspect of microstructure and hardness, it can be concluded that the improved IC can replace the existing IC to
produce a qualiied cast steel without stringent surface quality
requirements.
In the improved IC, the foam pattern is used instead of the wax pattern, which greatly reduce the cost of production compared with the existing IC. On the other hand, the production process of the mold is simplified, in which the processes of repairing the wax pattern and assembling it to a central sprue are eliminated. Compared with the lost foam casting, the container
corner ittings have fewer defects and better performance with
the improved IC.
The effects of thermophysical property and thickness of coating vary according to different techniques. The desired
microstructure and properties can be obtained by changing the thermophysical properties and thickness of the coating to regulate and control the solidification temperature field. After
the solidiication rate and the solid cooling rate of the cast steel
were calculated by numerical simulation, the grain size and the content of pearlite produced by the improved IC can be estimated by the linear regression equation.
References
[1] Aghl P P, Naito C J, Riggs H R. Estimation of demands resulting from inelastic axial impact of steel debris. Engineering Structures, 2015, 82: 11-21.
[2] Zha Xiaoxiong, Zuo Yang. Finite element study of container structure under normal and high temperature. Mathematical Problems in Engineering, 2016, 2016.
[3] Giriunas K, Sezen H, Dupaix R B. Evaluation, modeling, and analysis of shipping container building structures. Engineering Structures, 2012, 43: 48-57.
[4] Vis I F A, De Koster R. Transshipment of containers at a container terminal: An overview. European Journal of Operational Research, 2003, 147(1): 1-16.
[5] Steenken D, Voß S, Stahlbock R. Container terminal operation
and operations research-a classiication and literature review. OR
spectrum, 2004, 26(1): 3-49.
[6] Stahlbock R, Voß S. Operations research at container terminals: a literature update. OR spectrum, 2008, 30(1): 1-52.
[7] Syverud M, Herø H. Mold illing of Ti castings using investments
with different gas permeability. Dental Materials, 1995, 11(1): 14-18.
[8] Ebrahimi S A, Tortorelli D A, Dantzig J A. Sensitivity analysis and nonlinear programming applied to investment casting design. Applied Mathematical Modelling, 1997, 21(2): 113-123.
[9] Kuang J P, Harding R A, Campbell J. Microstructures and
properties of investment castings of γ-titanium aluminide. Materials
Science and Engineering: A, 2002, 329: 31-37.
[10] Cheng X, Sun X D, Yuan C, et al. An investigation of a TiAlO based refractory slurry face coat system for the investment casting of Ti–Al alloys. Intermetallics, 2012, 29: 61-69.
[11] Singh R, Singh J, Singh S. Investigation for dimensional accuracy of AMC prepared by FDM assisted investment casting using
nylon-6 waste based reinforced ilament. Measurement, 2016, 78:
253-259.
[12] Wang Songhao, Miranda A G, Shih C. A study of investment casting with plastic patterns. Materials and Manufacturing Processes, 2010, 25(12): 1482-1488.
[13] Kumar P, Ahuja I P S, Singh R. Application of fusion deposition modelling for rapid investment casting – A review. International Journal of Materials Engineering Innovation, 2012, 3(3-4): 204-227.
[14] Chua C K, Feng C, Lee C W, et al. Rapid investment casting: direct and indirect approaches via model maker II. The International Journal of Advanced Manufacturing Technology, 2005, 25(1-2): 26-32.
[15] Kumar P, Singh R, Ahuja I P S. Investigations on dimensional accuracy of the components prepared by hybrid investment casting. Journal of Manufacturing Processes, 2015, 20: 525-533. [16] Dotchev K, Soe S. Rapid manufacturing of patterns for investment
casting: improvement of quality and success rate. Rapid Prototyping Journal, 2006, 12(3): 156-164.
[17] Li Jilin, Chen Rongshi, Ke Wei. Microstructure and mechanical properties of Mg-Gd-Y-Zr alloy cast by metal mould and lost foam casting. Transactions of Nonferrous Metals Society of China, 2011, 21(4): 761-766.
[18] Caulk D A. A foam melting model for lost foam casting of aluminum. International Journal of Heat and Mass Transfer, 2006, 49(13): 2124-2136.
[19] Liu X J, Bhavnani S H, Overfelt R A. Simulation of EPS foam decomposition in the lost foam casting process. Journal of Materials Processing Technology, 2007, 182(1): 333-342. [20] Kannan P, Biernacki J J, Visco D P. A review of physical and kinetic
models of thermal degradation of expanded polystyrene foam and their application to the lost foam casting process. Journal of Analytical and Applied Pyrolysis, 2007, 78(1): 162-171.
[21] Liu Zili, Hu Jingyu, Wang Qudong, et al. Evaluation of the effect of
vacuum on mold illing in the magnesium EPC process. Journal of
Materials Processing Technology, 2002, 120(1): 94-100.
[22] Jiang Wenming, Fan Zitian, Liao Defeng, et al. Research on cracking mechanism of the thin shell mould in expendable pattern shell casting during pattern removal process. China Foundry, 2010, 7(3): 230-235.
[23] Jiang Wenming. Study on technology of expendable pattern shell casting process with vacuum and low pressure for aluminum (magnesium) alloy. Dissertation, Wuhan, Huazhong University of Science and Technology, 2011. (In Chinese)
[24] Jiang Wenming, Fan Zitian, Liu Dejun, et al. Correlation of microstructure with mechanical properties and fracture behavior of A356-T6 aluminum alloy fabricated by expendable pattern shell casting with vacuum and low-pressure, gravity casting and lost foam casting. Materials Science and Engineering: A, 2013, 560: 396-403.
[25] Peng Qiaoyuan. Research on the expendable pattern-shell compound casting of AZ91D magnesium alloy. Dissertation, Changsha: Central South University, 2013. (In Chinese)
[26] Jiang Wenming, Fan Zitian, Chen Xu, et al. Effects of mechanical vibration and wall thickness on microstructure and mechanical properties of AZ91D magnesium alloy processed by expendable pattern shell casting. Metallurgical and Materials Transactions A, 2015, 46(4): 1776-1788.
[27] Ahn D, Kweon J H, Kwon S, et al. Representation of surface roughness in fused deposition modeling. Journal of Materials Processing Technology, 2009, 209(15): 5593-5600.
[28] Grifiths W D, Davies P J. The permeability of Lost Foam pattern
coatings for Al alloy castings. Journal of Materials Science, 2008, 43(16): 5441-5447.
[29] Sands M, Shivkumar S. Inluence of coating thickness and sand ineness on mold illing in the lost foam casting process. Journal of
Materials Science, 2003, 38(4): 667-673.
[30] Karimian M, Ourdjini A, Idris M H, et al. Effect of pattern coating thickness on characteristics of lost foam Al-Si-Cu alloy casting. Transactions of Nonferrous Metals Society of China, 2012, 22(9): 2092-2097.
[31] Lau F, Lee W B, Xiong S M, et al. A study of the interfacial heat transfer between an iron casting and a metallic mould. Journal of Materials Processing Technology, 1998, 79(1): 25-29.
[32] Dong Yiwei, Bu Kun, Dou Yangqing, et al. Determination of interfacial heat-transfer coefficient during investment-casting process of single-crystal blades. Journal of Materials Processing Technology, 2011, 211(12): 2123-2131.