1.Sanata Dharma University – Faculty of Science and Technology – Electrical Engineering Department – Yogyakarta – Indonesia. 2.Universiti Kebangsaan Malaysia – Institute of Climate Change – Space Science Centre – Bangi – Malaysia.
Correspondence author: Wayan Suparta | Sanata Dharma University – Faculty of Science and Technology – Electrical Engineering Department |Campus III Paingan, Maguwoharjo55281 | Yogyakarta – Indonesia | E-mail: [email protected]
Received: Oct. 11, 2016 | accepted: July 25, 2017 section Editor:Alvaro Damião
aBstRaCt: This study attempted to identify whether space radiation sources could have affected the communication on RazakSAT-1 that was orbiting in a Low Earth Orbit-Near Equatorial (LEO-NEqO). Data on galactic cosmic rays (GCR), trapped protons, trapped electrons, and solar energetic particles (SEPs) obtained from Space Environment Information System (SPENVIS) are considered. The effects of these radiation sources are analyzed using the linear energy transfer (LET), total ionizing dose (TID), and solar cell degradation. Flux data from National Oceanic and Atmospheric Administration (NOAA) 15, 16, and 17 satellites, and the geomagnetic conditions during the time when RazakSAT-1’s missing is also analyzed. Another two satellites, Satélite de Coleta de Dados (SCD-2) and Advanced Land Observation Satellite (ALOS), are compared with the performance of RazakSAT-1. Results showed that GCR dominated at a high energy range of 103 MeV and above in the LEO-NEqO, whereas the energies of the trapped protons and trapped electrons are less than 400 MeV and 4 MeV, respectively. There are no SEPs estimated during the mission period (2009 – 2011). Based on the SPENVIS, SCD-2 and ALOS are more exposed to higher radiation damage than RazakSAT-1. Thus, an analysis of space radiation environment effects on the RazakSAT-1 communication lost after one year of operation will be discussed further, as a platform to fi nd the best strategy for future missions.
KEyWoRds: Low earth orbit, Linear energy transfer, Total ionizing dose, Non-ionizing energy loss.
INTRODUCTION
RazakSAT-1, which was launched in 2009, is Malaysia’s second remote sensing satellite aft er TiungSAT-1 satellite (Ahmad 2013). Th e satellite was designed to operate in a low earth orbit (LEO) and near-equatorial orbit (NEqO) at an altitude of 685 km with 9° of inclination. Th is orbital position allows for a satellite revisit frequency of 90 min, which is more frequent than a sun-synchronous orbital satellite. At this altitude, RazakSAT-1 can monitor the equatorial environment. Th e payload in RazakSAT-1 was designed with a medium-sized aperture camera (MAC) and fi ve linear detectors, each of which consists of one panchromatic band and four multispectral bands that are designed to capture high-resolution images (Hashim et al. 2013). Th e high-resolution images contribute to Malaysia’s development by aiding land management, resource development and forestry. Th e satellite’s high-speed transmission system can download 32 Gb of stored image data within 3 – 4 daytime passes (Chun et al. 2006). Power is supplied by solar cells made of GaAs/Ge, whereas the battery uses NiCd. Overall, RazakSAT-1 had a positive outlook. However, the mission was uncompleted aft er one year in the orbit. Th e true cause of uncompleted mission was unknown due to unavailability of the vehicle telemetry. Th is study was motivated by this situation with aim to verify whether space radiation environment of LEO-NEqO had a role in aff ecting the mission.
Investigating Space Radiation Environment
Effects on Communication of Razaksat-1
Wayan Suparta1, Siti Katrina Zulkeple2Suparta W; Zulkeple SK (2018) Investigating Space Radiation Environment Effects on Communication of Razaksat-1. J Aerosp Tecnol Manag, 10: e2218, doi: 10.5028/jatm.v10.815
How to cite:
Suparta W http://orcid.org/0000-0002-6193-1867
To analyze the distribution of space radiation environment such as trapped particles, a Space Environment Information System (SPENVIS) tool is used (Heynderickx et al. 2004). This system includes the NASA AP-8 and AE-8 models. Samwell and Hady (2009) has used the models in the SPENVIS to forecast the 2012 space environment for the newly launched EGYPTSAT-2 satellite to assist the satellite team in proper planning decisions. EGYPTSAT-2 is a LEO satellite that orbits the polar region. They predicted that for a 1.5 mm aluminum (Al) shielding thickness, a minimum of total ionizing dose (TID) of 2.65 × 10⁴ rads through the silicon (Si) material and a displacement damage dose (DDD) of 7.75 × 10⁷ MeV/g (Si) to be provided for a five-year mission. Lawal and Radice (2013) has suggested a new satellite system to provide a near 24-hour data in the equator region by using a Synthetic Aperture Radar (SAR) satellite. However, studies on the space environment using this system have not been reported.
In this paper, space radiation, i.e., galactic cosmic ray (GCR), trapped particles, and solar energetic particles (SEPs), in the LEO-NEqO as a plausible cause of uncompleted mission of RazakSAT-1 using the SPENVIS online tool is examined. The orbital data of RazakSAT-1 is compared with the higher inclination of the Satélite de Coleta de Dados (SCD-2) and the polar Advanced Land Observation Satellite (ALOS). In addition, this work provides additional information on the natural characteristics of the LEO-NEqO environment. To support the analysis, the geomagnetic conditions and added the National Oceanic and Atmospheric Administration / Polar Operating Environmental Satellites (NOAA/POES) data for comparison is also examined.
METHODOLOGY
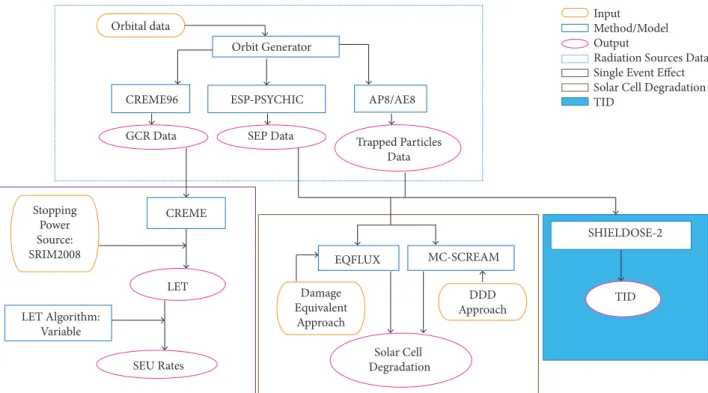
Estimating FluxEsThe models used to predict the space environment of the LEO-NEqO are shown in Fig. 1. These models are available in SPENVIS, which is an online tool that contains many integrated models designed for various simulation-based studies (Heynderickx
et al. 2004). All of these models were run for magnetic storms to provide the worst-case scenario. From the figure, the fluxes of GCR, SEP, trapped protons, and trapped electrons in the RazakSAT-1 satellite orbit are firstly estimated. The orbit of RazakSAT-1 was set at 9° of inclination with a perigee of 662 km and an apogee of 687 km for the three-year mission from July 14, 2009 to
Figure 1. Block diagram of the procedures used in SPENVIS to predict the space radiation environment for the three-year mission (2009 – 2012).
Orbital data
Orbit Generator
ESP-PSYCHIC AP8/AE8
Input Method/Model Output
Radiation Sources Data Single Event Effect Solar Cell Degradation TID
CREME96
SEP Data
Trapped Particles Data GCR Data
CREME
LET Algorithm: Variable
LET
EQFLUX MC-SCREAM
TID SHIELDOSE-2
Solar Cell Degradation
DDD Approach Damage
Equivalent Approach
SEU Rates Stopping
02/12
July 14, 2012. Two satellites, i.e., SCD-2 and ALOS, are compared with the performance of RazakSAT-1. SCD-2 is a data-collection satellite from Brazil under the program of the Instituto Nacional de Pesquisas Espaciais (National Institute of Space Research or INPE), whereas ALOS is an earth observation satellite developed by the Japan Aerospace Exploration Agency (JAXA). Orbital data on these satellites are simplifi ed in Table 1. Both RazakSAT-1 and SCD-2 satellites are located in NEqO, whereas ALOS is located in a polar orbit. Th erefore, diff erent inclinations can be compared.
satellite nEqo orbit Razaksat-1 nEqo orbit sCd-2 Polar orbit alos
Perigee (km) 662 743 691
Apogee (km) 687 768 693
Inclination (degree) 9 25 98.16
Table 1. Orbital data of three satellites: two in NEqO and one in the polar orbit.
To generate GCR fl uxes, the CREME96 model is used because it includes anomalous cosmic ray (ACR) and low-energy components that are not available in other models. ACR are partially ionized particles with low energy that can be trapped in the earth’s inner radiation belt due to its single-charge nature. In addition, CREME96 utilizes the solar minimum data from 1977 to estimate the GCR fl uxes. Four available GCR models in SPENVIS (ISO 15390, CREME86, CREME96, and Nymmik) are also compared to identify their abilities to generate GCR fl uxes in NEqO and polar orbits. Th e ESP-PSYCHIC (Xapsos et al. 2007) model is used to estimate long-term SEP fl ux fl uence over the three years. Th is model is useful because its data are taken from various satellites in three solar cycles, which allowed the model to predict a wide range of energy, from 1 MeV to above 100 MeV. SEPs are estimated during a solar maximum and a magnetic storm.
Finally, the established of NASA AP-8 and AE-8 models are selected to generate fl uxes of trapped protons and trapped electrons, respectively. AP-8 can cover an energy range of 0.1 to 400 MeV for trapped protons (Sawyer and Vette 1976) and AE-8 can cover an energy range of 0.04 to 7 MeV for trapped electrons (Vette 1991). In this study, the trapped particles are estimated during a solar minimum that follows the period of the mission of RazakSAT-1. Th en, the fl uxes are applied to calculate the radiation doses.
Radiation dosE CalCulation
Th e eff ects of space radiation are described as single-event eff ects (SEEs) and cumulative eff ects. SEE used linear energy transfer (LET) parameters and the cumulative eff ects used TID parameters. Th e solar cell degradation, which involved a type of cumulative eff ect called non-ionizing energy loss (NIEL), is included in the calculation.
Th e LET spectrum inside the spacecraft is derived from diff erential energies that are generated from the models. Th e diff erential energy f(E) inside the spacecraft is converted into the diff erential LET f(S) using the CRÈME method (Adams Jr. 1986):
Th e diff erential energy f(E) is defi ned as:
where: f ’(E’) is the diff erential energy at the outer shell of the spacecraft , S(E’) and S(E) are the stopping powers of the ions with energies E’ and E, respectively, and t is the thickness of the spacecraft in g/cm2 of Al or equivalent Al, and σ is defi ned as:
where: Ag is Avogadro’s number and An is the atomic mass of the incident ion.
(1)
(2)
Th e LET spectrum is used to determine the single-event upset (SEU). SEU is a soft error that commonly occurs in the electronics of orbiting spacecraft . Since diff erent energies can produce similar LETs, the variable LET algorithms are fed into the calculation to determine the upset rate (U) and defi ned as:
where: A is the surface area of the sensitive volume, D(p) is the diff erential path-length distribution in the sensitive volume (cm2g-1), and F(E,Z) is the diff erential ion energy fl ux (m-2sr-1 s-1 MeV-1). In addition to Eq. 4, p
minis the minimum path length for
depositing the minimum energy to cause an upset, as such, only energy above the minimum energy can cause an upset, and Emax
corresponds to the maximum energy in the ion spectrum.
By applying the Eqs. 1 to 4 through SPENVIS, LET and SEU rates are determined in a gallium arsenide (GaAs) device, which was shielded with 5 mm Al. Then, the LET and SEU rates in the orbits of RazakSAT-1, SCD-2, and ALOS are compared. In SPENVIS, a computer code called SHIELDOSE is used to determine the radiation dose as a function of depth in a shielded material (Seltzer 1994). However, the upgraded version called SHIELDOSE-2 is used to calculate the TID because it better represents proton nuclear interactions and includes more choices of target materials (Barkas and Berger 1964). The target materials are GaAs and Si. When incident particles hit geometric shapes, they are calculated differently. Electrons are calculated with the Monte Carlo code ETRAN, which considered the Bremsstrahlung effect. The doses are estimated for different orbital data of RazakSAT-1, SCD-2 and ALOS over three years.
Apart from that, solar cell degradation is estimated using EQFLUX (Tada et al. 1982) and MC-SCREAM (Messenger et al. 2008) programs. EQFLUX uses the damage-equivalent approach with 1 MeV electron fl uence in the selected orbit. MC-SCREAM uses the DDD method, which applies the NIEL parameter to estimate the end-of-life (EOD). For both programs, the degradation of the GaAs material that was shielded with various cover-glass thicknesses is estimated. GaAs was selected because it was the material of the solar cell in RazakSAT-1. Th en, the solar cell degradation in three orbital datasets of RazakSAT-1, SCD-2, and ALOS for the three-year period is compared.
gEomagnEtiC Conditions
To evaluate the geomagnetic conditions during the approximate period of RazakSAT-1 failure, the trapped particle fluxes were taken from the Medium Energy Proton and Electron Detector (MEPED) sensors onboard three NOAA/POES satellites (NOAA-15, 16, and 17) with geomagnetic indices of Kp and Dst (disturbance storm time) compared. Data are obtained from NOAA website. In this study, omnidirectional proton channels, which are free from data contamination, is used (Rodger
et al. 2010). The energy channels that were used are simplified in Table 2. Both Kp and Dst indices are obtained from the International Service of Geomagnetic Indices (ISGI). The evaluation of the geomagnetic conditions is set to three months (June to August, 2010).
data Channels abbreviation of data Channels Energy Range (meV)
P6 omni mepomp6 > 16
P7 omni mepomp7 > 35
P8 omni mepomp8 > 70
P9 omni mepomp9 > 140
Table 2. NOAA/POES data energy channels for omnidirectional proton channels.
RESULTS AND DISCUSSION
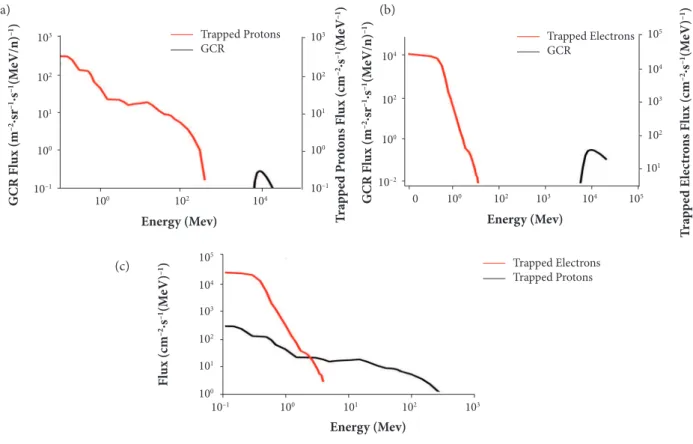
Flux analysisFigure 2 displays the space particles present in LEO-NEqO, where RazakSAT-1 is represented by the LEO-NEqO. The figure compares GCR with trapped protons (Fig. 2a), GCR with trapped electrons (Fig. 2b) and finally, between the two trapped particles (Fig. 2c). Based on the figure, trapped particles in LEO-NEqO decrease with energy while GCR flux is peaked at 104 GeV. Moreover, the peak values for the maximum energies of GCR, trapped proton, and trapped electron during RazakSAT-1 mission period are approximately 4.8 m–2 s–1 s–1, 60.3 cm–2 s–1, and 1.6 cm–2 s–1, respectively. This shows that LEO/NEqO contains GCR with high energy that ranges from 5 GeV to 20 GeV, trapped protons with an energy between 0.1 MeV to 400 MeV, and trapped electrons with an energy of 0.04 MeV to 4 MeV. GCR have lower fluxes than trapped particles and trapped protons for energy < 3 MeV. The lower GCR fluxes are due to the fact that most of the incoming GCR have been attenuated by the Earth’s magnetic field while the inner radiation belt, particularly the South Atlantic Anomaly (SAA), are already in LEO/NEqO and it contributes to the trapped particles population. Hence, based on the peak values estimated in LEO/NEqO, the orbit consist of 91% trapped protons, 2% trapped electrons, and 7% GCR.
Figure 2. Comparison of (a) GCR and trapped protons, (b) GCR and trapped electrons, and (c) trapped protons and trapped electrons in LEO/NEqO.
SEPs, on the other hand, are not estimated in LEO/NEqO because the SPENVIS models were unable to detect the values, which indicates that the particles are deflected by the geomagnetic cutoff near the equator. However, SEPs can be estimated at higher inclination, which indicates that SEPs have a greater chance of reaching the earth’s poles than the equator when large fluences are involved (Benton and Benton 2001). Low-energy SEPs are more common in LEO than high-energy SEPs.
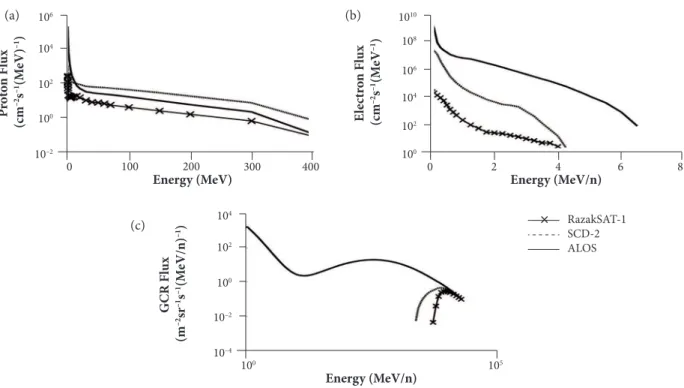
Comparison of trapped protons, trapped electrons, and GCR among the three satellites can be seen in Fig. 3. Here, RazakSAT-1 received the lowest flux because of its low inclination as compared to the other two satellites. The fluxes of trapped protons in RazakSAT-1 (Fig. 3a) can differ by approximately 8 to 10 times with SCD-2 and 100 times with ALOS. Furthermore, for trapped
105 104 103 102 101 100
10–1 100 101 102 103
F lux (cm –2·s –1(M eV ) –1) Energy (Mev) 103 102 101 100 10–1 103 102 101 100 10–1
100 102 104
GCR F lux (m –2·sr –1·s –1(M eV/n) –1) T ra p p ed P ro to ns F lux (cm –2·s –1(M eV –1) Energy (Mev) 105 104 103 102 101 104 102 100 10–2
100 102 104
GCR F lux (m –2·sr –1·s –1(M eV/n) –1) T ra p p ed E le ct ro ns F lux (cm –2·s –1(M eV ) –1) Energy (Mev)
0 103 105
105
Energy (MeV/n)
GCR F
lux
(m
–2sr –1s –1(M
eV/n)
–1)
100 10–4 10–2 100 102 104
400 300
200 100
Energy (MeV)
Pr
o
to
n
F
lu
x
(cm
–2s –1(M
eV
)
–1)
0 10–2
100 102 104 106
8
Energy (MeV/n)
E
le
ctr
o
n
F
lu
x
(cm
–2s –1(M
eV
–1)
0 2 4 6
100 102 106
104 108 1010
RazakSAT-1 SCD-2 ALOS ×
Figure 3. Comparison between three orbital satellites for fluxes of (a) trapped protons, (b) trapped electrons, and (c) GCR.
electrons (Fig. 3b), the flux in RazakSAT-1 can differ up to 650 and 1,000 times from those of SCD-2 and ALOS, respectively. Moreover, the maximum estimated energy range for trapped electrons in NEqO is 4 MeV and can increase to 6 MeV for polar orbits. For GCR (Fig. 3c), it has energy above 5 × 10³ MeV, which is 75% lower as compared to polar orbit. Moreover, the GCR fluxes in the orbits of SCD-2 and ALOS are 1.70 and 16.23 times higher, respectively as compared to that of RazakSAT-1. The model indicates that SCD-2 and ALOS are more exposed to GCR particles than RazakSAT-1 because of their higher inclinations.
Radiation dosE analysis
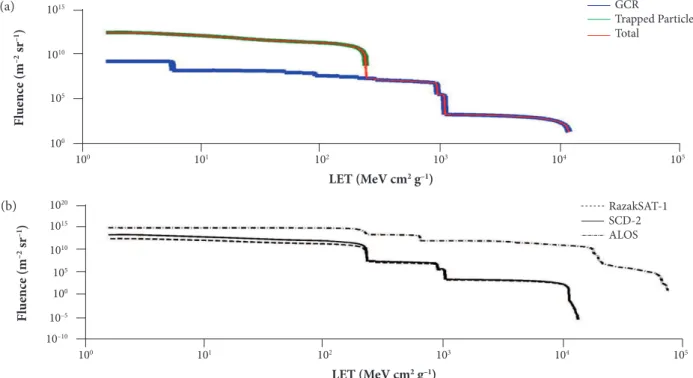
The level of radiation damage towards the three satellites can be explained using the LET, TID, and solar cell parameters. Figure 4 shows the LET results caused by the major space particles in LEO/NEqO (Fig. 4a) and the comparison of LET results between three satellite orbits (Fig. 4b). By referring to Fig. 4a, trapped particles are mostly responsible for the lower LET while GCR is the sole contributor for higher LET in LEO/NEqO. However, RazakSAT-1 in LEO/NEqO was estimated to have the lowest LET damage (the maximum LET was 1,087 MeV cm2 g–1) as compared to SCD-2 and ALOS (Fig. 4b), where all three satellite orbits demonstrated a decrease of spectra with increasing LET. For a 5 mm shielding, the estimated overall LET fluences of RazakSAT-1 were 1.3 to 9.4 times less than those of SCD-2 and approximately 3 to 120 times less than those of ALOS.
The predicted SEU rates in a 5 mm Al-shielded GaAs of the three satellites are shown in Table 3. RazakSAT-1 was estimated to have the lowest probability of SEU events compared with the other satellites. In fact, a 5 mm Al shielding can reduce the SEU rates by 2.70% for RazakSAT-1. However, SCD-2 demonstrates the highest SEU rates because of its frequent visits over the SAA, where exposure of proton is higher.
Although LET depends on the particle type and energy, it is used to predict the effect of a single event as a result of particle interactions with the target material. The effects include direct ionization and proton-induced ionization. Through LET, the protons directly interact with the target materials to cause ionization. Proton-induced ionization or nuclear interactions occur when the protons transfer energy to the target nucleus, which results in recoil particles that contribute to further ionization. These two mechanisms lead to SEU events. In some cases, increasing the shielding results in the formation of secondary particles where nuclear interactions will significantly multiply these secondary
(a) (b)
100
100
105
1010
1015 GCR
Trapped Particles Total
101 102 103
LET (MeV cm2 g–1)
F
lu
enc
e (m
–2 sr –1)
104 105
100
10–10
100
1010
1020
101 102 103
LET (MeV cm2 g–1)
F
lu
enc
e (m
–2 sr –1)
104 105
10–5
105
1015
RazakSAT-1 SCD-2 ALOS
Figure 4. LET spectra for (a) the major space particles in RazakSAT-1 and (b) through GaAs shielded with 5 mm Al for three satellites over three years.
Effect/satellite Razaksat-1 sCd-2 alos
Direct Ionization (bit–1) 2.13 × 10⁻² 3.52 × 10⁻² 1.89 × 10⁻¹
Proton-Induced Ionization (bit–1) 6.48 × 10⁻² 6.54 × 10⁻¹ 2.70 × 10⁻¹
Total Ionization (bit–1) 8.61 × 10⁻² 6.89 × 10⁻¹ 4.59 × 10⁻¹
Table 3. SEU rates in 5 mm Al shielded GaAs for three satellites.
particles, and finally, increase the dose. This scenario appears to occur for all three satellites. Therefore, ionization by nuclear interactions is greater than direct ionization. Thus, protons are the major contributor to the ionization effect in the GaAs device, as opposed to heavy ions.
For the TID analysis, Fig. 5a shows the dose-depth curve of the GaAs material as a result of interacting with trapped protons of RazakSAT-1 during a solar minimum. Based on the figure, three types of radiation are estimated for the total dose of electrons, Bremsstrahlung radiation, and trapped protons. The dose can be reduced by increasing the shielding thickness. However, increasing the shielding by approximately 4 mm or more is not significant for trapped protons. In fact, more shielding is less effective and increases construction costs issues in space designs (Murtaza 2011), and the electrons do not contribute significantly to Bremsstrahlung particles as their curve decreases. Meanwhile, Fig. 5b shows the dose comparison among the three satellites and the highest dose is found for ALOS. With 5 mm shielding, the estimated total TID received by RazakSAT-1 is 2.30 × 10² rads, which is 50% lower than the estimated dose in SCD-2 and ALOS. The dose-depth curve is found to flatten above 4 mm and 10 mm for SCD-2 and ALOS, respectively, which further implies that thicker shielding becomes less effective in reducing the dose.
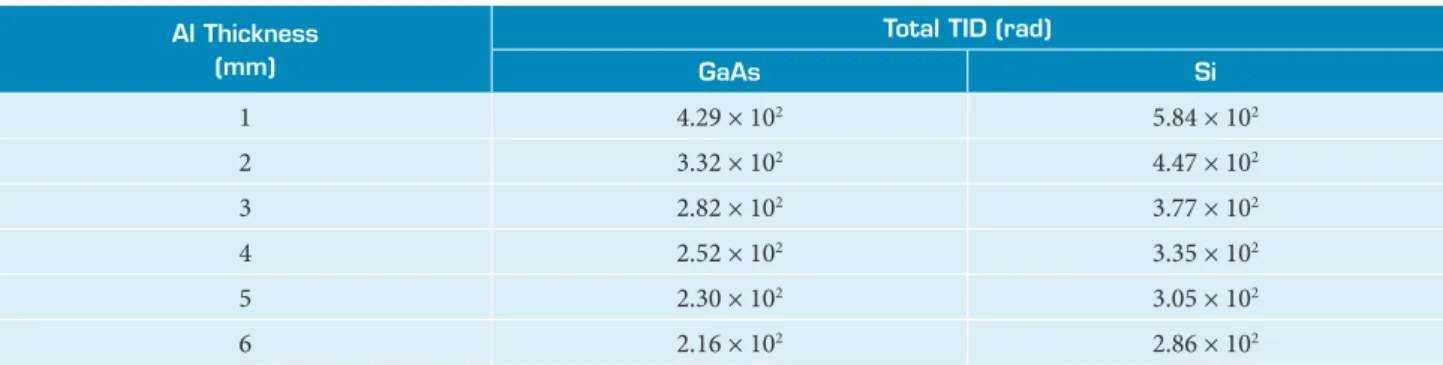
For materials used in spacecraft, the dose comparison Si and GaAs is compiled in Table 4. Here, Si material exhibited a higher dose of 34% as compared to the GaAs material, which shows that the GaAs material is expected to have better resistance against radiation damage than the Si material in designing the shielding of a spacecraft.
(a)
0
100
105
1010
1015
Total Electrons Bremsstrahlung Trapped Protons
5 10
AI Thickness (mm)
D
os
e in G
aA
s (r
ad)
15 20
0
102
104
106
108
5 10 15
AI Thickness (mm)
TID (r
ad)
20 RazakSAT-1 SCD-2 ALOS
×
Figure 5. TID in (a) LEO/NEqO and in (b) three satellites based on GaAs material for a period of three years.
al thickness (mm)
total tid (rad)
gaas si
1 4.29 × 10² 5.84 × 10²
2 3.32 × 10² 4.47 × 10²
3 2.82 × 10² 3.77 × 10²
4 2.52 × 10² 3.35 × 10²
5 2.30 × 10² 3.05 × 10²
6 2.16 × 10² 2.86 × 10²
Table 4. Absorbed dose of two materials shielded by selected thickness in NEqO for three years.
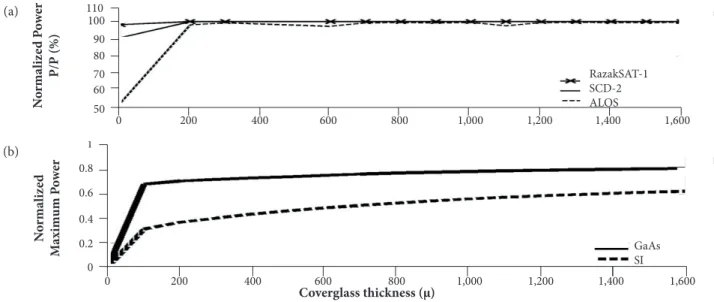
For GaAs solar cells, the effective dose of 1 MeV electrons as a function of the shielding thickness in the three satellite orbits is presented in Fig. 6. Similar to other doses, the increase in the cover-glass thickness reduces the radiation damage to solar cells. Among the three satellites, RazakSAT-1 and ALOS solar cells received the lowest and highest dose, respectively. The performance of the solar cells is based on the maximum power capability and the influence of the silica glass thickness. This characteristic is demonstrated using the GaAs material as shown in Fig. 7a. Based on this figure, the damage to the solar cells on the three satellites can be reduced by more than 50% with the use of 0.1 mm silica glass. However, the shield thickness above 0.2 mm for both RazakSAT-1 and SCD-2 and above 0.5 mm for ALOS will not reduce the radiation dose, although their doses continue to slowly decrease. Comparing the three satellites, the solar cells in RazakSAT-1 are expected to attain the highest power capability during the three-year mission, followed by SCD-2 and ALOS. In the RazakSAT-1, a very thin silica glass (~ 0.01 mm) is required to protect its solar cells. Increasing the cover-glass thickness does not significantly change the outcome. For the other two satellites, the 0.01 mm silica glass can increase the performance of SCD-2 and ALOS by 0.40% and 2.19%, respectively. RazakSAT-1 can perform 0.57% and 2.62% better than SCD-2 and ALOS, respectively. Meanwhile, Fig. 7b shows a comparison of the degradation of GaAs with the Si material in the RazakSAT-1 orbit. Similar to Fig. 7a, the power of the solar cells can be improved by
(a)
0 1011
1012
1013
1014
1015
1016
200 400 600 800 1.000 1.200 1.400
Coverglass Thickness (μ)
1 M
eV E
le
ct
ro
n E
q
uiva
le
n
t F
lu
enc
e (cm
–2)
1.600 RazakSAT-1 SCD-2 ALOS
×
Figure 6. Effective dose of 1 MeV electrons towards the GaAs solar cell as a function of the shielding thickness over three years for three satellite orbits.
Figure 7. Normalized maximum power of (a) GaAs solar cells at various orbits and (b) two solar-cell materials in the RazakSAT-1 orbit over three years.
0 200
0 0.2 0.4 0.6 0.8 1
400 600 800 1,000 1,200 1,400 1,600
GaAs SI
Coverglass thickness (μ)
N
o
rma
liz
ed
M
axim
um P
o
w
er
0 200
50 60 70 80 90 100 110
400 600 800 1,000 1,200 1,400 1,600
RazakSAT-1 SCD-2 ALOS
N
o
rma
liz
ed P
o
w
er
P/P (%)
(a)
(b)
increasing the cover-glass thickness. By using the GaAs material is expected to increase the power of the solar cell by approximately 29% more than the Si material when it is shielded with 0.5 mm of silica glass. Hence, GaAs was used in RazakSAT-1 to provide higher resistance to radiation damage in orbit.
gEomagnEtiC Condition analysis
Particle satellite Correlation Coefficient
Kp Dst
Trapped Protons
NOAA-15 0.7275 –0.6422
NOAA-16 0.7335 –0.6350
NOAA-17 0.7480 –0.5968
Trapped Electrons
NOAA-15 0.6654 –0.7114
NOAA-16 0.6844 –0.7346
NOAA-17 0.7211 –0.7125
Figure 8. Comparison of (a) trapped protons and (b) trapped electrons fluxes obtained from three NOAA/POES satellites with geomagnetic conditions following (c) the Kp index and (d) the Dst index from June to August, 2010 when communication with
RazakSAT-1 was likely lost. The geomagnetic data was obtained from NOAA (2016).
Table 5. Relationship between trapped particles with Kp and Dst indices for three NOAA satellites.
Dst index was –49 nT. Although the values may indicate possible degradation of the high-frequency band, the geomagnetic conditions for the entire three months are mild and insufficient to cause permanent damage to the communication devices. In addition, Table 5 simplifies the relationship between the geomagnetic disturbances and the trapped particle fluxes of the three NOAA satellites. The geomagnetic disturbances are found to be moderately consistent with the trapped-particle fluxes of all three NOAA satellites.
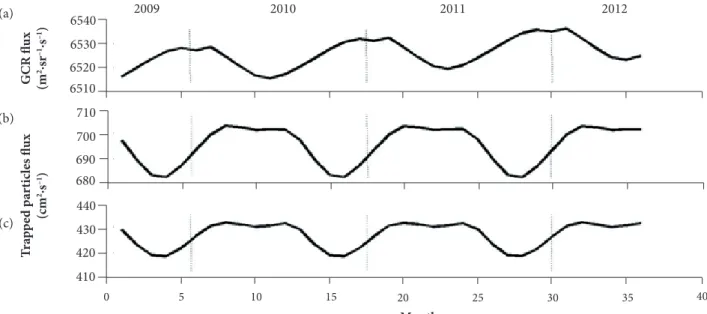
Apart from the data of the NOAA/POES satellites and geomagnetic indices, Fig. 9 demonstrates the monthly fluxes of the GCR and trapped particles in the RazakSAT-1 orbit, which estimated by the SPENVIS models from July 14, 2009 to July 14, 2012. Based on this figure, the GCR fluxes remain anti-correlated with the trapped particle fluxes, whereas the SPENVIS models did not estimate any sudden anomalies over the three years. Thus, the NOAA/POES and geomagnetic source observations and the model data showed that the space radiation calculated on average in the orbit may not be responsible for the uncompleted mission of RazakSAT-1. In other words, the models considered fluxes and doses for the whole orbit. Hence, this suggests that the satellite may experience anomalies in a specific region, such as the SAA region, where the LEO-NEqO satellites revisited more frequently. In addition, the doses received by the satellite from the SAA alone might need to be studied further in order to evaluate the major influence of space particles toward the LEO/NEqO satellites.
31/5 10/6 20/6 30/6 10/7 20/7 30/7 10/8 20/8 30/8
Time (Day)
D
st (n
T)
50
0
–50
Kp
6
2 4
0
F
lux (cm
–1·sr –1·s –1)
15.000
5.000 10.000
0
15.000 NOAA 15
NOAA 16 NOAA 17 5.000
10.000
0
(a)
(b)
(c)
SUMMARY AND CONCLUSION
The radiation environment in the LEO/NEqO of the RazakSAT-1 was assessed through the fluxes of three space radiation sources: GCR, SEPs, and trapped particles. The fluxes of GCR, SEPs, trapped protons and trapped electrons were predicted using the CREME96, ESP-PSYCHIC, AP-8 and AE-8 models, respectively. GCR dominated the LEO/NEqO in the high-energy range of 103 to 104 MeV, and no SEPs were detected because the shielding works very effectively in LEO/NEqO. The maximum GCR flux in the LEO/NEqO was approximately 16.23 times less than the fluxes in the polar orbit. The fluxes of trapped protons and trapped electrons in the NEqO were 1 and 10 times less, respectively, than those in the polar orbit.
In terms of the radiation dose comparison, the maximum LET values for RazakSAT-1 was 1087 MeV cm2 g–1, and it is almost similar with SCD-2, and two times lower compared to ALOS. RazakSAT-1 is estimated to experience 1 to 10 and 3 to 120 times less of LET damage compared to SCD and ALOS, respectively. The ionization that occurred in all three satellites is mainly attributed by protons, which produce greater nuclear interactions. RazakSAT-1 has the lowest SEU rates, compared to those of SCD-2 and ALOS. In addition to the radiation dose, RazakSAT-1, with 5 mm Al shielding, has the lowest estimated TID of approximately 1 and 15 times less than the TID of SCD-2 and ALOS, respectively. For solar cells, 0.01 mm of silica glass can improve the performance of satellites in the orbit by 0.05% for RazakSAT-1, 0.40% for SCD-2, and 2.19% for ALOS. In other words, the GaAs material that was used in RazakSAT-1, with 0.5 mm silica glass, also provides 29% better radiation resistance than the Si.
The environmental data from NOAA-15, 16, and 17 satellites and the geomagnetic indices over the expected period of disruption (three-month) showed that mild conditions were obtained, except for a sudden peak of geomagnetic activity on August 4, 2010. However, this event was insufficient to cause sudden damage to the communication frequency band of RazakSAT-1. The estimated monthly fluxes of GCR and trapped particles from the SPENVIS models do not show any anomalies during the three-year mission of RazakSAT-1, which implies that the space radiation environment is not a factor that causes loss of communication in RazakSAT-1. The models also consider average fluxes and doses received throughout the orbit. Thus, the dose received by satellites from SAA should be performed in more detail to evaluate the accuracy of risk in LEO/NEqO. For the case of RazakSAT-1, the material stored beyond the time limits required (waiting to launch), it may be one of the factors degrading the performance of the satellite. In addition to the space radiation environment, other factors also need to be investigated to understand what had happened during the RazakSAT-1 mission.
0 5 10 15 20
Month
T
ra
p
p
ed p
ar
ti
cl
es fl
ux
(cm
2·s –1)
GCR fl
ux
(m
2·sr –1·s –1)
2009 6540
6530
6520 6510
710
700
690 680
440
430
420
410
2010 2011 2012
25 30 35 40
Figure 9. Estimated monthly fluxes of (a) GCR, (b) trapped protons and (c) trapped electrons for RazakSAT-1 from July 14, 2009 to July 14, 2012.
(a)
(b)
ACKNOWLEDGMENTS
This research is supported by the Ministry of Education, Malaysia (MoE), under grant FRGS/2/2013/SG02/UKM/02/3. We would like to thank the SPENVIS team, NOAA and ISGI for providing the software, data on trapped particles and data on geomagnetic indices, respectively.
AUTHOR’S CONTRIBUTION
Conceptualization, Suparta W; Methodology, Suparta W and Zulkeple SK; Investigation, Suparta W and Zulkeple SK; Writing – Original Draft, Suparta W and Zulkeple SK; Writing – Review and Editing, Suparta W; Funding Acquisition, Suparta W; Resources, Suparta W and Zulkeple SK; Supervision, Suparta W.
REFERENCES
Adams Jr. JH (1986) Cosmic ray effects on microelectronics, Part IV (Report 5901). NRL Memorandum Reports.
Ahmad A (2013) Classification simulation of RazakSAT satellite. Procedia Engineering 53:472-482. doi: 10.1016/j.proeng.2013.02.061
Barkas WH, Berger MJ (1964) Tables of energy losses and ranges of heavy charged particles (Report SP-3013). NASA Technical Report.
Benton ER, Benton EV (2001) Space radiation dosimetry in low-Earth orbit and beyond. Nuclear Instruments and Methods in Physics Research B 184(1-2):255-294. doi: 10.1016/S0168-583X(01)00748-0
Chun HJ, Kim BJ, Chang HS, Kim EE, Park WK, Park SD, Ashard A (2006) RazakSAT – a high performance satellite waiting for its mission in space. Presented at: 20th Annual AIAA/USU Conference on Small Satellites. Proceedings of the AIAA/USU Conference on Small Satellites, Session IV, SSC06-VI-6.
Hashim M, El-Mahallawy MS, Reba MNM, Abas AA, Ahmad S, Yap XQ, Marghany M, Arshad AS (2013) Geometric and radiometric evaluation of RazakSAT medium-sized aperture camera data. International Journal of Remote Sensing 34(11):3947-3967. doi: 10.1080/01431161.2013.770581
Heynderickx D, Quaghebeur B, Wera J, Daly EJ, Evans HDR (2004) New radiation environment and effects models in the European Space Agency’s Space Environment Information System (SPENVIS). Space Weather 2(10). doi: 10.1029/2004SW000073
Lawal AD, Radice GM (2013) Near equatorial orbit small SAR constellation for developing nations. International Journal of Research in Engineering and Technology 2(4):654-651.
Messenger SR, Walters RJ, Warner JH, Evans H, Taylor SJ, Baur C, Heynderickx D (2008) Status of implementation of displacement damage dose method for space solar cell degradation analyses. Proceedings of the 8th European Space Power Conference, 2008; Constance, Germany.
Murtaza, H (2011) Prediction of the space radiation environment of PakSat, a geostationary communication satellite. Journal of Space Technology 1(1):73-77.
NOAA (2016) ftp://ftp.ngdc.noaa.gov/STP/GEOMAGNETIC_DATA/INDICES/
Rodger CJ, Clilverd MA, Green JC, Lam MM (2010) Use of POES SEM-2 observations to examine radiation belt dynamics and energetic electron precipitation into the atmosphere. J. Geophys. Res. 115(A4). doi: 10.1029 /2008JA014023
Samwel SW, Hady AA (2009) Space radiation environment forecast for EGYPTSAT-2 satellite. Space Weather 7(12). doi: 10.1029/2009SW000482
Sawyer DM, Vette JI (1976) AP-8 Trapped proton environment for solar maximum and solar minimum (NSSDC/WDC-A-R/S, 76-06). NASA Technical Report.
Seltzer SM (1994) Updated calculations for routine space-shielding radiation dose estimates: SHIELDOSE-2 (NISTIR, 5477). NIST Pubs.
Tada HY, Carter Jr. JR, Anspaugh BE, Downing RG (1982) Solar cell radiation handbook. 3rd ed. California: JPL Publication.
Vette JI (1991) The AE-8 trapped electron model environment (NSSDC/WDC-A-RS-91-24). NASA Technical Report.