30,000 Minimum
Wages: The Economic
Effects of Collective
Bargaining
Extensions
Pedro S. Martins
Working Paper
# 589
2014
30,000 minimum wages:
The economic effects of collective bargaining extensions
∗Pedro S. Martins†
Queen Mary University of London & CEG-IST & IZA
October 23, 2014
Abstract
Several countries extend collective bargaining agreements to entire sectors, therefore binding non-subscriber workers and employers. These extensions may address coordina-tion issues but may also distort competicoordina-tion by imposing sector-specific minimum wages and other work conditions that are not appropriate for many firms. In this paper, we anal-yse the impact of such extensions along several margins drawing on firm-level monthly data for Portugal, a country where extensions have been widespread until recently. Drawing on the scattered timing of the extensions, we find that both formal employment and wage bills in the relevant sector fall, on average, by 2% - and by 25% more across small firms - over the four months after an extension is issued. These results are driven by both reduced hirings and increased firm closures. On the other hand, informal work, not sub-ject to labour law or extensions, tends to increase. Our findings are robust to several checks, including a falsification exercise based on extensions that were announced but not implemented.
Keywords: Collective agreements, Worker flows, Labour law. JEL Codes: J52, K31, J23.
∗
I thank comments from Rui Abreu, Pierre Cahuc, Albert Jaeger, David Neumark, ´Alvaro Novo, Pedro Portugal, Ernesto Villanueva and seminar and conference participants at Nova SBE (Lisbon), PEJ (Covilh˜a), IZA (Brussels and Bonn), NIESR (London), QMUL (London), IEFP (Lisbon), ZEW (Mannheim) and the ECB (Frankfurt). Part of this paper was written while visiting Nova SBE, whose hospitality is greatly appreciated. I am also grateful for data access provided by the Ministry of the Economy and Employment, Portugal. All errors are my own.
†
Email: [email protected]. Address: School of Business and Management, Queen Mary, Uni-versity of London, Mile End Road, London E1 4NS, United Kingdom. Phone: +44/0 2078827472. Web:
1
Introduction
The minimum wage is typically regarded as a policy variable that exhibits little variability. Indeed, a national minimum wage, if applicable, tends to be revised at a relatively low time frequency, possibly with further (upward) adjustments at a sub-national level. However, in many countries, the number of minimum wages is actually very large and their values vary frequently not only over time and space but also along other dimensions. This situation arises from minimum wages set by collective bargaining agreements, in particular when such agree-ments are extended by a country’s authorities beyond their subscribing employer associations and unions - and their affiliated workers (Traxler & Behrens 2002). Since collective agree-ments typically establish minimum wages for the most used job types and job levels in those firms, their extensions are equivalent to the setting of fully-binding minimum wages, even if only for specific economic sectors or sector-region pairs.
This paper examines empirically some of the main economic effects of such extensions of collective bargaining agreements and the resulting likely large number of binding minimum wages. To the best of our knowledge, our paper is the first to address this important question, in particular from a causal perspective.1 Specifically, we evaluate the impact of extensions in terms of the employment and wage bills of the affected sectors.
Such extensions - which also explain the large wedges between union density and union coverage in many countries - may promote the leveling of the playing field in terms of working conditions (including minimum wages), as they require all firms in a sector to comply with the same set of minimum standards determined jointly by a subset of firms and workers in that sector. Indeed, any ‘unfair’ competition that may follow from firms undercutting a collective agreements’ wage levels is automatically ruled out from a legal perspective once that agreement’s extension comes into force.
On the other hand, the combination of minimum pay levels and other working conditions that follows from a collective agreement, namely in terms of rent sharing (Abowd & Lemieux 1993, Martins 2009b, Card et al. 2014) may not be appropriate for all firms and workers in a sector. In particular, smaller or new firms may target different segments of the product
1
See Margolis (1994) for an earlier, related paper - but focusing on theoretical aspects of collective agreement extensions -, Magruder (2012) an analysis of a developing country, and Murtin et al. (2014) for a cross-country, time series analysis. On the other hand, the minimum wage literature is very large. Recent contributions include Neumark & Wascher (2006), Portugal & Cardoso (2006), and Neumark et al. (2013). See also Avouyi-Dovi et al. (2013) for a related study of collective bargaining.
market, which imply different optimal settings in terms of working conditions, especially in a context of globalisation and technological change. Indeed, extensions may be seen as a tool to raise rivals’ costs, therefore distorting competition in a given sector (Haucap et al. 2001). Moreover, the clearing of the labour market during downturns may require greater flexibility in working conditions than the one established in collective agreements, in particular in low inflation environments (European Commission 2011).
Our examination therefore also contributes to a more comprehensive understanding of minimum wages, whose potential role is much wider than that stemming from a single value over a period of time, typically affecting only a relatively small subset of low-skilled workers. In fact, as indicated above, the many countries that extend collective agreements, including France, Germany, Italy and Spain (du Caju et al. 2008, Visser 2013), are in fact subject to many thousands of minimum wages, potentially binding most workers, and evolving in a partly decentralised way, with yerly adjustments in many instances. These circumstances also magnify the scope for downward nominal wage rigidity effects (Steinar & Fredrik 2008, Martins et al. 2010, Dias et al. 2013).
Our empirical analysis is based on particularly rich data from Portugal, a country where extension mechanisms have been used widely until recently (Cardoso & Portugal 2005, IMF 2011, Martins 2014), leading to nearly 30,000 de facto minimum wages, as indicated in the title of the paper. In fact, and as will be shown later, approximately 90% of the sectoral collective agreements issued in the period under analysis (2007-2011) were subject to extensions, even if in most cases the representativeness of the bargaining partners was poor. This period is also characterised by increasing unemployment in the country, as it includes the great recession of 2008-09 and the beginnings of the eurozone debt crisis in 2010-11.
Our data is based on a list of all extensions implemented over the period under analysis, including information on their timings and relevant applicable industries. Furthermore, we also draw on monthly records of formal employment, hirings, separations, salaries, and other variables of each firm in the country over the same period. Interestingly, we also examine data on informal service providers - self-employed workers, in many cases in disguised labour relationships -, an important margin of adjustment in segmented labour markets, despite the greater focus of the literature on fixed-term contracts (Blanchard & Landier 2002). We then employ a standard difference-in-differences approach, where we track industry-specific time
series of employment or other variables, and examine their changes following the issuing of the extensions.
Our results, robust to several checks, including a falsification exercise, indicate a strong negative causal effect of extensions upon both employment and wage bills. Over the four months after an extension comes into force, the average employment levels in the sectors affected drop by 2%. Wage bills also drop by a similar magnitude. These changes are driven by a strong negative effect of extensions upon hirings and firm closures, but not in terms of separations or firm openings. On the other hand, informal employment increases, leading to further segmentation between protected jobs and non-standard work forms.
The next section discusses in greater detail some economics of the extensions of collective agreements and also presents the specific case of Portugal, including its labour market and industrial relations. Section 3 describes the data sets used in this paper and some descriptive statistics. Section 4 presents the main results, Section 5 several robustness checks and Section 6 an analysis of firm entry and exit effects. Finally, Section 7 concludes.
2
Collective agreements extensions
Collective agreements are an important building block of employment relations across many countries, in particular in continental Europe. These agreements establish a large number of working conditions that apply to the signatory parties, including minimum wages by job type and job tenure but also many other issues such as working time, fringe benefits, training, health and safety, promotions, contract types, severance pay, bonuses, grievances, etc. Some of these work conditions may be established at a more or less generous level than the conditions that the country’s employment legislation determines as applicable, in the absence of a collective agreement.
Depending on the level of centralisation of the collective agreements (Calmfors & Driffill 1988), the signatory parties will typically be an employer association - representing a number of firms, typically in the same sector, sometimes also from a specific region - and one or more unions - representing a number of affiliated workers, most of whom are employed in the firms represented by the equivalent employer association. Moreover, the scope of collective agreements will initially correspond to the workers subject to the double affiliation principle: workers that are simultaneously members of the subscribing union(s) and that are employed
by firms that are member of the subscribing employer associations. The combination of these two dimensions implies that, across several European countries, with the notable exception of the Nordic region, the direct coverage of collective agreements is relatively small, given the typically low union and employer association density rates, especially in Southern Europe. Non-covered workers have their employment relationships determined instead by individual contracts bargained directly with their employers.
However, collective agreements may also be extended by a country’s authorities, typically the labour ministry in an automatic or discretionary process. In any case, once an extension is in force, the terms of the original collective agreements apply not only to workers subject to the double affiliation principle but also to all workers that work in the industry in which the extension is applicable.2 Collective agreement extensions explain the large gap between union density and union coverage that can be observed in many countries. Once an extension is in force, the affected workers and employers have to follow the terms and conditions of the underpinning collective agreement, including the payment of possibly higher salaries, in comparison to those previously agreed under individual contracts.
The arguments that have been presented for such public intervention in the private bilat-eral bargaining between employers and workers have been manifold, including views similar to those used in support of minimum wages. For instance, extensions lead to the establishment of minimum wages for more qualified workers that do not meet the double affiliation crite-rion and which otherwise would only be subject to a likely non-binding national minimum wage. In this case, such additional minimum wages can increase living standards, promote a more balanced income distribution and foster incentives for firm-specific training. Further-more, monopsony arguments in support of minimum wages may be even more applicable to workers that have moved upwards in a firm’s hierarchy, given the role of firm-specific skills and information asymmetries. More generally, the social dialogue that follows from successful collective bargaining (boosted by the perspective of extensions) can foster the development of a good working environment in the firms involved, with benefits to both sides of the labour relationship.3
However, such higher minimum wage levels may hurt employment levels, in particular of
2Collective agreements can originally be restricted to a given region, in which case the extension is likely to
be restricted to that same region. In any case, for simplicity, we will henceforth only refer to extensions within industries.
3
The author was involved in several discussions with representatives from employer and union confederations in Portugal in which these views were expressed.
the less skilled within job types, while promoting segmentation and youth unemployment. High minimum wages may also lead to higher prices, with negative effects in terms of the purchasing power of the poor. On the other hand, the width of minimum wages and the resulting downward nominal wage rigidity could diminish significantly the ability of the labour market to accommodate negative shocks.4 Indeed, extensions magnify the scope for downward
nominal wage rigidity effects in times of low inflation and or economic downturns (Steinar & Fredrik 2008, Martins et al. 2010, Dias et al. 2013) even in countries where real wage rigidity is not present when inflation is higher (Martins et al. 2012).
Moreover, the absence of extensions could promote ‘unfair competition’ from firms outside employer associations that pay lower wages than those set in collective agreements. These firms can therefore charge lower prices in the relevant product market, undercutting their com-petitors that are subject to the more generous working conditions that follow from collective bargaining. In the absence of extensions, such competition will exert a downward pressure on wages. On the other hand, as OECD (2012) put it, when recommending that extensions are abolished altogether in Portugal, ’[...] dominant firms impose wage and working conditions on others via the administrative extension of collective agreements, reducing competition and entry, thereby hurting competitiveness’, echoing the views in Haucap et al. (2001). Another related aspect is that minimum wages established or influenced greatly by social partners (the national-level representatives of employer associations and unions) tend to be higher than those without social partner intervention (Boeri 2012).
It is also important to note that the incentives for membership of employer associations are positively affected by extensions. If these are likely to be issued, membership would be more advantageous as it would allow one to influence the outcome of a collective agreement. If not, then members would have to follow a collective agreement while non-members would benefit from the greater flexibility of individual bargaining or firm-specific collective agreements. On the other hand, the incentives for workers to become union members are diminished by the prospective of an extension given the resulting scope for free-riding.
4
Jimeno & Thomas (2013) compare labor market outcomes under firm-level and sector-level bargaining in a Mortensen-Pissarides economy with firm-specific productivity shocks and find that unemployment is lower under firm-level bargaining.
2.1 The case of Portugal
In Portugal, the country studied in our empirical analysis, employment law establishes that ’[a] collective agreement [...] in force can be applied, entirely or partly, by an extension ordnance to employers and employees in the economic activity and profession considered in the collective agreement’ (article 514 of the Labour Code). Furthermore, ’[t]he extension is possible after weighing the social and economic circumstances that may justify it, in particular the identity or economic or social similarity of the cases in the extension and the underlying collective agreement.’.
Until early 2011, collective agreements were typically always extended by the Govern-ment following a request from one (or both) of its subscribers (the union or the employers’ association). This extension would widen the domain of the collective agreement, originally limited to those workers affiliated with the union and employed by a firm affiliated with the employers’ association, to all workers employed in the relevant industry. This original do-main, before extension, was usually particularly small, as in many other (Southern) European countries: for instance, Portugal & Vilares (2013) reports that only 11% of the private sector workforce in Portugal is unionised. Moreover, union rates are higher in more concentrated sectors, where the scope for rent sharing is stronger (Abowd & Lemieux 1993, Martins 2009b) while the heterogeneity of firm types is likely to be less pronounced.
Another important aspect in the case of Portugal is that general employment law, which is applicable to all workers, is already considerably detailed, covering most aspects also regulated in collective agreements. In fact, the OECD Employment Protection Legislation international rankings typically placed Portugal in the top positions across its different dimensions during the period covered in our empirical analysis (OECD 2012). This implies that the most im-portant provisions that are actually introduced by collective agreements (and extensions, in a second stage) concern the minimum wages per job type and not other aspects of the labour relationship.
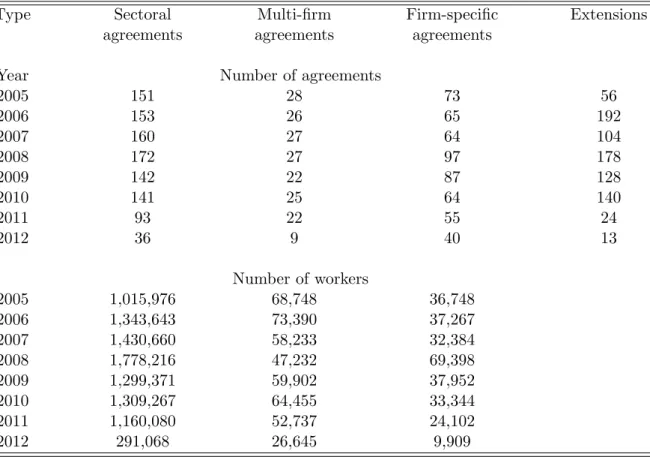
Table 1 presents statistics about new and revised collective agreements and their extensions in Portugal in each year over the period 2005-2012. Collective agreements are split into their three main categories, depending on the employer side of the bargaining: an employers’ association, a group of firms, or a single firm. Extensions are almost always only applied for and issued in the first case as the latter two concern only on one firm or a small set of firms
(typically belonging to the same holding or economic group).5
The figures suggest a very high level of sectoral centralisation of bargaining in Portugal. Indeed, sectoral agreements are clearly the most predominant form of collective agreements, at about 150 per year up to 2010. This figure compares to about only 25 multi-firm agreements and 70 firm-specific agreements, in a context of a total of more than 300,000 firms in the country. More importantly, a large percentage (about 90%) of sectoral agreements are subject to extensions over the period.6 The figures also indicate that, in 2011 and, in particular, in 2012 there is a steep decline in collective agreements (except in the case of firm-specific ones) and extensions. This development follows from the adjustment programme adopted in Portugal - discussed in more detail below - and used in one of our robustness checks (Subsection 5.5).
Another important component of Table 1 concerns the number of workers affected by the new and revised collective agreements of each type and in each year, including also the effect of the extension.7 Between 2005 and 2010, in the case of sectoral agreements, these numbers average 1.4 million workers per year - or approximately half the size of the private sector employment level in Portugal. Multi-firm and firm-specific agreements have a much smaller scope, of about 50,000 workers each per year. Also noteworthy is the large decline in sectoral agreement coverage in 2012, when both the number of agreements and extensions is substantially smaller.
It is also important to note the timing of the production of effects of the extension, which typically coincided with the production of effects of its underpinning collective agreement. This ensures that the collective agreement can be applied to all workers from the same time, regardless of their union affiliation or the employer association affiliation of their firms, typ-ically January. However, this practice also forced employers bound by the extension to pay immediately or over a short period any resulting wage arrears - from the differences since the production of effects until the publication of the extension in terms of the actual wages and the new floors set by the collective agreement. This may exacerbate any negative effects of extensions on employment, particularly for liquidity constrained firms.
Finally, we mention that a new extension framework was established in 2012, requiring
5See Hartog et al. (2002) for a comparison of wages under different collective agreement types. 6
The number of extensions exceeds that of agreements in some years because some extensions concern agreements signed in the previous year.
7
Given that there is no information about workers subject to the double affiliation at least until 2010, it is not possible to obtain statistics about the number of workers affected before the extension.
that the employers that subscribe to the collective agreements should employ at least 50% of the workers in the sector in which the extension is to be issued. This followed from a commitment by the Portuguese Government, in the context of its 2011-2014 economic and financial adjustment programme, to ‘define clear criteria to be followed for the extension of collective agreements and commit to them. The representativeness of the negotiating organisations and the implications of the extension for the competitive position of nonaffiliated firms will have to be among these criteria’. Simultaneously, the Government also agreed with the troika ‘that, over the programme period, any increase in the minimum wage will take place only if justified by economic and labour market developments and agreed in the framework of the programme review’, which resulted in a minimum wage freeze over the period 2012-2014.8
3
Data
This empirical paper draws on two novel data sets. The first one is obtained from monthly social security records covering the entire population of firms in Portugal between January 2007 and June 2012. These data are of high quality as they are used for the processing of social security contributions (typically 34.75% of the salary of each employee).
The records available indicate the number of formal employees as well as the number of service providers contracted by each firm in each month.9 The records also indicate additional variables such as the number of new hires and leavers (only in the case of workers, not service providers) and the wage bills (both of workers and service providers) of each firm in each month. An additional variable is the industry affiliation of the firm, according to an ISIC rev. 4 five-digit code.
The data set originally comprises over 26.1 million firm-month observations, which refer to 646,788 different firm identifiers. Each firm appears in the data set a mean of 40.4 times over the 66 months covered. The average firm size, in terms of the number of employees, is 7.5. Moreover, the total number of workers per month varies from a peak of 3.09 million (in July 2008) to a trough of 2.82 million (in April 2012), consistent with the business cycle over
8
Since mid-2011 a number of reforms has been implemented towards making the labour market more flexible and competitive while eroding the segmentation between insiders and outsiders. These reforms included cuts in severance, wider economic dismissals procedures, greater flexibility in working time arrangements, a reduction in the number of holidays and bank holidays and greater scope for the involvement of workers’ councils. Additional reforms were also introduced over the period in terms of unemployment benefits, access to regulated professions, training and active labour market policies (IMF 2011, Martins 2014).
9These service providers are typically know as ’recibos verdes’. Several other countries have similar work
the months covered.
The second key data set used lists all extensions of collective agreements issued between January 2008 until December 2011. The data set also includes information about the relevant industry affected by the extension, in terms of a two- to five-digit ISIC rev. 4 code, depending on the width of the collective agreement. This information is obtained by the Ministry of the Economy and Employment of Portugal from the texts of both the individual collective agreements and extension orders.
According to this second data set, a total of 375 extensions were issued between 2008 and 2011: 136 in 2008, 106 in 2009, 116 in 2010 and 17 in 2011.10 The extensions have been published relatively uniformly across all months over the four years analysed, with a peak of 69 in February and a trough of 17 in June. 2011 is an exception, as all 17 extensions were published until May, given the political context described above.
As to the timing of when extensions enter into force (in many cases before they are issued, as discussed above), this is heavily concentrated in January (276 extensions across the different years, out of the total of 375), in order to coincide with the typical time of production of effects of the collective agreement underpinning the extension. The average difference between the two dates (publication and production of effects) over the 372 extensions for which both dates are available is 10.4 months. This implies that firms directly affected by the extension (i.e. that paid salaries in between the minimum levels determined by the previous and the new versions of the relevant collective agreement) will be forced to back-date possibly substantial wage increments.
Given that each extension may cover more than one industry, and each industry may be indicated at a different level of aggregation, we reshape the list of extensions in terms of specific industry/extension combinations. Furthermore, each extension industry code was also matched to all corresponding relevant five-digit industry codes.11 This resulted in a set of 963 five-digit-industry/extension pairs, scattered across 51 two-digit industries. The largest
10
These figures do not correspond exactly to those of Table 1 since they refer to extension orders while those in the table refer to the number of collective agreements that were subject to extensions. Occasionally one extension covers more than one agreement, particularly when an employer’s association celebrates the same agreement with two different unions.
11This relevance criterion is met when there is at least one firm under such industry code in the social security
data set. As an example, consider the extension of a collective agreement in the metal manufacturing sector involved both ISIC codes 25 (‘Manufacture of fabricated metal products, except machinery and equipment’) and 265 (‘Manufacture of measuring, testing, navigating and control equipment’). These two codes corresponded to 29 five-digit industries under sector 25, from 25110 to 25992, and six five-digit industries under sector 265, from 26510 to 26530.
number of extensions are found in manufacture of food products (ISIC 10, 100 extensions), crop and animal production (01, 72), retail trade (47, 78), wholesale trade (46, 67), and manufacture of computer, electronic and optical products (26, 56).
It should be mentioned that, in the same way that extensions apply only to specific indus-tries, they may also apply only to specific occupations or to specific regions. However, given that we do not have information about the breakdown by occupation of the employment of each firm in our data set, we assume that all extensions cover all workers in the relevant in-dustry. This is likely to be the case in the majority of extensions. In any case, this assumption will introduce some degree of measurement error in our analysis that will bias downward our estimates presented in the next two sections. As to the regional dimension, we disregarded in our main results the 71 extensions of collective agreements that we considered of a subnational scope, given that we do not have information on the regional location of the establishment in our data set.
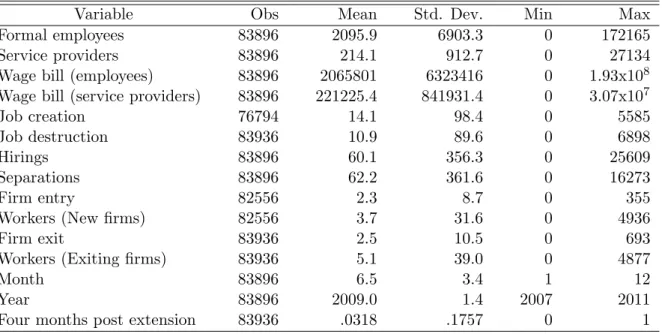
Finally, the two main data sets are merged in order to obtain combined information about employment levels across industries and the timing of the publication of the collective bargain-ing extensions. Table 2 presents descriptive statistics of the resultbargain-ing data set, coverbargain-ing nearly 84,000 observations. The mean employment level across those industry-month observations is 2,095 (with a standard deviation of 6,903), while the mean wage bill is 2.07 million euros (with a standard deviation of 6.3). Mean monthly hires are 60.1 individual while the corresponding figure for separations is 62.2. The table also describes a key dummy variable that flags the industry-month observations in the four months after the publication of a relevant extension, which correspond to 0.3% of all observations.
3.1 Case study: the 2010 construction sector agreement
In order to facilitate a better understanding of the process surrounding the extension of col-lective agreements, we provide an illustration based on a specific case study: the construction sector collective agreement signed between the AECOPS employer association (and other em-ployer associations) and the SETACCOP union. This agreement involved a total of 20,000 employers and 300,000 workers, according to its text and based on the total size of the sector (i.e. after the extension was issued, as was typically the case at that time).
worker category, description of main job titles, health and safety, fixed term contracts, trial periods, holidays, overtime, and replacement of workers. Many of these clauses replicated the provisions already in place in the general labour law and in the 2005 version of the collective agreement. The agreement was published in late March 2010, establishing wage floors that came into effect from January 1st. The wage floors ranged from 380 euros (apprentices) to 841 euros (directors and managers), which compare to a minimum wage of 475 euros (380 for apprentices) in that same year.
The agreement was subject to an extension issued in July 2010 towards all workers not directly covered, except those affiliated with another union, given the opposition expressed by that union following the preliminary publication of the extension. The extension also determined that the new wage floors had retroactive effect, from January 1st, 2010, but the overdue wage increments could be paid monthly in up to four installments from September.
The extension legal document provided some additional information about its predicted impact obtained from a background study conducted by the Ministry of Employment. In particular, the study estimated that 60,000 workers would be affected by the new wage floor tables set by the collective agreement for 2010. Of those 60,000 workers, 25,000 were earning 6% or more below the new minimum levels. These figures were based on the latest data avail-able at the time, 2008, which were extrapolated to 2010 using an estimate of the inflation level over the period. Moreover, the extension text also indicated that most firms that employed workers that were paid below the new wage floors had nine or fewer employees.
4
Results
Following from our theoretical discussion, there are a number of economic variables that may be affected by the extension of collective agreements. Given the data available, we focus on employment and wage related variables, along both standard, labour-law-regulated dimensions and more flexible, service provision aspects. In the case of the former, we also investigate the impact of extensions upon worker flows, namely hirings and separations.
Our identification approach is based on the scattered timing of extensions: as indicated in Section 3, extensions are issued virtually uniformly along the twelve months of the year over the four year period under study. In this context, we employ a standard difference-in-differences estimator, in which we contrast the development over time of each variable of
interest in industries subject to extensions in terms of other industries namely those where extensions are not issued or not issued at the same time.
The relatively high-frequency nature of the data, at least from the perspective of microe-conometric studies, with up to 60 observations per each one of the 1,500 five-digit industries under study, allows us to control for time-invariant heterogeneity in a detailed way. Overall, our rich data structure also allows us to construct credible counterfactuals of the variables of interest at the time when extensions are more likely to bite.
As to the definition of the relevant time range from the perspective of the impact of the extension, we focus on a dummy variable capturing the four months immediately subsequent to an extension in the relevant sector. This time window strikes us as an appropriate compromise between a period long enough to capture any possible immediate effects while at the same time not too long given the yearly or nearly yearly frequency of the revision and subsequent extension of several collective agreements and their wage floor tables. There is also an inflation effect to take into account, which will prompt the wage increase to be partly cancelled out over time in real terms.12
In this context, we estimate equations of the following format:
Employmentit = βExtensionit+ αi+ γjt+ eit, (1)
The dependent variable in this case, Employmentit, corresponds to the logarithm of the
employment level of industry i in month t. Extensionit is the key regressor of interest, a
dummy variable equal to one in the first four months after the extension of the collective agreement in industry i comes into force (and zero otherwise), i.e. over periods t + 1 to t + 4. Furthermore, αirefers to the (over 1,400) five-digit-industry fixed effects, one for each industry
i, and γjt refers to the (540) time fixed effects, one for each pair of a specific month and a
specific one-digit industry (denoted by subscript j). These time-industry fixed effects allow for an extremely flexible estimation of time patterns, specific to different industries, from which any significant systematic differences in the dependent variable of the relevant industries over the periods immediately subsequent to extensions can be documented, allowing for possible correlations between the timing of extensions and particular trends in the business cycle of the sector at stake.
12
In any case, later we also consider more flexible specifications, namely by allowing for possible anticipation effects or effects stemming from the collective agreements before extensions are issued.
Table 3 presents our main results, following the specification above. Besides Employment, we also consider complementary dependent variables such as Hirings, Separations, and Wage bills (of workers and service providers).13 Moreover, given the logarithmic transformation of the dependent variable, the coefficients on the Extensionit dummy variable reported can
be interpreted as a percentage effect. The result presented in column 1, top row, indicates that the average number of total workers in an industry falls by 2% over the four months subsequent to an extension. To the extent that real wages increase by 2% to 4% over the period, the implicit elasticities of labour demand can be estimated to range between .5 and 1, the latter value at the top of the typical range of estimates in the literature.
Additionally, when considering separately hirings and separations, the results in columns 2 and 3, top row, indicate that the industry size effect is driven essentially by the former, which fall by over 4%, while separations are not affected. On the other hand, service providers, not subject to the extensions’ wage floors (nor to any aspect of labour law), see their number increase by 1.4%. However, since, as indicated in Table 2, the number of service providers by industry is typically far smaller than that of formal employees (214 vs 2,096, on average), the increase in the former does not compensate for the decrease in the latter in aggregate terms. We now turn to the second main row of Table 3, which focuses on different measures of wages. The results indicate that the wage bill of workers, i.e. the sum of all salaries paid to formal workers, falls by 2.2% on average over the four months following an extension. This coefficient is of the same sign and virtually the same as the one obtained for the number of underlying workers (-2%). This result indicates that the net effect on the wage bill is driven by (lower) quantities and not (higher) prices, a point that we also address below.
The remaining results of the second main row of Table 3 indicate a wage bill effect amongst service providers similar to that of the number of service providers (1.1%). More importantly, the total wage bill effect (-2%) is shown to be very similar to the employee wage bill effect, as expected from the fact that, as indicated in Table 2, the spending on service providers by industry is typically far smaller than that on formal employees (two vs 0.2 million euros, on average). Finally, consistently with the effects on the number of workers and on their wage bill, the average wage is not affected significantly. This result indicates a spillover effect in that the wage increases for continuing workers previously paid below the then applicable minimum wage tend to be cancelled by lower wage growth of their colleagues already paid
13
above the new minimum wage.
Overall, these results clarify the theoretical discussion in terms of the important finding that the extensions of collective agreements have a detrimental effect on employment. In ag-gregate, industry-level terms, any gains from a level-playing field set by employer associations and unions do not compensate the employment losses from wage floors potentially above the marginal products of a number of workers employed by firms bound by the extensions. We also find that the negative employment effect is driven by a reduction in hirings and not by an increase in separations. This is consistent with evidence that adjustments are made primarily by reducing entry and not by increasing separations (Abowd et al. 1999), in a context of simultaneous hirings and separations in firms. This can be particularly important in settings characterised by high separation costs of permanent workers as those resulting from strict em-ployment protection legislations, as in Portugal (Blanchard & Portugal 2001, Martins 2009a, OECD 2012).
On the other hand, the fact that the number of non-regulated service providers increases suggests that there are important substitution effects between the two forms of labour con-sidered here (formal employment and informal work). These can be seen as a response to the increase in the minimum wage levels prompted by the extensions. This result is also relevant from the perspective of the literature on segmented labour markets and the effects of partial labour market reforms (Blanchard & Landier 2002), even if this literature has focused on the split between permanent- and fixed-term contracts, disregarding the further segmentation in terms of informal work that we examine here.
In any case, the employment effect (even including service providers) is shown to be similar to the wage bill effect and, in particular, both are of a negative sign. This result is important also in terms of the debate on the potential of internal demand stimuli during downturns via administrative wage increases. Our case study of Portugal indicated that extensions not only undermine employment - they also contribute to even lower levels of aggregate demand. In other words, the aggregate internal demand gains in terms of higher salaries for those that keep their jobs do not compensate the losses in salaries from those whose positions are discontinued or that are not even hired in the first place.
5
Robustness
5.1 Timing of the effects
In this section, we present a number of robustness checks regarding the main results of Table 3. First, we assess in greater detail the timing of the effects upon the main variables drawing on our high-frequency, monthly data. In particular, we estimate equations of the following structure: Employmentit= 5 X k=−3 βkExtitk+ αi+ γjt+ eit. (2)
This equation follows closely the format of equation 1 and all variables have the same interpretation as in there. Extitkare now a set of nine dummy variables, each equal to one in
a specific month before or after the extension is issued, from the third month before to the fifth month after, including the same month when the extension is issued. This specification allows for the estimation of a time profile of specific month effects, including before the extension, as in anticipation effects.
Table 4 presents the results for each one of the five key variables from Table 3. The first column, concerning the number of formal employees, presents a monotonic path of effects, starting at -1.4% in the same month that the extension is issued (significant only at the 10% level) and increasing gradually to -2.3% (significant at the 5% level) at the fourth month after the extension. The second column examines the effect of extensions on hirings and finds that they have their highest value on the month of the extension, at -9.4% (significant at the 1% level) and average -6% (significant at least at the 5% level) along the following four months, except in one case. There is some evidence of anticipation effects, in terms of coefficients significant at the 10% level in the two months before the extension. As to separations, the results indicate that there is not any significant effect across the nine months considered, consistently with the results of Table 3.
In terms of wage bills, the effects are significant in the case of formal employees on the first, third and fifth months after the extension, at about -2.5%. In the case of service providers, the effects are significant over the months before the extension, the month of the extension itself and two months after (the first and the fourth), at about 2% to 3%. This case - service providers - is the only across the five variables in which there is evidence of effects before
the extension is issued, while in the case of the number of workers and hirings there is also evidence of effects in the actual month of the extension.
Overall, this month-by-month analysis supports our choice of a four-month time window for the identification of the main effects. In particular, we find clear spikes in the effects (both in terms of point estimates and statistical significance) across different outcome variables once the extension is in force. These then tend to die out at the end of our preferred time window. In the case of separations, for which we find no evidence of effects in our main results, the detailed month-by-month analysis also indicates no impact of extensions in any of the nine-month period considered.
5.2 Firm types
In our second set of robustness checks, we start by focusing on the effects of extensions upon smaller firms. From our theoretical discussion, any negative effects of extensions on employment are likely to be stronger amongst them. Smaller firms will tend to exhibit lower marginal products of labour, which will make them more sensitive to increases in wage floors, especially when facing liquidity constraints (Cabral & Mata 2003). We conduct our analysis of this question by constructing a new time series of employment and other variables by industry using only information from firms whose average size over the 2007-2011 period is not greater than nine employees.
The results, presented on the first row of Table 5, indicate that the negative effect on employment documented above is not only robust as it increases, by approximately 50%, when focusing on smaller firms: -2.6% for this subset of the firm size distribution, compared to -2% for the full population. Hirings are also negatively affected - by -2.2% - while, as before, separations do not change systematically in the months just after extensions. Also consistently with the main results, the wage bill of formal workers falls (-2.2%), by slightly less than the effect on the number of workers. The only exception in terms of the similitude of the two sets of results is that, unlike before, there is no positive effect on the wage bill of service providers amongst small firms.
Table 5 also presents estimates obtained separately for the manufacturing and services sectors. The results again prove robust, in particular the key finding of negative effects on employment, at -1.9% and -1.4% respectively. Separations are not affected, as before, while
hirings fall, albeit only significantly in the case of manufacturing. The wage bills also respond in the same direction as in the main results, although only significantly in the case of services (service providers).
5.3 Common support
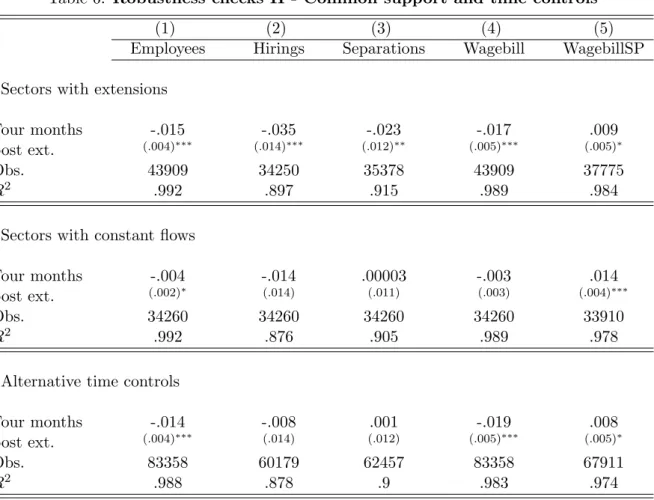
An important additional area for robustness purposes is the similarity between different sec-tors. Given our identification approach based on a difference-in-differences estimator, it is important to draw on contrasting sectors that can be argued to provide credible counterfac-tuals. Table 6 presents a number of additional analyses under this approach, complementing those by economic sector conducted in the previous subsection.
The first analysis here considers only sectors where extensions are effectively carried out. This choice follows from the fact that, as indicated above, a large number of sectors do not exhibit any extensions over the period concerned, largely because they did not establish collective agreements over those years. We consider only the three-digit industries that report at least one extension over the period under analysis and all observations of their five-digit industries. In this way, we can focus on an arguably more comparable control group of industries that do not exhibit extensions, in the spirit of a (difference-in-differences) matching approach, although at a potential cost in terms of the representativeness of the sample.
Reassuringly, the results under this analysis are particularly similar to those of Table 3, even if the number of observations falls by approximately half. According to the results presented in the first row of Table 6, the effect of extensions on the number of workers and on their wage bill is of -1.3% and -1.5% (significant at the 1% level), the effect on hirings is -3.5% (significant at the 1% level), the effect on separations is -2.3% (significant at the 5% level) while the effect on service providers’ wage bill (0.9%) is significant only at the 10% level.
The second row of Table 6 takes a different perspective on the common support criterion by considering only those sectors that consistently report hirings and separations in every month over the 2007-2001 period. This criterion implies that, unlike in previous estimations, the number of observations is always the same for the four main variables (34,260). However, the comparability of treated and control groups is less appropriate than in the approach of the first row given that, for instance, those sectors can belong to very different industries. In any case, once again the same qualitative results are found, namely of decreases in the number of
workers and hirings and no effects on separations, despite declines in terms of significance and even magnitude of the coefficients. The negative effect on the main wage bill is not significant, unlike the positive effect of the service providers wage bill.
5.4 Time differences
The third row of Table 6 is concerned with the sensitivity of the results to different approaches in controlling for time effects. Instead of the already very flexible set of controls adopted in all results, based on a dummy variable for each month of each year in each one-digit industry, we consider here a specification based on quadratic time trends by two-digit industries. The results are again consistent with the previous evidence, in particular in the negative effects on workers and hirings and the positive effect on the service providers’ wage bill. However, we find in this case also evidence of a (marginally significant) positive effect on the wage bill of workers.
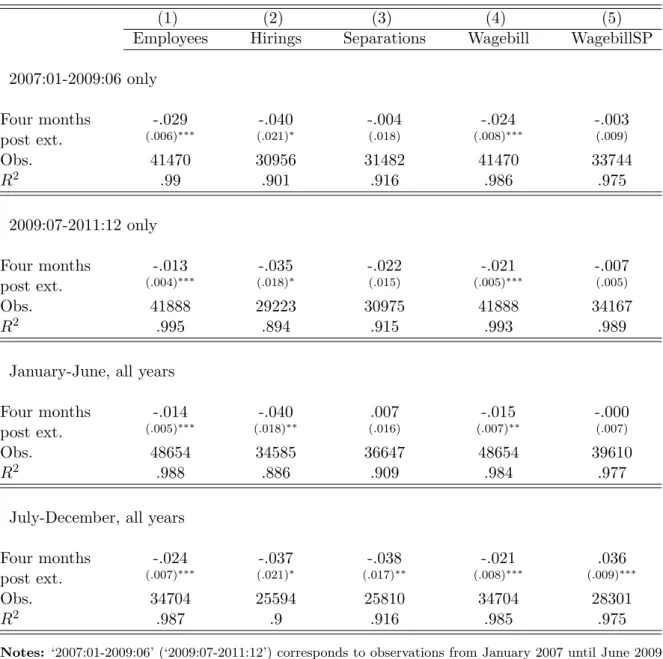
The last analysis underlines the potential importance of specific time periods in explaining the effects documented. In fact, as in Portugal the years 2008, 2009 and 2011 were of recession while 2007 and 2010 were of moderate growth, these differences in the business cycle may interact in some way with the extensions. Moreover, while extensions were issued across each year, their production of effects tended to be concentrated in January in order to coincide with the production of effects of the underlying collective agreement. This may also generate interactions between the extensions that confound the effect of the latter.
In order to assess in greater detail the possible effects of different extensions over time, we split the observations of the data set into different smaller periods. In particular, we split the five-year period considered in two ways. First, from January 2007 until June 2009 and from July 2009 until December 2011 (first and second rows). Second, January to June and July to December of all years (2007 to 2011, third and fourth main rows). Table 7 presents the results, which are again very similar to the benchmark findings of Table 3. The main effect, on the number of workers, is always significantly negative, ranging between -1.3% and -2.9%. Similarly, the effect of extensions on hirings is always significantly negative, in this case ranging from -3.7% to -4%., as in the cases of the effects on the workers’ wage bill. Finally, the effects on separations and the service providers’ wage bill are always insignificant, with the exception of the months of July to December, when they are negative (-3.8%) and positive
(3.6%), respectively.
5.5 Falsification exercise
The agreement signed between Portugal and the European Union and the International Mon-etary Fund in May 2011 (IMF 2011) led to a suspension of the extension of collective agree-ments by the new government that took office in June. This suspension was in force until early 2012, when new criteria for extensions were under preparation. However, a number of collective agreements had their administrative process of extension started by June 2011, namely through the publication of notices by the Ministry of Labour indicating the intention of extending such agreements following the request by the collective agreement subscribers.
Although those extensions did not come into force at least until mid-2012, they can be used to provide further evidence on the causal interpretation of our results. If, as we argue, following the evidence presented above, the increase in minimum wages determined by extensions hurts employment in the sectors affected, then extensions that are announced but do not actually come into full force should not have such negative, wider employment effects. For instance, an alternative interpretation may be that the negative effects documented here are driven not so much by the extension itself but instead by the coming into force of the collective agreement subject to the extension.14
We conduct this additional check on the validity of our results under a falsification ap-proach. More specifically, we identified a set of 15 such potential extensions which had been subject to a preliminary public notice and that also meet the condition of being linkable to collective agreements that were subject to extensions in previous years. These agreements cover a wide set of industries, such as Security services, Chemical and pharmaceutical prod-ucts, Textiles, Food distribution, Furniture, Merchandising, Meat distribution, Bread, and Fish processing. As explained above, collective agreements tend to be revised regularly, on a yearly or lower frequency. Such revisions tend to be focused on the wage floors set for each job type and job category although they occasionally also include other provisions. This time linkage allows us to use the information collected by the Ministry of Labour regarding the agreements - and their potential extensions - namely along the range of industries
poten-14
This concern is not supported from the results regarding the timing of the effects (Table 4), which tend to coincide with the actual timing of the extension, although in a few cases they start one or two months before. However, even such few indications of ‘antecipation’ are reconcilable with the fact that extensions are announced before they are issued and come into effect. Furthermore, collective agreements are disclosed before that and, over the period examined, were virtually always subject to an extension.
tially affected. This linkage is conducted under the assumption that the industry ranges are unchanged from previous, equivalent collective agreements.
After that, we created a data set with exactly the same characteristics as the one used for our main analysis, except that the only extensions considered are those from the specific set of 15 discussed here, and used it for the same type of analysis presented above, namely those based on equation 1. Given that these specific extensions were not issued and the dates when extensions are issued are used for the key right-hand-side four-month dummy variable, we imputed the likely date of issuance based on previous extensions of previous versions of the same reference collective agreements and historical information on the typical time gap until the publication of the extension (two months). In our final data set, only the 15 extensions have the ‘Four months post extension’ dummies switched on. These are also the only ones whose potential impacts on the dependent variables are considered in the table. Moreover, given that these potential extensions would be issued only between May and September of 2011, we restricted the sample used here to the second half of our period, i.e. to 2009:07-2011:12 (as in the second main row of Table 7), in order to draw on a more comparable distribution of observations between the ‘before’ and ‘after’ periods.
Table 8 presents the results. Unlike in our main findings (Table 3) on the results specific to the subperiod considered, we now find that all main coefficients are insignificant, in particular in the case of the number of workers (1.2%, with a standard error of 1.1%). The only exception is the wage bill of service providers but that has the ‘wrong’ sign (-2.7%) and is significant only at the 10% level. Other restrictions on the data set, similar to previous robustness checks, generate similar results, in particular involving no effects on employment or hirings (results available upon request).
We interpret the results from this falsification exercise as additional evidence of a causal relationship between extensions and the different economic variables studied here, as well as providing a more precise perspective of the actual mechanism underpinning the results. Specifically, we find that only those extensions that become legally binding have negative effects on employment and other economics variables. This result also indicates that collective agreements by themselves do not necessarily have negative effects, provided their scope is not extended beyond bargaining parties.
6
Firm entry and exit effects
Given the important effects documented above regarding employment flows, it is of interest to investigate their underpinnings also in terms of the firm entry and exit margins. If the working conditions and, in particular, minimum wages set by extensions are not affordable by some firms, then an effect in terms of firm exit could be anticipated. Similarly, entrepreneurs may be discouraged from launching new businesses when they face less flexibility in the wage conditions that may offer their new workers. This approach is even more relevant given the evidence presented before of stronger negative employment effects amongst smaller firms.
We examine these questions by constructing a new data set derived from the original monthly information on all firms. Specifically, first we identify new firms as those whose individual identifiers appear for the first time in the data in a given month, while old firms are those whose individual identifers appear for the last time in the data in a given month. We then create a count of their number per month, as well as of the number of formal employees and service providers per month. The latter two variables indicate the flows of workers and service providers that join (leave) the industry at the time the firm enters (exits) the market, as in the context of the literature on job and worker flows (Abowd et al. 1999). We then employ the same estimation approach as that of equation 1, considering the log of the number of firms, formal employees and service providers as the alternative dependent variables, separately for firm entry and firm exit.
Table 9 present the results. The first row considers firm entry effects, where all coefficients are statistically insignificant. This indicates that the emergence of new firms is not affected by the extension of collective agreements. The same applies to the time series of formal employees and service providers hired by such new firms, which are not significantly different at the months immediately following the extensions. However, when turning to the second row of Table 9, which considers firm exit effects, we find the number of firms that leaves an industry increases significantly - by 4% - over the four months subsequent to an extension. The effect on service providers is similar (4.3%), while the coefficient on the workers specification is also equivalent in magnitude (5%) but, unlike before, not significant.
We take these results - in particular, the increased firm exit - to add further support to the view that extensions create difficulties for some firms, particularly given the noisiness inherent in firm-level monthly data on entry and exit. Such noisiness can explain the absence
of significant effects on firm entry, although noncompliance may also be more significant amongst new firms, to the extent that they are not fully aware of all regulations that they are subject to.
The fact that the exit effect is significant as far as the number of service providers is concerned but not in terms of formal workers can be potentially explained by a greater reliance upon the former by firms most affected by the extensions. Such firms may have a preference towards informal workers which makes the hardening of the worker conditions imposed on their formal labour force component - which tends to represent a greater share of the total wage bill, at least on average, as discussed before - more difficult to withstand, prompting their closure. Additionally, the difference in the statistical significance between the firm number and workers effects may be explained by a smaller average firm size of firms that exit following an extension. As indicated before, smaller firms have lower average employer association membership rates and are thus less likely to see their interests regarding working conditions considered during their bargaining with unions. Moreover, our results from Section 5.2 indicate that small firms are more negatively affected by extensions.
7
Conclusions
Several countries extend collective bargaining agreements to entire sectors, therefore binding non-subscriber workers and employers and widening substantially the number of minimum wages that may be binding across a given country. These extension procedures may address coordination issues in a sector, freezing competition along some human resource management dimensions, promoting greater equity in pay, fostering investments in human capital and prompting managers to focus their work on other areas of their businesses. On the other hand, extensions may impose sector- and or occupation-specific minimum wages and other work conditions that are not appropriate for many firms and workers, especially if the collective agreement subscribing unions or employer associations are not representative. Moreover, extensions increase the scope for downward nominal wage rigidity, with potential negative effects on employment, particularly during downturns in low-inflation environments as in the eurozone recently.
In this paper, we analyse empirically the impact of extensions along several relevant eco-nomic margins drawing on firm-level monthly data for Portugal, a country where such
exten-sions have been widespread until recently, leading to nearly 30,000 de facto minimum wages (one for each main job in each industry). Our results, based on a difference-in-differences approach, indicate that extensions have a significantly causal negative effect on employment. In the four months after an extension is issued, formal employment falls on average by 2%. Also, this effect is 25% larger across small firms, those less likely to be represented in col-lective agreements negotiations. Firm closures are also found to increase significantly in the months after an extension is issued in the respective sector. Given the increasing rate of un-employment (and particularly youth unun-employment) over the period, coupled with evidence of substantial nominal wage rigidity (Dias et al. 2013), such employment losses are not likely to have been absorbed by other sectors.
Furthermore, the effect of extensions on sectoral wage bills is also negative, as the em-ployment impact outweighs the wage increase resulting from extensions. On the other hand, informal work, which is not subject to collective agreements or to labour law, tends to increase, contributing towards greater labour market segmentation.
References
Abowd, J. M., Corbel, P. & Kramarz, F. (1999), ‘The entry and exit of workers and the growth of employment: An analysis of French establishments’, Review of Economics and Statistics 81(2), 170–187.
Abowd, J. M. & Lemieux, T. (1993), ‘The effects of product market competition on collective bargaining agreements: The case of foreign competition in Canada’, Quarterly Journal of Economics 108(4), 983–1014.
Avouyi-Dovi, S., Fougre, D. & Gautier, E. (2013), ‘Wage rigidity, collective bargaining, and the minimum wage: Evidence from French agreement data’, Review of Economics and Statistics 95(4), 1337–1351.
Blanchard, O. & Landier, A. (2002), ‘The perverse effects of partial labour market reform: Fixed-term contracts in France’, Economic Journal 112(480), F214–F244.
Blanchard, O. & Portugal, P. (2001), ‘What hides behind an unemployment rate: Comparing Portuguese and U.S. labor markets’, American Economic Review 91(1), 187–207.
Boeri, T. (2012), ‘Setting the minimum wage’, Labour Economics 19(3), 281–290.
Cabral, L. & Mata, J. (2003), ‘On the evolution of the firm size distribution: Facts and theory’, American Economic Review 93(4), 1075–1090.
Calmfors, L. & Driffill, J. (1988), ‘Bargaining structure, corporatism and macroeconomic performance’, Economic Policy 3(6), 16–61.
Card, D., Devicienti, F. & Maida, A. (2014), ‘Rent-sharing, holdup, and wages: Evidence from matched panel data’, Review of Economic Studies 81(1), 84–111.
Cardoso, A. R. & Portugal, P. (2005), ‘Contractual wages and the wage cushion under different bargaining settings’, Journal of Labor Economics 23(4), 875–902.
Dias, D. A., Marques, C. R. & Martins, F. (2013), ‘Wage rigidity and employment adjustment at the firm level: Evidence from survey data’, Labour Economics 23(C), 40–49.
du Caju, P., Gautier, E., Momferatou, D. & Ward-Warmedinger, M. (2008), Institutional features of wage bargaining in 23 European countries, the US and Japan, ECB Working Paper 974, European Central Bank.
European Commission (2011), Chapter 4: Wage flexibilisation and the minimum wage, in European Commission, ed., ‘Industrial Relations in Europe 2010’, European Commission, Brussels.
Hartog, J., Pereira, P. T. & Vieira, J. C. (2002), ‘Bargaining regimes and wages in Portugal’, Portuguese Economic Journal 1(3), 237–268.
Haucap, J., Pauly, U. & Wey, C. (2001), ‘Collective wage setting when wages are generally binding: an antitrust perspective’, International Review of Law and Economics 21(3), 287– 307.
IMF (2011), Memorandum of economic and financial policies: Portugal, Technical report, International Monetary Fund, Washington.
Jimeno, J. F. & Thomas, C. (2013), ‘Collective bargaining, firm heterogeneity and unemploy-ment’, European Economic Review 59(C), 63–79.
Magruder, J. R. (2012), ‘High unemployment yet few small firms: The role of centralized bargaining in South Africa’, American Economic Journal: Applied Economics 4(3), 138– 66.
Margolis, D. (1994), Government extension of collective bargaining agreements, Working pa-per, Universite Paris 1.
Martins, P. S. (2008), ‘Worker churning and firms’ wage policies’, International Journal of Manpower 29(1), 48–63.
Martins, P. S. (2009a), ‘Dismissals for cause: The difference that just eight paragraphs can make’, Journal of Labor Economics 27(2), 257–279.
Martins, P. S. (2009b), ‘Rent sharing before and after the wage bill’, Applied Economics 41(17), 2133–2151.
Martins, P. S. (2014), Labour market reforms in Portugal, 2011-2013: An inside perspective, Working paper, Queen Mary, University of London.
Martins, P. S., Solon, G. & Thomas, J. P. (2012), ‘Measuring what employers do about entry wages over the business cycle: A new approach’, American Economic Journal: Macroeco-nomics 4(4), 36–55.
Martins, P., Snell, A. & Thomas, J. P. (2010), ‘Downward Wage Rigidity in a Model of Equal Treatment Contracting’, Scandinavian Journal of Economics 112(4), 841–863.
Murtin, F., de Serres, A. & Hijzen, A. (2014), ‘Unemployment and the coverage extension of collective wage agreements’, European Economic Review 71, 52–66.
Neumark, D., Salas, J. I. & Wascher, W. (2013), Revisiting the minimum wage-employment debate: Throwing out the baby with the bathwater?, NBER Working Paper 18681. Neumark, D. & Wascher, W. (2006), Minimum wages and employment: A review of evidence
from the new minimum wage research, NBER Working Paper 12663. OECD (2012), OECD economic surveys: Portugal 2012, Report, OECD.
Portugal, P. & Cardoso, A. R. (2006), ‘Disentangling the minimum wage puzzle: An anal-ysis of worker accessions and separations’, Journal of the European Economic Association 4(5), 988–1013.
Portugal, P. & Vilares, H. (2013), Labor unions, union density and the union wage premium, Economic bulletin, Bank of Portugal.
Steinar, H. & Fredrik, W. (2008), ‘Downward Nominal Wage Rigidity in the OECD’, B.E. Journal of Macroeconomics 8(1), 1–50.
Traxler, F. & Behrens, M. (2002), Collective bargaining coverage and extension procedures, Report, European Industrial Relations Observatory.
Visser, J. (2013), Wage bargaining institutions: from crisis to crisis, European Economy -Economic Papers 488, DG ECFIN, European Commission.
Tables
Table 1: Number of collective agreements and extensions, 2005-2012
Type Sectoral Multi-firm Firm-specific Extensions
agreements agreements agreements
Year Number of agreements
2005 151 28 73 56 2006 153 26 65 192 2007 160 27 64 104 2008 172 27 97 178 2009 142 22 87 128 2010 141 25 64 140 2011 93 22 55 24 2012 36 9 40 13 Number of workers 2005 1,015,976 68,748 36,748 2006 1,343,643 73,390 37,267 2007 1,430,660 58,233 32,384 2008 1,778,216 47,232 69,398 2009 1,299,371 59,902 37,952 2010 1,309,267 64,455 33,344 2011 1,160,080 52,737 24,102 2012 291,068 26,645 9,909
Notes: Sectoral agreements (‘Contratos coletivos de trabalho’) are established between one or more employer associations and one or more unions. Multi-firm agreements (‘Acordos coletivos de trabalho’) are established between a group of firms and one or more unions. Firm-specific agreements (‘Acordos de empresa’) are established between one firm and one or more unions. Extensions are issued by the government and widen a collective agreement (typically a sectoral agreement) to the entire sector beyond the workers subject to double affiliation. The number of workers indicated correspond to those bound by a collective agreement after the latter is extended. The number of extensions can exceed that of agreements because extensions can be issued with respect to agreements signed in the previous year.
Table 2: Descriptive statistics - main data set
Variable Obs Mean Std. Dev. Min Max
Formal employees 83896 2095.9 6903.3 0 172165
Service providers 83896 214.1 912.7 0 27134
Wage bill (employees) 83896 2065801 6323416 0 1.93x10⁸
Wage bill (service providers) 83896 221225.4 841931.4 0 3.07x10⁷
Job creation 76794 14.1 98.4 0 5585
Job destruction 83936 10.9 89.6 0 6898
Hirings 83896 60.1 356.3 0 25609
Separations 83896 62.2 361.6 0 16273
Firm entry 82556 2.3 8.7 0 355
Workers (New firms) 82556 3.7 31.6 0 4936
Firm exit 83936 2.5 10.5 0 693
Workers (Exiting firms) 83936 5.1 39.0 0 4877
Month 83896 6.5 3.4 1 12
Year 83896 2009.0 1.4 2007 2011
Four months post extension 83936 .0318 .1757 0 1
Notes: ‘Formal employees’ denotes the number of formal workers employed across five-digit sectors over the 2007-2011 monthly period. ’Service providers’ corresponds to the number of individuals that provide services to firms across the different sector-month observations (outside the scope of a formal labour contract). The two ‘Wage bill’ variables denote the total pay of workers or service providers in nominal euros. ’Hirings’ and ‘Separations’ are the number of new social security identifiers reported by firms in each month compared to the previous month or that are not reported in the following month, respectively. ‘Month’ and ‘Year’ indicate the relevant cell date. ‘Four months post extension’ is a dummy variable equal to one over the four months immediately after an extension is issued in the respective five-digit sector.
Table 3: Main results - Employment and Wages
(1) (2) (3) (4)
Employees Hirings Separations ServiceProviders
Four months -.020 -.041 -.014 .014
post ext. (.004)∗∗∗ (.013)∗∗∗ (.012) (.003)∗∗∗
Obs. 83358 60179 62457 67911
R2 .988 .887 .907 .983
Wagebill WagebillSP TotalWagebill AvgWage
Four months -.022 .011 -.020 -.002
post ext. (.005)∗∗∗ (.005)∗∗ (.005)∗∗∗ (.003)
Obs. 83358 67911 83896 83358
R2 .984 .975 .984 .875
Notes: Each coefficient reported is obtained from a separate regression based on the dependent variable in-dicated at the heading of each one of the eight groups of statistics. ‘Employees’ indicates the total number of employees per sector-month. ‘ServiceProviders’ corresponds to the number of individual service providers working for each firm in each sector. ‘WageBill’ (‘WageBillSP’) corresponds to the total nominal pay of employ-ees (service providers) in each sector. ‘TotalWagebill’ corresponds to the sum of ‘WageBill’ and ‘WageBillSP’. ‘AvgWage’ corresponds to the average wage per employee (i.e. the ratio between ‘WageBillEe’ and ‘Workers’). All dependent variables are measured in logs. All specifications include (over 1,400) five-digit-sector fixed effects and (540) month/year/one-digit-industry fixed effects. Robust standard errors. Significance levels: *: 0.10; **: 0.05; ***: 0.01.
Table 4: Time profile effects
(1) (2) (3) (4) (5)
Employees Hirings Separations Wagebill WagebillSP
m(-3) -.006 -.004 -.019 -.017 .031 (.008) (.022) (.020) (.013) (.009)∗∗∗ m(-2) -.007 -.038 -.028 -.010 .033 (.008) (.023)∗ (.021) (.010) (.010)∗∗∗ m(-1) -.009 -.041 .021 .003 .029 (.007) (.024)∗ (.021) (.010) (.009)∗∗∗ m(0) -.014 -.095 .013 -.014 .030 (.007)∗ (.025)∗∗∗ (.023) (.009) (.009)∗∗∗ m(1) -.017 -.069 -.009 -.027 .020 (.007)∗∗ (.026)∗∗∗ (.021) (.009)∗∗∗ (.008)∗∗ m(2) -.018 -.026 -.018 -.012 .010 (.007)∗∗∗ (.024) (.021) (.009) (.008) m(3) -.020 -.043 -.002 -.027 -.001 (.007)∗∗∗ (.024)∗ (.021) (.009)∗∗∗ (.009) m(4) -.023 -.046 -.030 -.017 .021 (.007)∗∗∗ (.024)∗ (.021) (.009)∗ (.008)∗∗ m(5) -.014 .020 -.012 -.024 .004 (.007)∗∗ (.025) (.022) (.008)∗∗∗ (.009) Obs. 83358 60179 62457 83358 67911 R2 .988 .887 .907 .984 .975
Notes: The coefficients reported in each column are obtained from separate regressions based on the dependent variable indicated at the heading of the column. ‘m(t)’ refers to ‘t’ months after the extension is issued (e.g. m(0) refers to the month when the extension is issued and m(-1) to the month before the extension is issued). Dependent variables are measured in logs. All specifications include (over 1,400) five-digit-sector fixed effects and (540) month-year-one-digit-industry fixed effects. See notes to Table 3 for more information. Robust standard errors. Significance levels: *: 0.10; **: 0.05; ***: 0.01.