INTRODUCTION
Fishing has dramatic direct and indirect impacts on both coastal and open-sea marine ecosystems. Its imprint is identifiable at different time scales and lev-els of biological organisation (i.e. populations, commu-nities and ecosystems) (Jackson et al. 2001, Pauly et al.
2002, Stergiou 2002, Christensen et al. 2003, Myers & Worm 2003, Lotze & Milewski 2004). Present-day marine ecosystems are impoverished versions of their pristine counterparts in terms of both species diversity and biomass (e.g. Jackson et al. 2001, Baum et al. 2003, Christensen et al. 2003, Myers & Worm 2003, Lotze & Milewski 2004), and are thus altered with respect to
© Inter-Research 2007 · www.int-res.com *Email: [email protected]
Trophic signatures of small-scale fishing gears:
implications for conservation and management
Konstantinos I. Stergiou
1, 2,*, Dimitrios K. Moutopoulos
1, 3, Hernando J. A. Casal
4,
Karim Erzini
21Aristotle University of Thessaloniki, School of Biology, Department of Zoology, Box 134, Thessaloniki 54124, Greece 2CCMAR, Universidade do Algarve, 8005-139 Faro, Portugal
3University of Patras, Department of Biology, Section of Animal Biology, Rio-Patras 265 00, Greece 4Facultad de Ciencias del Mar, Departamento de Biologia, Grupo Dinamica de Poblaciones de Peces,
Universidad de Cádiz, Avda. Republica Saharahui s/n, 11510 Puerto Real, Cádiz, Spain
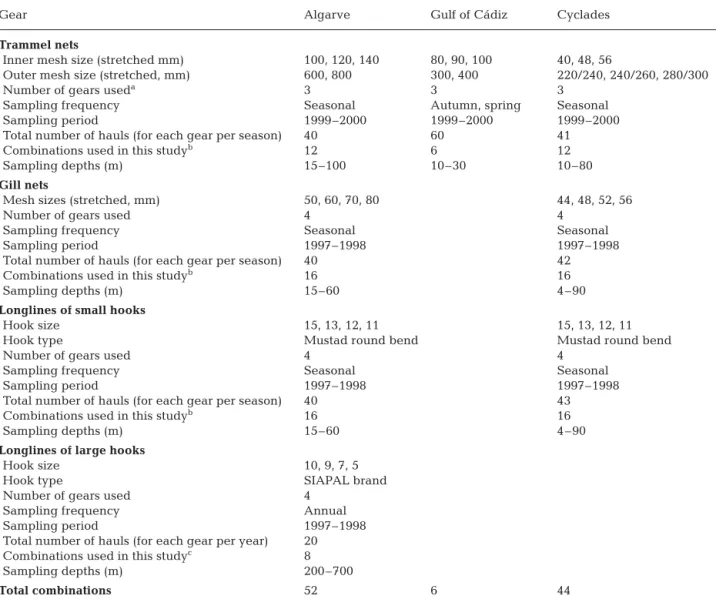
ABSTRACT: We quantified the ecosystem effects of small-scale gears operating in southern Euro-pean waters (Portugal, Spain, Greece), based on a widely accepted ecosystem measure and indica-tor, the trophic level (TL). We used data from experimental fishing trials during 1997 to 2000. We studied a wide range of gear types and sizes: (1) gill nets of 8 mesh sizes, ranging from 44 to 80 mm; (2) trammel nets of 9 inner panel mesh sizes, ranging from 40 to 140 mm; and (3) longlines of 8 hook sizes, ranging from Nos. 15 (small) to 5 (large). We used the number of species caught per TL class for constructing trophic signatures (i.e. cumulative TL distributions), and estimated the TL at 25, 50 and 75% cumulative frequency (TL25, TL50,TL75) and the slopes using the logistic function. We also
esti-mated the mean weighted TL of the catches (TLW). Our analyses showed that the TL characteristics
of longlines varied much more than those of gill and trammel nets. The longlines of large hooks (Nos. 10, 9, 7, 5) were very TL selective, and their trophic signatures had very steep slopes, the highest mean TL50values, very narrow mean TL25to TL75ranges and mean TLW> 4. In addition, the mean
number of TL classes exploited was smaller and the mean TL50and TLWwere larger for the longlines
of small hooks (Nos. 15, 13, 12, 11) in Greek than in Portuguese waters. Trammel and gill nets caught more TL classes, and the mean slopes of their trophic signatures were significantly smaller than those of longlines as a group. In addition, the mean number of TL classes exploited, the mean TL50and the
TLWof gill nets were significantly smaller than those of trammel nets. We attribute the differences
between longlines of small hooks to bait type, and the differences between all gear types to their characteristic species and size-selectivity patterns. Finally, we showed how the slope and the TL50of
the trophic signatures can be used to characterise different gears along the ecologically ‘unsustain-able–sustainable’ continuum.
KEY WORDS: Trophic level · Trophic signatures · Gill nets · Trammel nets · Longlines · Indicators · Northeast Atlantic Ocean · Mediterranean Sea
Resale or republication not permitted without written consent of the publisher
O
PEN
PEN
between- and within-species interactions (see e.g. Pauly et al. 1998, Steele & Schumacher 2000, Pauly & MacLean 2003). Although the detrimental effects of fishing became apparent as early as the 1900s, global, multi-level effects have attracted strong attention only recently (e.g. Pauly & Christensen 1995, Pauly et al. 1998, Jackson et al. 2001, Baum et al. 2003, Chris-tensen et al. 2003, Myers & Worm 2003, Pauly & MacLean 2003; reviews by Botsford et al. 1997, Jen-nings & Kaiser 1998, Hall 1999, Pauly et al. 2002, 2003). The results of these studies alarmed scientists, inter-national organisations, non-governmental organisa-tions and the public at large, and raised the issue of placing fisheries resource management within an ‘ecosystem’ context (e.g. Browman & Stergiou 2004). This led researchers to start exploring the use of a plethora of indicators in capturing/expressing fishing-induced effects at the community or ecosystem level. Among the various measures (e.g. Caddy & Garibaldi 2000, Pinnegar et al. 2002, Nicholson & Jennings 2004), those based on the fractional trophic level (TL), which expresses the position of an organism in the food web (Froese & Pauly 2000), enjoy wide accep-tance (i.e. one measure, the mean trophic index, has been selected by the Conference of the Parties to the Convention of Biological Diversity as 1 of 8 biodiversity indicators: see Pauly & Watson 2005).
The strength of TL as an ecological indicator lies in its efficiency in capturing and revealing ecosystem effects of fishing, either: (1) directly, in the form of the mean weighted TL of the catch for a series of years, useful for identifying the ‘fishing down the marine food webs’ process, which was described for the first time by Pauly et al. (1998, 2001) and later applied by others (e.g. Vas-concelos & Gasalla 2001, Pinnegar et al. 2002, 2003, Nicholson & Jennings 2004), or (2) indirectly, for esti-mating other indicators such as the primary production required to support fisheries (Pauly & Christensen 1995; and applications in CIESM 2000, Vasconcelos & Gasalla 2001) and the ‘Fishery in Balance’ index (Pauly et al. 2000a). In addition, recently, McClanahan & Mangi (2004) have also used the mean weighted TL of the catches of different small-scale gears as a simple in-dex for the management of Kenyan small-scale fish-eries. The TL concept also opened up new topics for marine ecological research, such as: (1) the comparison of different ecosystems based on the TL frequency dis-tribution of the relevant species (known as trophic sig-natures: Froese et al. 2005) and (2) the relationship be-tween TL and other biological variables, notably size (between species: Froese & Pauly 2000; ontogenetic changes: Pauly et al. 2001, Stergiou & Karpouzi 2002) and mouth area (Karpouzi & Stergiou 2003).
Fishing is practised with a variety of gears, many of which exploit the same stocks or different parts of the
same stock (e.g. Stergiou et al. 2004). Gear selectivity, both in terms of body sizes and species, differs with gear type, with gears typically ranging from unselec-tive to highly selecunselec-tive. For example, trawls, purse seines and beach seines are relatively unselective in terms of species and sizes, characterised by logistic type size selectivity (Millar & Fryer 1999). On the other hand, gill nets are more size selective, largely showing unimodal size selectivity (Millar & Fryer 1999, Erzini et al. 2003). Compared to gill nets, trammel nets and longlines are generally less size selective, having mul-tiple size-selectivity types (Erzini et al. 1996, 2003, Anonymous 2001, Stergiou & Erzini 2002). In addition, modern fishing vessels and technology nowadays allow fishers access to practically all fish habitats, which often differ in terms of the TL ranges of the inhabiting fishes (Stergiou & Karpouzi 2002). Thus, an important question is whether the number of species caught per TL class as well as the mean weighted TL of the catches differ with gear type, which would imply that the gears’ effects on the ecosystem differ accordingly.
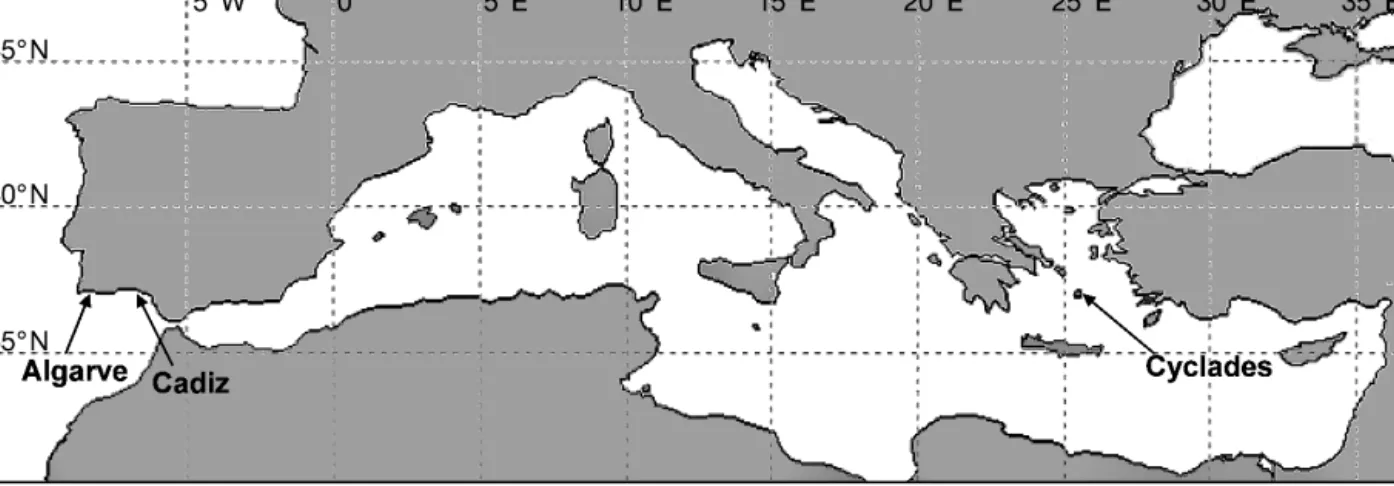
In this report, we quantified the trophic impacts of small-scale fishing gears in southern European waters, which historically support very important small-scale fisheries (OCEANA 2004), using data from experimen-tal fishing trials conducted during 1997 to 2000. To that end, we compared the cumulative TL frequencies (henceforth called trophic signature, based on Froese et al. 2005) as well as the mean weighted TL of the catches of a variety of small-scale fishing gears (i.e. trammel nets of 9 inner mesh sizes, gill nets of 8 mesh sizes and longlines of 8 hook sizes) in the Northeast Atlantic Ocean (Portugal: Algarve waters; Spain: Gulf of Cádiz) and the eastern Mediterranean Sea (Greece, Cyclades) (Fig. 1). In particular, we tested whether (1) the trophic signatures of small-scale gears differ with gear type, gear size and area, and (2) the mean weighted TL of the catch differs with gear type, gear size and area. Consequently, we propose how the sta-tistical properties of the trophic signatures, notably the slope and the TL at 50% cumulative frequency, can be used as an indicator of the gear-specific effects at the ecosystem level and, thus, as a tool for the conservation and management of fisheries resources.
MATERIALS AND METHODS
Sampling. Experimental fishing trials with gill and trammel nets of different mesh sizes and with longlines of different hook sizes took place in the Algarve, the Gulf of Cádiz and the Cyclades (Fig. 1), at different depth ranges during 1997 to 2000 (Table 1). All gears were set on the bottom, targeting demersal species. In
all areas, sampling was conducted using commercial boats, and fishing operations were carried out by pro-fessional fishers who fished on traditional fishing grounds following their normal operating practices. Erzini et al. (1999, 2001, 2003), Anonymous (2001), Stergiou et al. (2002) and Stergiou & Erzini (2002) pro-vide a thorough description of the fishing gears used and of the sampling schemes adopted in each region. To separate the catches and record the necessary data, 1 to 3 researchers were onboard. Weight per species was not recorded in the case of longlines of large hooks (Nos. 5 to 10, where hook No. 1 is the largest possible and hook No. 15 is among the smallest ones in com-mercial fisheries).
Classification by trophic level. Overall, 178 taxa were caught, of which 175 were identified to the spe-cies level (1 echinoderm, 7 crustacean, 6 cephalopod and 161 fish species) and 3 to genus, or higher level (fishes: Gobiidae, Labrus and Raja). For 65 of the 161
fish species we extracted TL values from Stergiou & Karpouzi (2002), who collected all published informa-tion on the feeding habits and estimated TL for 332 Mediterranean fish stocks, belonging to 146 species. For 84 fish species, we extracted TL values from Fish-Base online (www.fishbase.org), which provides TL estimates from food items and diet compositions (together with full documentation on TL estimation) for a large number of fish species. For the remaining 12 fish species, no TL estimate was available in FishBase. However, TL is rather phylogenetically constrained, being a function of species’ body length (Froese & Pauly 2000) and mouth area (Karpouzi & Stergiou 2003), with families often having distinct TL ranges (Stergiou & Karpouzi 2002). Thus, for these 12 species we searched FishBase for TL values of other species belonging to the same genus (using the FishBase valid genus of the species). We found TL for 8 species (i.e.
Ariosoma balearicum, Microchirus azevia, Microchirus ocellatus, Peristedion cataphractum, Raya brachy-urops, Stephanolepis diaspros, Synaptura lusitanica, Trachinus radiatus). For these 8 species, we used the
mean TL value of all species per genus (with the num-ber of species/genus ranging from 1 to 18 species). For the 4 fish species (i.e. Symphodus bailloni, Monochirus hispidus, Ophisurus serpens and Synapturichtys kleinii) for which no TL estimate was available for any
other species of the genus, we used TL estimates from the ‘Tools/Ecopath data’ option of FishBase. Finally, for the 3 fish taxa identified to genus or higher level, we used the mean TL of all species of the genus in FishBase for Raja and Labrus and TL = 3.5 for Gobiidae
(the default value used in TrophLab, a software used for the estimation of TL from diet data, down-loadable from www.fishbase.org; Pauly et al. 2000b). The TL values of cephalopods and crustaceans were extracted from the Sea Around Us database (http://seaaroundus.org/catchrate/map/trophic_levels. htm), whereas for the 1 echinoderm taxon we used TL = 2.4 (the default TrophLab value).
Trophic signatures.Subsequently, we estimated the number of species per TL class (30 classes, TL range from 2 to 4.9, Step 0.1) for the 102 gear/size/ season/area combinations and for the 29 gear/size/ area combinations (i.e. all seasons combined per gear/size/area). We note that in the case of the large hooks in the Algarve, data refer to years (1997, 1998), not seasons. From the number of species per TL class we constructed cumulative TL frequency distributions (i.e. trophic signatures) for each case. Based on the characteristics identified from these 2 sets of trophic signatures, we also constructed ‘general’ trophic sig-natures for each gear (gill and trammel nets: all sizes/seasons/areas combined; longlines: all seasons combined by large and small hook sizes and area). Fig. 1. Study areas (extracted from http://oas.ngdc.noaa.gov/mgg/plsql/extractor.mapit)
For comparative purposes we also extracted from Fish-Base (www.fishbase.org.ph; using the option: ‘Informa-tion by Country/Ecosystem/Island/Ecopath models’) all fish species for which TL is available in Portuguese waters (used as representative of the Algarve and Cádiz areas) and in Greek waters, henceforth called ‘eco-systems’. Overall, TL was available for 482 and 337 species, respectively, out of a total of 484 and 339 marine species reported by FishBase for these 2 countries.
We compared the trophic signatures of the gears with each other and with those of the ecosystems. We constructed trophic signatures first, including all taxa caught and then including only fishes. We tested for differences in the TL frequency distributions only for
the general trophic signatures, using the Kolmogorov-Smirnov test (KS).
Because cumulative TL frequency curves are of a logistic type, we described the relationship between the cumulative frequency (CF) of a TL class and TL using the logistic function:
CF = 1/(1 + e(–b(TL – TL50))
where b is the slope of the curve and TL50 is the TL
corresponding to the 50% cumulative frequency. Fits were obtained using non-linear, least-squares regression (SAS 1988). We also estimated the cumula-tive TL range corresponding to 25 and 75%, TL25and
TL75, of the cumulative frequencies:
Gear Algarve Gulf of Cádiz Cyclades
Trammel nets
Inner mesh size (stretched mm) 100, 120, 140 80, 90, 100 40, 48, 56
Outer mesh size (stretched, mm) 600, 800 300, 400 220/240, 240/260, 280/300
Number of gears useda 3 3 3
Sampling frequency Seasonal Autumn, spring Seasonal
Sampling period 1999–2000 1999–2000 1999–2000
Total number of hauls (for each gear per season) 40 60 41
Combinations used in this studyb 12 6 12
Sampling depths (m) 15–100 10–30 10–80
Gill nets
Mesh sizes (stretched, mm) 50, 60, 70, 80 44, 48, 52, 56
Number of gears used 4 4
Sampling frequency Seasonal Seasonal
Sampling period 1997–1998 1997–1998
Total number of hauls (for each gear per season) 40 42
Combinations used in this studyb 16 16
Sampling depths (m) 15–60 4–90
Longlines of small hooks
Hook size 15, 13, 12, 11 15, 13, 12, 11
Hook type Mustad round bend Mustad round bend
Number of gears used 4 4
Sampling frequency Seasonal Seasonal
Sampling period 1997–1998 1997–1998
Total number of hauls (for each gear per season) 40 43
Combinations used in this studyb 16 16
Sampling depths (m) 15–60 4–90
Longlines of large hooks
Hook size 10, 9, 7, 5
Hook type SIAPAL brand
Number of gears used 4
Sampling frequency Annual
Sampling period 1997–1998
Total number of hauls (for each gear per year) 20 Combinations used in this studyc 8
Sampling depths (m) 200–700
Total combinations 52 6 44
aThe different (inner × outer) mesh size combinations were combined based on inner mesh size because outer mesh size did not affect significantly species catch rates and size selectivity (Anonymous 2001)
b(sampling frequency) × (number of gears used); all trials for each gear per season were combined c(sampling frequency) × (number of gears used) × (2 yr); all trials for each gear per year were combined
TL25= (S1– ln3)/S2
and
TL75= (ln3 + S1)/S2
where S2equals b and S1equals b(TL50).
Mean weighted trophic level.We also estimated the mean TL of the catches by gear size, season (year in the case of the longlines of large hooks) and area weighted (TLw) by the weight of each species
par-ticipating in the catches. In the absence of weight measurements for longlines with large hooks, weighting was based on the numbers of each species caught, a fact that does not greatly affect the results given that the vast majority of specimens caught were of relatively large size.
We compared the mean TLw of the
catches across gears and areas using a
t-test or 1-way ANOVA and Fisher’s
least significance difference test. We explored the relationships between gear size and TLw using regression
analysis.
RESULTS
Trophic signatures
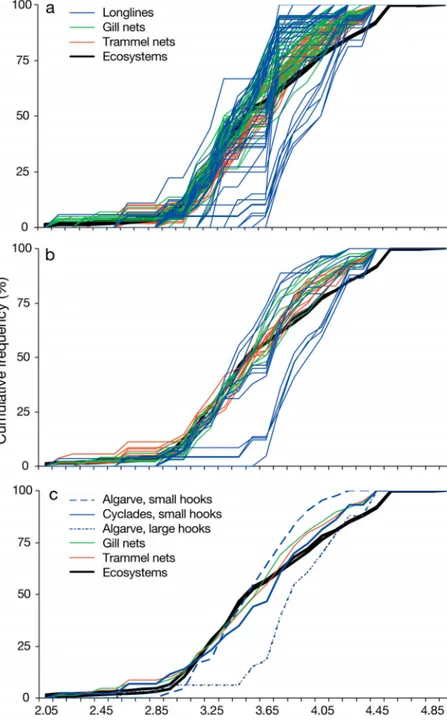
The seasonal trophic signatures of all trammel and gill net combinations were bounded in a narrower band when compared to those of longlines (Fig. 2a). They were evenly dispersed around those signatures representing the ecosystems for cumulative frequen-cies < 50 to 60%, and to the left of those of the ecosystems at frequencies > 50 to 60% (Fig. 2a). The trophic signatures of gill nets were shifted more to the left than those of the trammel nets (Fig. 2a). In contrast, the trophic signatures of the longlines were distributed in a very wide band around the ecosystem sig-natures (Fig. 2a). This was because of the different positions of the Algarve and Cyclades longlines of small hooks (Nos. 15 to 11; to the left and to the right of the ecosystem signatures, respectively), and of the Algarve long-lines of large hooks (Nos. 10 to 5; fur-ther to the right of those from the Cyclades).
The same pattern emerged when seasonal (Fig. 2b) and size/area (Fig. 2c) effects were removed. In the last case (Fig. 2c), however, the difference between gill and trammel nets was largely smoothed out. Indeed, the trophic signature of all trammel nets combined (Fig. 2c) did not differ significantly (KS, p > 0.05) from that of gill nets. In contrast, the trophic signatures of the longlines were again distributed in a wide band, with those of small and large hooks in Algarve waters
Fig. 2. Cumulative trophic level–frequency distributions of: (a) 102 different gear/size/season/area combinations; (b) 29 different gear/size/area combina-tions; and (c) trammel nets, gill nets and longlines see ‘Materials and methods’
were shifted to the far left and to the far right of the ecosystem signatures; those of small hooks in the Cyclades were between those of the Algarve (Fig. 2b,c). The TL frequency distributions of the long-lines of small and large hooks in the Algarve and Cyclades (Fig. 2c) differed significantly (KS, p < 0.05) from each other, as well as from those of the trammel and gill nets. Finally, the TL frequency distributions of all gears (Fig. 2c) differed significantly (KS, p < 0.05) from those of the 2 ecosystems, whereas the latter did not differ from each other (KS, p > 0.05). The same pat-tern emerged when we considered only fish species in the analysis (graphs not shown).
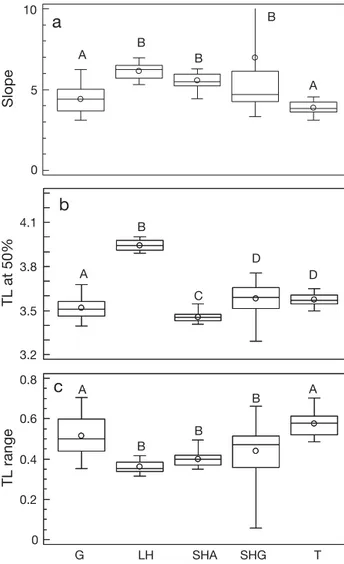
The mean number of TL classes exploited per gear differed significantly (ANOVA, p < 0.05) between gears, being highest for trammel nets and lowest for longlines of large hooks in the Algarve and of small hooks in the Cyclades (Fig. 3). All gears exploited fewer TL classes than exist in the 2 ecosystems (n = 26). The results of the application of the logistic curve to the trophic signatures of the 102 gear/size/area combinations showed that longlines as a group were characterised by the highest variation in slope, TL50
and TL25 to TL75 range (Fig. 4). The mean slope,
TL50 and TL25 to TL75 range all differed significantly
(ANOVA, p < 0.05) with gear (Fig. 4). The mean slope was highest for all longlines and smallest for gill and trammel nets (Fig. 4a). The mean TL50 was
smallest for the longlines of small hooks in the Algarve and highest for the longlines of large hooks (Fig. 4b). Finally, the mean TL25 to TL75 range was
narrower for all longlines than for gill and trammel nets (Fig. 4c).
Mean weighted trophic level
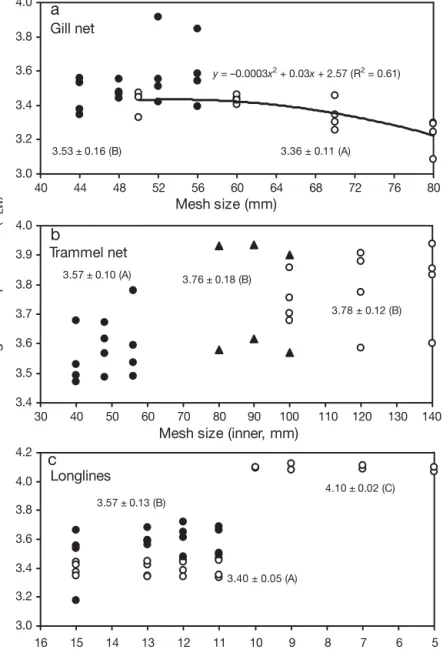
The TLWper gear size and season ranged between
3.09 and 3.92 for gill nets (Fig. 5a), 3.47 and 3.94 for trammel nets (Fig. 5b) and 3.18 and 4.12 for longlines (small hooks, Algarve: 3.33 to 3.45; small hooks, Cyclades: 3.18 to 3.72; large hooks: 4.07 to 4.12) (Fig. 5c). The mean TLW of gill nets (Fig. 5a) and
longlines of small hooks (Fig. 5c) both differed signif-icantly (t-test, p < 0.05) between Algarve and
Cyclades. The mean TLW of trammel nets also
dif-fered significantly (ANOVA, p < 0.05) with area (Fig. 5b). With the exception of the gill nets in Algarve waters (Fig. 5a), where TLW was a square
function of mesh size, no significant area-specific relationship was found between TLW and gear size
G LH SHA SHG T 0 3 6 9 12 15 18 Gear A B B D C Number of TL classes
Fig. 3. Box-whisker plots of the number of trophic level (TL) classes exploited by gill nets (G), longlines of small hooks in Algarve (SHA), longlines of small hooks in Cyclades (SHG), longlines of large hooks in Algarve (LH) and trammel nets (T) for the 102 cases shown in Fig. 2a. The central boxes cover 50% of the values, whereas vertical lines indicate the range, horizontal lines the median and circles the mean. For gears with same letter (A to D), their mean number of TL classes did not differ significantly (Fisher’s least
signifi-cance difference test)
Slope 0 5 10 TL at 50% 3.2 3.5 3.8 4.1 G LH SHA SHG T 0 0.2 0.4 0.6 0.8 TL range Gear
a
b
c
A B B B A A C B D D A B B B AFig. 4. Box-whisker plots of: (a) slope, (b) trophic level (TL) at 50% cumulative frequency and (c) mean TL25to TL50range of the 102 distributions shown in Fig. 2a. See Fig. 3 for definition of boxes and abbreviations. In (a) the range for SHG extends beyond the scale of the plot (up to 39); values log-transformed
for all gears (Fig. 5). However, for gill nets in the Cyclades (Fig. 5a) and trammel nets in the Algarve and Cyclades (Fig. 5b), the pattern indicated an increase in TLWwith gear size. In contrast, for
long-lines there was clearly no relationship between TLWand hook size (Fig. 5c).
Finally, the mean TLW also differed significantly
between gears (ANOVA, p < 0.05), being highest for longlines of large hooks and lowest for gill nets and longlines of small hooks in the Algarve (Fig. 6).
DISCUSSION
Small-scale fisheries, which account for about half of the fisheries biomass directly consumed by humans (FAO 2004), are more important, both economically and socially, than industrial and large-scale fisheries (Pauly & MacLean 2003). Thus, for instance, small-scale fisheries in Greek waters account for > 90% of the total number of fishing boats, > 65% of the total num-ber of fishers and > 50% of the total wholesale value of the Greek catch (Stergiou et al. 1997). Although industrial and large-scale fish-eries are generally favoured by our polit-ical systems, the redistribution of effort from industrial and large-scale to small-scale fisheries would have important benefits for the socio-economy of the fisheries sector and the ecosystems themselves (Pauly & MacLean 2003). In this light, the assessment of the impact of the 2 types of fisheries at the commu-nity and ecosystem levels is crucial.
In this study we quantified the eco-system effects of a large number of the most important small-scale gear sizes and types operating in southern European wa-ters. Our quantification was based on a widely accepted ecosystem measure and indicator, notably TL (see ‘Introduction’). The gears studied support very important fisheries in the 3 study areas (Erzini et al. 1996, 1999, 2003, Stergiou et al. 1997, 2002, Anonymous 2001, Stergiou & Erzini 2002) as well as in other southern European and Mediterranean countries (e.g. OCEANA 2004).
Differences among gears
Our analyses indicate that the different small-scale gears generally exploit fewer TL classes and in different proportions than those occurring in the ecosystem, and that the TL characteristics of longlines varied much more than those of gill and trammel nets. Our analysis also demon-strated that the trophic signatures of long-lines of large hooks (baited with sardine
Sardina pilchardus) differ from those of
the remaining gears. The longlines of large hooks exploited the fewest TL classes, at high TL, and at proportions much higher than those occurring in the ecosystems. Their catch was dominated
y = –0.0003x2 + 0.03x + 2.57 (R2 = 0.61) 3.0 3.2 3.4 3.6 3.8 4.0 40 44 48 52 56 60 64 68 72 76 80 Mesh size (mm) Me a n we ig h te d t ro p hi c le ve l (T LW ) 3.53 ± 0.16 (B) 3.36 ± 0.11 (A)
a
3.4 3.5 3.6 3.7 3.8 3.9 4.0 30 40 50 60 70 80 90 100 110 120 130 140Mesh size (inner, mm)
3.57 ± 0.10 (A) 3.76 ± 0.18 (B) 3.78 ± 0.12 (B)
b
3.0 3.2 3.4 3.6 3.8 4.0 4.2 5 6 7 8 9 10 11 12 13 14 15 16Hook size (no)
4.10 ± 0.02 (C) 3.40 ± 0.05 (A) 3.57 ± 0.13 (B)
c
Gill net Trammel net LonglinesFig. 5. Mean weighted trophic level (TLW) of the catches of different gears, gear sizes and areas (for the 102 cases shown in Fig. 2a): (a) gill nets, (b) trammel nets and (c) longlines (open circles: Algarve; filled triangles: Gulf of Cádiz; filled circles: Cyclades). The means of all records per area, together with their standard errors, are also shown. Means indicated by the same letter (in parentheses) did not differ significantly from each other (Fisher’s least
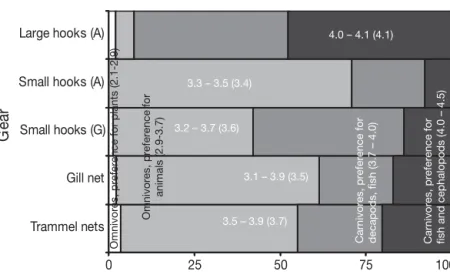
by carnivorous species, especially hake Merluccius mer-luccius and elasmobranchs (Erzini et al. 2001), with those
exhibiting preference for fish and cephalopod prey mak-ing up about 50% of the catch (Fig. 7). As a result, their TLWwas > 4. These features were efficiently captured by
the statistical properties of the trophic signatures. Thus, longlines of large hooks had very steep slopes, the high-est mean TL50 values and a very narrow TL25 to TL75
range, being positioned to the right of the trophic signatures of the remaining gears and of the ecosystems. Trophic signatures of longlines of small hooks dif-fered in the Algarve and Cyclades. Thus, although the mean slope and TL25to TL75range of the longlines of
small hooks in the Cyclades did not differ significantly from those in Algarve waters, the mean
number of trophic level classes ex-ploited was smaller and their mean TL50
and TLWvalues were larger than those
in the Algarve. We attribute this differ-ence to the different types of bait used in the 2 areas. In Algarve waters, the small hooks were baited with the worm
Sipuncula nudens and thus caught
more omnivores with preference for ani-mal prey than in the Cyclades (Fig. 7). In the latter area, small hooks were baited with squid, and thus their catch included carnivores with a preference for cepha-lopods and fishes in higher percentages than in the Algarve (Fig. 7). Indeed, spe-cies selectivity regarding hooks de-pends largely on bait type (Bjordal & Lokkeborg 1996).
Trammel nets differed from gill nets with respect to all measures used in this study. Gill nets caught a somewhat greater number of omnivores with pref-erence for animal prey, and fewer carni-vores than did trammel nets (Fig. 7).
Accordingly, the gill net TLWwas smaller than that of
trammel nets and was comparable to that of the long-lines of small hooks in the Algarve. In contrast, the mean TLWof trammel nets was the highest after that of
the longlines of large hooks (Fig. 7). We attribute this difference to the fact that trammel nets are in general much less selective in terms of both sizes and species than gill nets, exhibiting a wide range of selectivity types, from unimodal to multimodal and logistic (Anonymous 2001, K. Erzini unpubl. data). As a result, trammel nets catch a wider size range, both within-and between-species, within-and, thus, because TL generally increases with size (Froese & Pauly 2000), a wider range of TL classes than gill nets.
Given that the biomass of large-sized species, gener-ally positioned high in the food web (Froese & Pauly 2000), declines more rapidly than that of their small-sized counterparts (see discussion in Pauly et al. 2001), longlines of large hooks and small hooks baited with squid strongly contribute to ‘fishing down the marine food web’ by selectively removing high TL species. Catch and effort data from pelagic longlines of very large hooks from various areas of the world ocean show that biomass declines of large predatory fishes can be very rapid (i.e. as high as 80% in the first 15 yr: Baum et al. 2003, Myers & Worm 2003).
McClanahan & Mangi (2004) also compared the TLW
of different small-scale gears in Kenyan waters. They found that the hand-lines of small hooks, usually baited with worms, pieces of crab, squid, or octopus, have sig-3 3. 3. 4. A B D C A Mean TLw Gear G LH SHA SH G T 3 3.4 3.8 4.2 A B D C A
Fig. 6. Box-whisker plots of the mean TLW(mean weighted trophic level) of the catches. See Fig. 3 for definition of boxes
and abbreviations
0 25 50 75 100
Trammel nets Gill net Small hooks (G) Small hooks (A) Large hooks (A)
G
ear
Percentage
Omnivores, preference for
animals (2.9-3.7)
Carnivores, preference for decapods, fish (3.7 – 4.0) Carnivores, preference for fish and cephalopods (4.0 – 4.5)
Omnivores, preference for plants (2.1-2.9)
3.1 – 3.9 (3.5)
3.5 – 3.9 (3.7)
4.0 – 4.1 (4.1)
3.3 – 3.5 (3.4)
3.2 – 3.7 (3.6)
Fig. 7. Percentages of the different trophic functional groups (based on the species’ trophic levels) participating in the catches of gill nets, trammel nets, longlines of small hooks in the Algarve (A), longlines of small hooks in Cyclades (G) and longlines of large hooks in the Algarve. The number ranges correspond to the TLWranges shown in Fig. 5. The numbers in parentheses correspond to the mean TLW shown in Fig. 6. Trophic functional groups and their trophic level ranges, in parentheses, are from Stergiou & Karpouzi (2002), who esti-mated trophic levels from diet compositions for 332 Mediterranean fish stocks
nificantly higher TLW, 3.6, than gill nets of 60 mm,
beach seines, spears and big and small traps, all of which had TLWvalues of between 2.6 and 2.9. These
authors also claimed that hand-lines, by targeting the large-sized high-trophic-level species such as snap-pers, emperors and wrasses, contribute to ‘fishing down the marine food web’ in Kenyan waters. It is interesting to note that the TLWof the Kenyan hand-lines is
compa-rable to that of the longlines of small hooks in the Cy-clades.
With the exception of the Algarve gill nets, no signi-ficant relationship was found between gear size and TLW, although there was some evidence of an increase in
TLWwith mesh size for gill nets and, to a lesser extent, for
trammel nets. This might be the result of the fact that in the present study we did not account for ontogenetic changes in TL. Indeed many studies show that the TL of many species, especially those of omnivores with pre-erence for animal prey and carnivores, increases asymp-totically with size during their life (e.g. stomach contents: Stergiou & Karpouzi 2002; isotope analysis: Badalamenti et al. 2002). Thus, one would expect that TL will also increase with gear size. This is especially true for gill nets, for which larger mesh sizes generally catch larger specimens of the same species, and less so for trammel nets and longlines, where catch distributions for differ-ent mesh and hook sizes tend to overlap (Anonymous 2001, Stergiou & Erzini 2002, Erzini et al. 2003). The un-expected square relationship in the case of the Algarve gill nets might be the result of the exceptionally high catches of Scomber japonicus in the 80 mm gill nets
(35% of the total catch by weight; Erzini et al. 1999). Its TL of 3.1 is much lower than the TLs of the species that dominated the catches of the 50 and 60 mm gill nets (i.e.
Scorpaena notata, Mullus surmuletus and Diplodus bel-lottii: TLs between 3.4 and 3.6).
Ecosystem effects
Overall, the statistical properties of the trophic signa-tures, i.e. slope and TL50, captured the characteristics of
the different gears in terms of exploited TL classes and, thus, of their impact on the ecosystem. Therefore, the gear-specific TL50–slope combination of a trophic
sig-nature can be used as an indicator for managing fish-eries at the ecosystem level. In general, an indicator is useful when it is easily understood and estimated, and can be attached to both a reference point and an objec-tive (Gislason et al. 2000). Here, the objecobjec-tive is the trophic level balance of the ecosystem, and the refer-ence point is a specific set of TL50–slope values that can
be related to ‘ecologically sustainable fishing’. When complete knowledge exists of all metiers (i.e. combina-tions of specific gear, gear size, season and area
target-ing a species or group of species: sensu Ulrich et al. 2001) operating in an ecosystem, and of their catch spe-cies compositions, then categorising/selecting metiers in terms of ‘sustainable’ trophic signatures is an attain-able goal. We illustrate this in Fig. 8, in which TL50is
plotted against the slope for 3 hypothetical gears (shown as an inset) as well as for the 102 cases used in the present study. The 3 hypothetical gears include: (1) 1 gear exploiting only the very low TL classes (e.g. a bivalve dredge); (2) 1 gear exploiting only the highest TL classes, such as for instance the longlines of the largest hook sizes that catch large pelagics and sharks; and (3) 1 gear exploiting low and high TL classes at higher and lower percentages, respectively, than those in the ecosystem, having a trophic signature of moder-ate, almost linear slope (e.g. a rather unrealistic gear, roughly approximated by a purse seine catching mainly small- and medium-sized pelagic organisms, but also other demersal and bentho-pelagic species of high TL). In such a plot, the vertical and horizontal lines in-tersecting at the points defined by the TL50–slope
combination of the corresponding ecosystem define 4 areas of TL50–slope combinations (A to D: Fig. 8). No
TL50–slope combination is possible for Area D,
whereas gears with combinations falling in Area A are also very rare. Thus, the vast majority of gears will have trophic signatures with TL50–slope combinations
falling either in Area B or C, and their trophic charac-teristics (summarised in Fig. 8) will increase along the diagonals. We propose that fisheries based on gears with TL50–slope combinations positioned within the
shaded area in Fig. 8, i.e. around those of the ecosys-tem, lie towards the ecologically ‘sustainable’ end of the ‘unsustainable–sustainable’ continuum. This is be-cause these gears are less TL selective and generally remove low and high TL classes in percentages higher and lower, respectively, than those found in the ecosys-tem. Examples of such ‘sustainable’ gears are all tram-mel net combinations, as well as the hypothetical Gear 3 (Fig. 8), provided that they are not excessively used. In contrast, fisheries based on gears with TL50–slope
combinations falling outside this shaded area are to-wards the ecologically ‘unsustainable’ end, especially those based on gears positioned further away along the diagonals (Fig. 8). Examples of such gears are: (a) all longlines of large hooks and the hypothetical Gears 1 and 2 and (b) the Cyclades longlines of Hook 11 in win-ter, which largely caught species of TL values > 3.7, and of Hook 13 in spring, which largely caught species of 1 TL class, 3.7 to 3.8, corresponding to the uppermost and rightmost filled circles, respectively (Fig. 8). Gears falling outside the shaded area in B remove high TL classes at proportions much greater than those existing in the ecosystem, thus contributing to ‘fishing down the marine food web’. Fisheries based on these gears can
drive top-down cascade effects, which are common in marine ecosystems (e.g. coastal areas: Jackson et al. 2001; open oceans: Myers & Worm 2003; enclosed seas: Daskalov 2002), with important consequences for their structure and dynamics. In contrast, gears falling out-side the shaded area in C remove low TL classes at pro-portions much higher than those that exist in the ecosystem, a fact that might drive bottom-up cascading effects (see e.g. Cury et al. 2000). Thus, the use of both types of gears should be reduced.
Limitations
Our study, which is the first one to propose the use of trophic signatures in capturing the ecosystem effects of small-scale gears, suffers from limitations, which refer to both the data and the approach.
With respect to the data used, our study was based on TLs estimated from diet data. This method, as all methods used for estimating TL, suffers from certain disadvantages (for a discussion see CIESM 2000, Pol-unin & Pinnegar 2002). In addition, the TL of some spe-cies, such as those of the genera Liza and Mullus, are
difficult to determine (see e.g. Pinnegar et al. 2003). Thus, TL estimates are uncertain. Ideally, even in the
case of accurately estimated TLs, one should use area–year–length-specific TL per species rather than ‘global’ or ‘rounded’ ones in order to minimise uncer-tainty. At present, however, high-resolution TL data are not available for most marine animal species. We minimised the effect of data ‘accuracy’ by using either TL estimates from the Mediterranean (for 65 species: from Stergiou & Karpouzi 2002) or ‘average’ species-specific TLs (i.e. referring to the species in general: for 97 species) whenever possible. Thus, ‘rounded’ or ‘global’ TL values were used in only 16 of 178 taxa.
In our approach, ecosystem trophic signatures have a central role: they are used to define the 4 rectangles in Fig. 8. In the present study, we constructed ecosys-tem signatures using data only for fish because of the absence of similar ‘inventory’ data for other animal groups in the studied areas. This is another limitation; it will certainly be crucial to construct ecosystem signa-tures including other directly or indirectly exploited animals that have TL > 3 (e.g. cephalopods, other large invertebrates, marine mammals, turtles and sea birds: Froese et al. 2005, Kaschner et al. 2004). We think that this did not decisively affect the comparative nature of our results: (1) because of the very small number of non-fish taxa (14 out of 178 taxa) caught by the study gears and (2) because, in marine ecosystems, fish 2.0 3 C 3.4 3.7 4.0 0 5 10 Slope T L a t 50% Area B TL selection (high TLs) Narrow TL25-TL75 High TLW Shifted to the right Area A
No TL selection Wide TL25-TL75 Moderate TLW Crosses the ecosystem
Area C
TL selection (low TLs) Narrow TL25-TL75 Low TLW
Shifted to the left 2
1 40 Combinations not
possible in this area 3 2 1 3 4.5 3.3
A
B
C
D
Fig. 8. The relationship between trophic level at 50% cumulative frequency (TL50) and slope of the trophic signatures of 3 hypothetical gears (indicated by the 3 large filled squares, 1 to 3), shown as an inset in Area D, as well as for those analysed in the present study (102 cases) (filled rhombus: the 2 ecosystems [where the 2 lines intersect]; filled circles: longlines of small hooks; open circles: longlines of large hooks in Algarve; open triangles: trammel nets; open rhombus: gill nets). The main characteristics of gears with TL50–slope combinations positioned in different areas (A to C) are also shown. For explanation of the shaded
clearly predominate at TL > 3 (Froese et al. 2005). Indeed, trophic signatures were exactly the same after the exclusion of the non-fish taxa, one of which domi-nated catch species composition of the trammel nets (i.e. Sepia officinalis in the Algarve and the Gulf of
Cádiz: Anonymous 2001). Yet we preferred to include rather than exclude non-fish taxa, in order to capture the actual gear-specific trophic signatures.
Outlook
The above-mentioned limitations affect the practical applicability rather than the performance of the approach itself. The TL concept has attained a recog-nised importance (i.e. see ‘Introduction’). Thus, we believe that in the near future increased research effort will be devoted to obtaining reliable region- and length-specific TL estimates for most marine animals, either from diet or stable isotope data.
The trophic signature approach gives the same weight to both locally abundant species, for which good TL estimates are usually available, and to locally rare species, for which less accurate TL estimates are usually available. Many studies describing long-term temporal trends in the mean TL of landings (e.g. Pauly et al. 1998, 2001, Vasconcelos & Gasalla 2001, McClanahan & Mangi 2004) are also based on diet-estimated TLs. However, in such cases this is less of a problem, because the mean TL is biomass weighted. In the current study, the fact that the results of the TLW
analysis agreed with those of the non-weighted trophic signature approach (Fig. 7) is an indication that the lack of weighting might not be a real impediment.
Finally, the proposed shading in Fig. 8, which indicates the area of ‘sustainable’ TL50–slope
com-binations, is subjective. Yet a more objective de-lineation of the shape and dimension of this area is crit-ical for the definition of reference points. This, however, can be realised only after various issues or factors have been accounted for, such as: (1) full knowledge of all metiers and of the ecosystem in which these metiers operate; (2) application of this approach to fisheries at different maturity stages, since the latter affect the gear-specific, catch-species composition (McClanahan & Mangi 2004); and (3) application of this approach in other areas, covering a variety of depth ranges, habitats, fishing gears and gear sizes. Accounting for such issues will eventually allow the sustainable harvest from a particular ecosystem using several fishing gears, each targeting different TL classes (i.e. having different trophic signature). Natu-rally, this implies that TL harvest rates must match the ecosystem’s capacity to replenish the biomass removed from the impacted TL classes. Thus, further empirical
and theoretical studies are needed to define the extent of this reference area and the practical applicability of our approach to conservation and management of fish-eries resources.
Acknowledgements. This study was partially financed by 3
projects funded by the European Union (Contract Numbers 96/062, 96 /065, 98/04) and does not necessarily reflect the views of the Commission and in no way anticipates the Com-mission’s future policy in this area. This work was also funded in part by proyecto Voraz (C03-007-2003-11), IFAPA (Instituto Andaluz de Investigacion y Formacion Agroalimentaria y Pesquera, Junta de Andalucia). We thank 4 anonymous reviewers for their useful comments and suggestions.
LITERATURE CITED
Anonymous (2001) Trammel net selectivity studies in the Algarve (southern Portugal), Gulf of Cadiz (Spain), Basque Country (Spain) and Cyclades Islands (Greece). Final Report to the European Union (EU No. 98/014), Uni-versity of Algarve, UniUni-versity of Cadiz, Aristotle Univer-sity of Thessaloniki and Technological Institute of Food and Fisheries
Badalamenti F, D’Anna G, Pinnegar JK, Polunin NVC (2002) Size-related trophodynamic changes in three target fish species recovering from intense trawling. Mar Biol 141: 561–570
Baum JK, Myers RA, Kehler DG, Worm B, Harley SJ, Doherty PA (2003) Collapse and conservation of shark populations in the Northwest Atlantic. Science 299:389–392
Bjordal A, Lokkeborg S (1996) Longlining. Fishing News Books, London
Botsford LW, Castilla JC, Peterson CH (1997) The manage-ment of fisheries and marine ecosystems. Science 277: 509–515
Browman HI, Stergiou KI (eds) (2004) Perspectives on ecosys-tem-based approaches to the management of marine resources. Mar Ecol Prog Ser 274:269–303
Caddy JF, Garibaldi L (2000) Apparent changes in the trophic composition of world marine harvests: the perspective from the FAO capture database. Ocean Coast Manage 43: 615–655
Christensen V, Guénette S, Heymans JJ, Walters CJ, Watson R, Zeller D, Pauly D (2003) Hundred-year decline of North Atlantic predatory fishes. Fish Fish 4:1–24
CIESM (2000) Fishing down the Mediterranean food webs? CIESM Workshop Series 12, Monaco. Available at: www.ciesm.org/publications/Corfu.pdf
Cury P, Bakun A, Crawford RJM, Jarred A, Quinones RA, Shannon LJ, Verheye HM (2000) Small pelagics in upwelling systems: patterns of interaction and structural changes in ‘wasp-waist’ ecosystems. ICES J Mar Sci 57: 603–620
Daskalov G (2002) Overfishing drives a trophic cascade in the Black Sea. Mar Ecol Prog Ser 225:53–63
Erzini K, Gonçalves JMS, Bentes L, Lino PG, Cruz J (1996) Species and size selectivity in a multispecies Portuguese artisanal longline fishery. ICES J Mar Sci 53:811–819 Erzini K, Stergiou KI, Bentes L, Economides PS and 6 others
(1999) Comparative fixed gear selectivity studies in Portu-gal and Greece. Final Report to the European Union (EU No. 96/065), University of Algarve and Aristotle University of Thessaloniki
Erzini K, Gonçalves JMS, Bentes L, Lino PG, Ribeiro J (2001) The hake deepwater semi-pelagic (“pedra-bola”) longline fishery in the Algarve (southern Portugal). Fish Res 51: 327–336
Erzini K, Gonçalves JMS, Bentes L, Lino PG, Ribeiro J, Ster-giou KI (2003) Quantifying the roles of competing static gears: comparative selectivity of longlines and monofila-ment gill nets in a multi-species fishery of the Algarve (southern Portugal). Sci Mar 67:342–352
FAO (Food and Agricultural Organization) (2004) Report of the second session of the working party on small-scale fisheries. FAO Fish Rep 735:1–21
Froese R, Pauly D (eds) (2000) FishBase 2000: concepts, design and data sources. ICLARM (available at: www.fish-base.org), Los Baños, Laguna
Froese R, Garthe S, Piatkowski U, Pauly D (2005) Trophic sig-natures of marine organisms in the Mediterranean as com-pared with other ecosystems. Belg J Zool 135(Suppl 1): 139–143
Gislason H, Sinclair M, Sainsbury K, O’Boyle R (2000) Sympo-sium overview: incorporating ecosystem objectives within fisheries management. ICES J Mar Sci 57:468–475 Hall SJ (1999) The effects of fishing on marine ecosystems
and communities. Blackwell Science, Oxford
Jackson JBC, Kirby MX, Berger WH, Bjorndal KA and 15 oth-ers (2001) Historical overfishing and the recent collapse of coastal ecosystems. Science 293:629–638
Jennings S, Kaiser MJ (1998) The effects of fishing on marine ecosystems. Adv Mar Biol 34:201–352
Karpouzi VS, Stergiou KI (2003) Mouth shape and relationships between mouth size and body length for several marine fishes: trophic implications. J Fish Biol 62:1353–1365 Kaschner K, Stergiou KI, Weingartner G, Kumagai S (2004)
Trophic levels of marine mammals and overlap in re-source utilization between marine mammals and fisheries in the Mediterranean Sea. CIESM Workshop Monogr 23:51–58. Available at: www.ciesm.org/publications/ Venise04.pdf
Lotze HK, Milewski I (2004) Two centuries of multiple human impacts and successive changes in a North Atlantic food web. Ecol Appl 14:1428–1447
McClanahan TR, Mangi CS (2004) Gear-based management of a tropical artisanal fishery based on species selectivity and capture size. Fish Manage Ecol 11:51–60
Millar RB, Fryer RJ (1999) Estimating the size-selection curves of towed gears, traps, nets and hooks. Rev Fish Biol Fish 9:89–116
Myers RA, Worm B (2003) Rapid worldwide depletion of predatory fish communities. Nature 423:280–283 Nicholson MD, Jennings S (2004) Testing candidate
indica-tors to support ecosystem-based management: the power of monitoring surveys to detect temporal trends in fish community metrics. ICES J Mar Sci 61:35–42
OCEANA (2004) European trawlers are destroying the oceans. Available at: http://europe.oceana.org/down-loads/european_trawlers_destroying_oceans.pdf
Pauly D, Christensen V (1995) Primary production required to sustain global fisheries. Nature 374:255–257
Pauly D, MacLean J (2003) In a perfect ocean: the state of fish-eries and ecosystems in the North Atlantic Ocean. Island Press, Washington, DC
Pauly D, Watson R (2005) Background and interpretation of the ‘Marine Trophic Index’ as a measure of biodiversity. Philos Trans R Soc Lond B 360:415–423
Pauly D, Christensen V, Dalsgaard J, Froese R, Torres F (1998) Fishing down marine food webs. Science 279: 860–863
Pauly D, Christensen V, Walters C (2000a) Ecopath, Ecosim, and Ecospace as tools for evaluating ecosystem impacts on marine ecosystems. ICES J Mar Sci 57:697–706
Pauly D, Froese R, Sa-a PS, Palomares ML, Christensen V, Rius J (2000b) TrophLab manual. ICLARM, Manila Pauly D, Palomares MLD, Froese R, Sa-a P, Vakily M,
Preik-shot D, Wallace S (2001) Fishing down Canadian aquatic food webs. Can J Fish Aquat Sci 58:51–62
Pauly D, Christensen V, Guénette S, Pitcher TJ, Sumaila UR, Walters CJ, Watson R, Zeller D (2002) Towards sustain-ability in world fisheries. Nature 418:689–695
Pauly D, Alder J, Bennett E, Christensen V, Tyedmers P, Watson R (2003) The future for fisheries. Science 302: 1359–1361
Pinnegar JK, Jennings S, O’Brien CM, Polunin NVC (2002) Long-term changes in the trophic level of the Celtic Sea fish community and fish market price distribution. J Appl Ecol 39:377–390
Pinnegar JK, Polunin NVC, Badalamenti F (2003) Long term changes in the trophic level of western Mediterranean fishery and aquaculture landings. Can J Fish Aquat Sci 60: 222–235
Polunin NVC, Pinnegar JK (2002) Ecology of fishes in marine food-webs. In: Hart PJ, Reynolds JD (eds) Handbook of fish and fisheries. Blackwell, Oxford
SAS (1988) SAS/STAT* user’s guide, Release 6.03. SAS Insti-tute, Cary
Steele JH, Schumacher M (2000) Ecosystem structure before fishing. Fish Res 44:201–205
Stergiou KI (2002) Overfishing, tropicalization of fish stocks, uncertainty and ecosystem management: resharpening Ockham’s razor. Fish Res 55:1–9
Stergiou KI, Erzini K (2002) Comparative fixed gear studies in the Cyclades (Aegean Sea): size selectivity of small hook longlines and monofilament gill nets. Fish Res 58:25–40 Stergiou KI, Karpouzi VS (2002) Feeding habits and trophic
lev-els of Mediterranean fish. Rev Fish Biol Fish 11:217–254 Stergiou KI, Christou E, Georgopoulos D, Zenetos A,
Souverme-zoglou C (1997) The Hellenic seas: physics, chemistry, biol-ogy and fisheries. Oceanogr Mar Biol Annu Rev 35:415–538 Stergiou KI, Moutopoulos DK, Erzini K (2002) Gill net and longline fisheries in Cyclades (Aegean Sea): species com-position and gear competition. Fish Res 57:25–37 Stergiou KI, Moutopoulos DK, Krassas G (2004) Body size
overlap in industrial and artisanal fisheries for five com-mercial fish species in the Mediterranean Sea. Sci Mar 68: 179–188
Ulrich C, Gascuel D, Dunn MR, Le Gallic B, Dintheer C (2001) Estimation of technical interactions due to the competition for resource in a mixed-species fishery, and the typology of fleets and metiers in the English Channel. Aquat Living Resour 14:267–281
Vasconcelos M, Gasalla MA (2001) Fisheries catches and the carrying capacity of marine ecosystems in southern Brazil. Fish Res 50:279–295
Editorial responsibility: Kenneth Sherman (Contributing Editor), Narragansett, Rhode Island, USA
Submitted: January 28, 2005; Accepted: June 22, 2006 Proofs received from author(s): February 14, 2007