2813
FLOW-3D MODELLING OF THE DEBRIS EFFECT ON MAXIMUM SCOUR HOLE DEPTH
AT BRIDGE PIERS
INÊS SOFIA PEREIRA MENDONÇA(1), HUGO DANIEL LEITÃO CANILHO(2) & CRISTINA MARIA SENA
FAEL(3)
(1,2,3) Centre of Materials and Building Technologies (C-MADE), University of Beira Interior, Covilhã, Portugal,
[email protected]; [email protected]; [email protected]
ABSTRACT
Bridge foundations are frequently inserted in riverbeds constituted by alluvial material, being, therefore, subjected to scouring processes. Such phenomenon is aggravated during flood events due to the increase of water flow or due to the increase of the debris carried by the flow that can pile up along the bridge structural elements. The debris can partially obstruct bridge spans and accumulate near bridge piers and abutments, which will have consequences in terms of reduction of flow capacity and an increment of the maximum scour depth. The dimensions, shape and its location are characteristics that must be considered when predicting the scour depth. The present study aims at analyzing the effect of the debris on the maximum clear-water scour depth at cylindrical piers inserted in uniform sand, non-ripple forming sand, fully-developed turbulent flows in wide rectangular channel, using computational fluid dynamics software, Flow-3D. For this purpose, debris with a triangular and rectangular shape, floating and on the sand bed, were tested, using the k-ε RNG turbulence model and the numerical results were compared with those obtained experimentally. It was possible to verify that the floating debris gives greater scour hole depth and the debris on sand bed behave as scour countermeasure reducing the scour hole depth. Also, rectangular shaped debris seems to cause more scour near the structures than the triangular shaped ones, which also seemed beneficial to the scour hole, by reducing it. However, the results obtained computationally are significantly lower than those obtained experimentally. Keywords: debris, cylindrical pier, local scour, RANS, numerical modelling
1 INTRODUCTION
In the last decades the number of bridges founded on alluvial beds have been increasing. It is known that anytime an engineered structure is placed in a river environment, special attention must be paid to the hydraulic characteristics of the watercourse, constituting, sometimes, an element strongly conditioning the analysis of the solutions to be considered. By way of example, the hydraulic parameters to be consider are the riverbed and riverbank stability, the evolution of erosion and deposition of sediments, free surface elevation, etc. (Ramos, 2005).
Focusing on local scour that develops close to the bridge foundations (piers and abutments) because they are one of the most frequent causes of deterioration and bridge’ failure. Indeed, several accidents have been recorded around the world due to the fall of bridges resulting from scouring processes, with the main damages occurring during floods.
The appearance of scour hole in riverbed results from the presence of the obstacles and this phenomenon is aggravated during the floods occurrence, on one hand, due to the increase of the flow and, on the other, due to the increase of the debris. The floating debris, composed by tree trunks and logs, carried by natural stream during floods, and that accumulates near the structure can cause a great obstruction to the flow, amplifying the scouring processes and affecting the morphology of the scour hole as a result of the interaction between the flow and the roughness of the debris, that increases the shear stress and the turbulence, leading, in an accelerated way, to the bridge’ failure (Pagliara and Carnacina, 2010; Franzetti et al. 2011; Hemdan et al. 2016; Zevenbergen et al., 2007 and Rahimi et al., 2017).
The flow and the local scour that develops around cylindrical piers and their foundations have been a subject developed during the last four decades in order to characterize the erosive phenomenon and to quantify the maximum depth of the scour holes. Although much has been published on this subject based on laboratory work, the studies that have been presented involving three-dimensional numerical modeling are scarcer. Few works have been carried out although they offer important contributions to the numerical investigation of the local scour next to vertical piers, namely, Moussa et al. (2016), Li et al. (2013), Vasquez and Walsh (2009), Mehnifard et al. (2014), Ghasemi and Gerdefaramarzi, (2017) and Baykal et al. (2015). Regarding the numerical
2814
modeling on the influence of the debris on the scour depth, the available literature is restricted to the contribution of Moussa et al. (2016).
In this scope, the present work intends to analyze through Flow-3D software the maximum scour depth developed near the cylindrical pier, under clear-water flow conditions, when subjected to permeable debris with triangular and rectangular shapes, floating or at sand bed. In addition, the results obtained in the present study will be compared with the experimental results obtained by Dias (2018).
2 NUMERICAL MODELLING
Flow-3D is the computed fluids dynamic model in this research work. The software is capable of considering different boundary conditions of fluid and to solve the common interface of fluid with fluid and fluid with air. Proposed model is utilized in different applications of hydraulic engineering such as flow and local scour around structures. Flow-3D solves three-dimensional Navier-Stokes equations. The flow is described by the Reynolds Averaged Navier-Stokes, Eq. [1] and Eq. [2].
𝜕𝑢𝑖 𝜕𝑥𝑖 = 0 [1] 𝜕 𝜕𝑡(𝜌𝑢𝑖) + 𝜕 𝜕𝑥𝑗 (𝜌𝑢𝑖𝑢𝑗) = 𝜕𝑝 𝜕𝑥𝑖 + 𝜇 𝜕 2𝑢 𝑖 𝜕𝑥𝑗𝜕𝑥𝑖 − 𝜌𝑢𝑖′𝑢 𝑗′ [2]
where µ is the kinematic viscosity, ui is the ith component of the instantaneous velocity, p the instantaneous
effective pressure, ρ the fluid density and u’i is the velocity fluctuation in the ith direction. Eq. [1] and Eq. [2] are
very similar to the Navier-Stokes equations, with just the difference of the velocities and all the other variables being time averaged. By introducing the time average term into the Navier-Stokes equations new variables appear, namely the 𝜌𝑢𝑖′𝑢𝑗′ term. This term is known as the Reynolds stresses and needs modeling in order for the equations to be solved, using a turbulence model that, in the case of this study, was the k-Ԑ RNG turbulence model. In addition, the Volume of Fluid (VOF) method was used to ensure free surface definition.
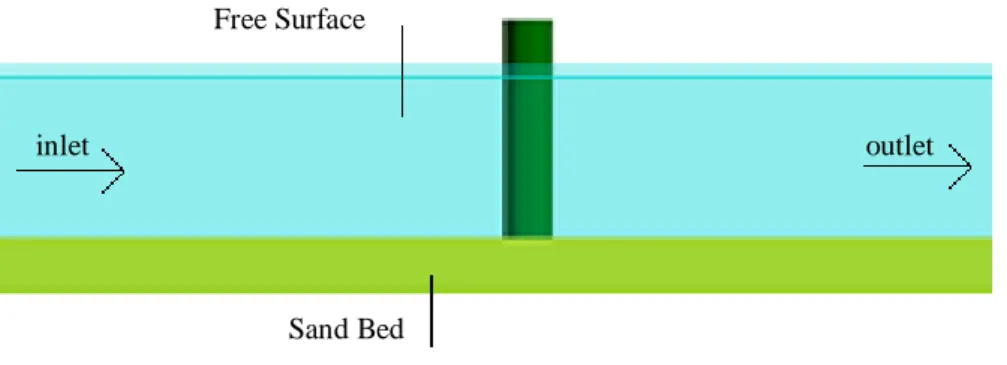
In the fluid domain, the boundary conditions were set according as following: in the upstream of the domain, a water inlet with a flow rate definition was set; the downstream section (outlet) of the domain was treated as an outflow boundary condition; the sides were set as walls; the bottom was set as wall as well, with a sediment bed on top of the boundary condition, so bed erosion could be evaluated; the top surface, using the VOF model, was treated as a free surface. A simple scheme of the fluid domain can be observed in Figure 1.
Figure 1. Scheme of the fluid domain.
As sediment scour is the main focus of the study, there are some variables that need explanation in order to understand how they are calculated by the software.
The bed shear stress is the shear stress applied by fluid on the packed bed surface. It is calculated using the wall function for 3D turbulence flows defined by Eq. [3].
𝑢 = 𝑢𝜏[ 1 𝜅𝑙𝑛 ( 𝑌 µ 𝑢𝜏+ 𝑘𝑠 )] [3]
where 𝑢𝜏 is the shear velocity, 𝑢𝜏= √𝜏/𝜌, 𝜏 is the bed shear stress, Y is the distance from the wall, 𝜅 = 0.4 is the Von Karman constant, ks is the Nikuradse roughness. In this model, ks is related to grain size as, 𝑘𝑠= 𝑐𝑠𝑑50, where 𝑑50 is the median grain diameter of the bed material, and cs is a user-definable coefficient. The recommended value of cs is 2.
The Shields parameter is a dimensionless form of bed shear stress defined by Eq. [4]. Free Surface
Sand Bed
2815 𝜃𝑛=
𝜏 𝑔 𝑑𝑛(𝜌𝑛− 𝜌)
[4]
where 𝑔 is gravity in absolute value, ρn is the mass density of sediment grains and dn is grain diameter. The
subscript n represents the nth sediment species.
The critical Shields parameter, θcr,n,is used to define the critical bed shear stress, cr,n, at which sediment
movement begins for both entrainment and bedload transport. The base value of θcr,n is for a flat and horizontal
bed of identically-sized grains. It can be either specified by users (0.05 by default) or determined from the Soulsby-Whitehouse equation, defined in Eq [5].
𝜃𝑐𝑟,𝑛= 0.3 1 + 1.2𝑑∗,𝑛
+ 0.55(1 − 𝑒−0.02𝑑∗,𝑛) [5]
where d*,n is the dimensionless grain size given by Eq. [6].
𝑑∗,𝑛= 𝑑𝑛[
𝑔(𝑠𝑛− 1)
µ ]
1/3 [6]
where sn=ρn/ρ.
In this model, entrainment and deposition are treated as two opposing micro-processes that take place at the same time. They are combined to determine the net rate of exchange between packed and suspended sediments. For entrainment, the velocity at which the grains leave the packed bed is the lifting velocity, 𝑢𝑙𝑖𝑓𝑡,𝑛, and is calculated based on Winterwerp et al. (1992) given by Eq. [7].
𝑢𝑙𝑖𝑓𝑡,𝑛= 𝑛𝑏𝛼𝑛𝑑∗,𝑛0.3(𝜃𝑛− 𝜃𝑐𝑟,𝑛) 1.5
√𝑔𝑑𝑛(𝑠𝑛− 1) [7]
where αn is the entrainment coefficient of species n (default value is 0.018), and nb is the outward normal vector
of the packed bed surface. In deposition, the settling velocity of Soulsby (1997), 𝑢𝑠𝑒𝑡𝑡𝑙𝑒,𝑛, given by Eq. [8], is used. 𝑢𝑠𝑒𝑡𝑡𝑙𝑒,𝑛= 𝒈 𝑔[(10.36 2+ 1.049𝑑 ∗,𝑛 3 )1/2− 10.36] µ 𝑑𝑛 [8]
where 𝒈 is the gravity acceleration and 𝒖settle,n is assumed in the same direction of 𝒈.
The dimensionless form of the bedload transport rate for species n is defined in Eq. [9]. Φ𝑛=
𝑞𝑏,𝑛 [𝑔(𝑠𝑛− 1)𝑑𝑛3]1/2
[9]
Where qb,n is the volumetric bedload transport rate per unit bed width (in units of volume per width per time). Φn
is calculated using the Meyer-Peter and Muller equation (1948), given in Eq. [10]. Φ𝑛= 𝐵𝑛(𝜃𝑛− 𝜃𝑐𝑟,𝑛)
1.5
𝑐𝑏,𝑛 [10]
where Bn is the bedload coefficient. It is generally 5.0 to 5.7 for low transport, around 8.0 for intermediate
transport, and up to 13.0 for very high transport. The default value used in FLOW-3D is 8.0, which is the most commonly used value in the literature. cb,n is the volume fraction of species n in the bed material.
Given these parameters, in the present study the simulation was set and took place for 14400 seconds (4 hours), corresponding to 3 days of simulation, and adopting a criterion already used by other authors, namely, Mohamed (2012). This time simulation will correspond to a 70% of the maximum scour depth.
3 VALIDATION OF THE COMPUTATIONAL MODEL
Before using the numerical model to analyze the influence of debris on the maximum scour depth at cylindrical piers, one simulation was carried out with the objective of calibrating the computational model and, so, validate the results obtained by the numerical simulation. For this, were modelled on the Flow-3D software the same conditions of the experimental work performed by Robalo (2014) on the influence of the permeability
2816
of vertical cylindrical elements on the flow behavior. This experimental work was carried out in the channel at the Fluvial Hydraulic and Structures Laboratory from University of Beira Interior. The channel (see Figure 2.a)) is of rectangular section, has 12.00 m long, 0.83 m width and 1.00 m high, concrete flume and the experimental tests consisted in the measurement of the two-dimensional components of instantaneous velocities, vertical and horizontal, with features to a 3D Laser Doppler Velocimetry (LDV) system, around an impermeable cylindrical element. This was placed in the center of a cross-section of the channel in which the flow was fully developed and three planes perpendicular to the flow direction were defined from the bottom of the channel to the free surface, located upstream, in the center and downstream of the cylindrical element as shown in Figure 2. b).
Figure 2. a) Flow along cylindrical structures; b) Three-dimensional scheme with the identification of cross-sections of the experimental tests (Robalo, 2014).
A comparative analysis was performed between the values of the mean velocity in the longitudinal direction of the flow, U, in the transverse section, where x = 9.0 m, y = 0.373 m, as can be seen in Figure 3. a), obtained by Robalo (2014) and those obtained in the modelling study, for the situation with a more refined mesh to serve as object of comparison with Figure 3 b).
From the analysis of Figure 3 b) it is possible to verify that the velocity profile obtained through the numerical simulation presents the same development of the velocity profile obtained experimentally. The profiles are practically coincident for values of z/h lower than 0.4, where z is the vertical position in the flow and h the flow depth. Above 0.4, the values obtained numerically are lightly lower than those obtained experimentally, the deviations present an average of 3.4% and a standard deviation of 2.3%, allowing to conclude that the numerical model is suitable.
Figure 3. Vertical distribution of the mean flow velocity longitudinal component: a) Rafael (2014); b) Comparison between Robalo (2014) and the Flow-3D.
4 NUMERICAL SIMULATION
These second phase aimed to analyze the accumulated debris effect on the upstream face of a cylindrical pier has in the maximum local scour. The Flow-3D code was used, and 5 simulations were performed: the first for an isolated pier, without the presence of debris, and the following with the presence of debris in its most common shape, rectangular prism (rectangular in planform and profile) and triangular prism (triangular in
0.0 0.1 0.2 0.3 0.4 0.5 0.6 0.7 0.8 0.9 1.0 0.2 0.3 0.4 0.5 0.6 0.7 U (m/s) Robalo (2014) Flow-3D a) Flow Y Z X h Impermeable pier Measuring sections b) b) Profile a)
2817 planform). As at Dias (2018), the first simulation, performed in the presence of an isolated cylindrical pier inserted on a moving bottom, will serve as a reference test in order to analyze the influence of the shape and position of the debris on the erosion cavities morphology.
The tests were carried out in a bed consisting of natural quartz sand of which the median diameter is D50
= 0.86 mm, the gradation coefficient is σD =1/2(D84.1/D50 + D50/D15.9) = 1.36 and density of 2666 kgm-3. The flow
is characterized by having a depth equal to 0.15 m and the average approach flow velocity of 0.317 ms-1,
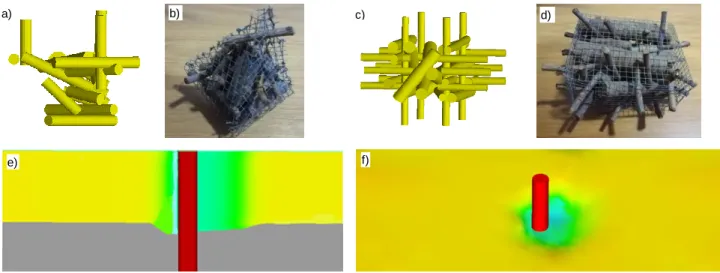
approximately equal to the average approach flow velocity for the threshold condition of sediment entrainment (U/Uc = 0.96). For this velocity, the scour depth can be expected to be maximal. The pier was simulated by a cylinder with 50 mm diameter and the debris was simulated by cylinders with a dimension of 0.025 m; 0.05 m; 0.075 m and 0.10 m and random diameters between 0.06 and 0.012 cm, forming boxes with 0.10 m width normal to the flow, 0.10 m of thickness and 0.05 m of the debris length upstream from pier face, as defined on Dias (2018). Figure 4 shows the simulated debris in Flow-3D and the debris used in the experimental work. More details on the experimental work can be found at Dias (2018) and Dias et al. (2019).
Figure 4. Debris shape: Triangular: a) Flow-3D and b) Experimental test; Rectangular: c) Flow-3D and d) Experimental test; e) side view of Flow-3D results; e) 3D view of Flow-3D results.
Figure 5 shows the time evolution of the scour depth for the 5 simulations performed on the Flow-3D software. These analysis allows to conclude that the time evolution scour depth presents higher values in the case of rectangular debris on the surface of the water, i.e., floating debris, and that the rectangular box on the surface has values higher than the triangular box on same conditions. Regarding the triangular box in the sand bed, it can see that it presents values much lower than the other simulations and may even be considered as countermeasure against local scour, a reduction of ≈ 40%.
Figure 5. Scour depth time evolution for all simulations.
0.00 0.01 0.02 0.03 0.04 0.05 0.06 0.07 0 1 2 3 4 ds(m) t(h) Pier - without debris
Triangular debris - surface Triangular debris - sand bed Retangular debris - surface Retangular debris - sabd bed
a) b) c) d)
2818
Then, the results obtained through Flow-3D are compared with those obtained in the experimentally work by Dias (2018). Figure 6 presents the time evolution of the scour depth, ds, for cylindrical pier, and the Figure 7 and Figure 8 presents the same variable for cylindrical pier with triangular and rectangular debris, on surface and at sand bed, respectively.
Figure 6. Scour depth time evolution at cylindrical pier.
Figure 7. Scour depth time evolution at cylindrical pier with triangular debris: a) on surface; b) at sand bed.
Figure 8. Scour depth time evolution at cylindrical pier with triangular debris: a) on surface; b) at sand bed.
The analysis of the figures shows, in global terms, that the Flow-3D software is not very representative in relation to laboratory work. On the one hand, in the simulation carried out for the validation of the model, using a fixed bed the software presented a very adequate behavior in terms of average velocity, as can be seen in
0.00 0.02 0.04 0.06 0.08 0.10 0 1 2 3 4 ds(m) t(h) Flow-3D Dias (2018) 0.00 0.02 0.04 0.06 0.08 0.10 0 1 2 3 4 ds(m) t(h) Flow-3D Dias (2018) 0.00 0.02 0.04 0.06 0.08 0.10 0 1 2 3 4 t(h) Flow-3D Dias (2018) 0.00 0.02 0.04 0.06 0.08 0.10 0 1 2 3 4 ds(m) t(h) Flow-3D Dias (2018) a) 0.00 0.02 0.04 0.06 0.08 0.10 0 1 2 3 t(h) 4 Flow-3D Dias (2018) b) a) b)
2819 Figure 3b), on the other hand, with the introduction of the movable bed, the results obtained in Flow-3D move away from the experimental results, presenting an average deviation of 30%. This discrepancy between results may be associated to the different ways of evaluating the threshold condition of sediment entrainment. The evaluation of this condition is extremely relevant as a response of the bed to the passage of the flow, namely, in studies that involve the evaluation of the local scour that develop together of structures as well as in the definition of countermeasures. The deviations associated with its evaluation may be one of the causes of dispersion between experimental results of several known studies. These deviations result from the subjectivity inherent in their evaluation. This aspect also extends to numerical analysis. At the experimental work, the average approach flow velocity for threshold condition of sediment entrainment, Uc, was evaluated as a mean between the equation suggested by Neil (1967) and Garde (1970), whereas in Flow-3D it was estimated by Shields (1936) method. The values obtained by the three methods are summarized in Table 1.
Table 1. Values of UC and respective flows evaluated.
Neil (1967) Garde (1970) Shields (1936)
UC (ms-1) 0.314 0.326 0.403
Q(ls-1) 39.1 40.6 50.1
As can be seen, Uc considered at the experimental work is 20% lower than that adopted by Flow-3D. Since the water flow considered in the simulation was that adopted at the experimental work, corresponding to 96% of Uc, when simulated in Flow-3D, it certainly leads to lower values corresponding to the same order of magnitude.
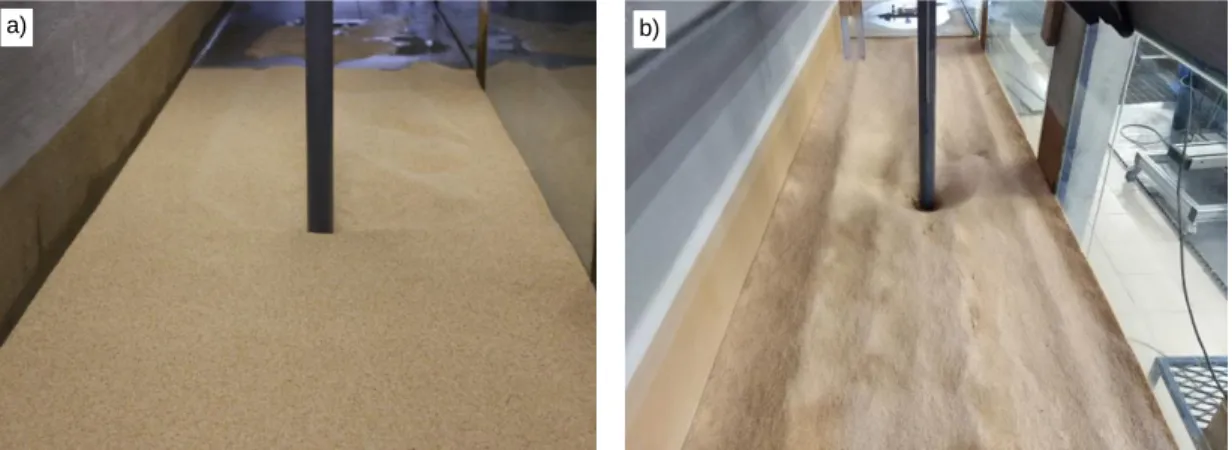
In order to understand the discrepancies between results (Experimental work vs Flow-3D) an additional experimental test was performed considering only the isolated pier under flow conditions correspond to Uc obtained by Shields criterion. Figure 9 shows the scour hole at the end of the experimental test for both cases. The time evolution of scour depth of the first 4 hours, for both tests, can be observed in Figure 10. However, the time duration of each experiment was 168 hours (7 days), in agreement with Simarro el al. (2011).
Figure 9. Sand-bed reach of the pier at the end of the tests: a) Uc evaluated by the mean of Neil (1967) and Garde (1970) equations; b) Uc evaluated by the Shields (1936) criteria.
2820
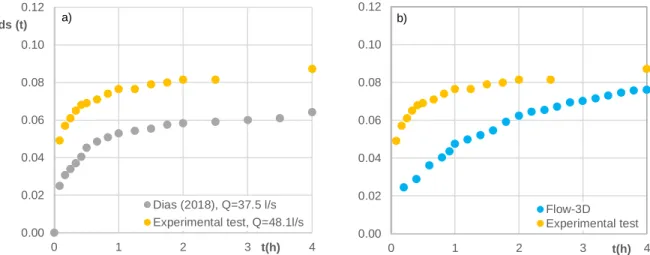
Figure 10. Time evolution of scour depth at cylindrical pier: a) Experimental results; b) Flow-3D.
The analysis of Figure 9 a), shows that the sand bed approach reach located upstream the pier stayed undisturbed throughout the experiment. This condition ensured that the scour depth was not fed by upstream bed degradation. Whereas, on the Figure 9 b), the sand bed approach reach located upstream the pier did not remain undisturbed throughout the experiment. This condition may have led to the scour hole was fed by the upstream bed degradation. It should be noted that, according to Simons and Sentürk (1992), it is physically incompatible with the ripples development, since a uniform sand with D50 = 0.86 mm was used. Thus, it may be
concluded that Uc evaluated by the Shields (1936) criteria is over evaluated.
The analysis of Figure 10 shows that the time evolution of scour depth obtained through the numerical simulation exposes the same evolution obtained experimentally and that the values are similar, although the values obtained numerically remain inferior to those obtained experimentally, showing an average deviation of 13%.
5 CONCLUSIONS
The present study made a comparation between the results obtained throughout the numerical simulation and the experimental results, under the same conditions. It was possible to verify that the floating debris gives greater scour hole depth and the debris on sand bottom behave as scour countermeasure reducing the scour hole depth, as verified in the experimental work. Also, rectangular shaped debris seems to cause a greater maximum scour depth than the triangular shaped ones, which also seemed beneficial to the scour hole, by reducing it. However, the results obtained through Flow-3D are significantly lower than those obtained experimentally, 30 %, which is believed to result from the use of Shields criteria that overestimate the value of the threshold condition of sediment entrainment.
ACKNOWLEDGEMENTS
This work was supported with Portuguese national funds by FCT - Foundation for Science and Technology within the UID/ECI/04082/2013 project.
REFERENCES
Baykal, C., Sumer, B.M., Fuhrman, D.R., Jacobsen, N.G. e FredsØe, J. (2015). “Numerical investigation of flow and scour around a vertical circular cylinder”. Philos Trans A MAth Phys Eng Sci, 373(2033): 20140115. Dias, A.J.P. (2018). Study the impact of debris on cavities erosion at bridge piers". MSc Thesis, University of
Beira Interior (in Portuguese).
Dias, A.J.P., Fael, C.S. and Núñez-González, F. (2019). Effect of debris on local scour at bridge piers. IOP Conference Series: Materials Science and Engineering, 471–022024.
Franzetti, S., Radice, A., Rabitti, M. and Rossi, G. (2011). Hydraulic design and preliminary performance evaluation of countermeasure against debris accumulation and resulting local pier scour on River Po in Italy. Journal of Hydraulic Engineering, 137(5), 615–620.
Garde, R.J. (1970). Initiation of motion on a hydrodynamically rough surface. Critical velocity approach, JIP 6(2) India.
Ghasemi, M. and Soltani-Gerdefaramarzi, S. (2017). The Scour Bridge Simulation around a Cylindrical Pier Using Flow-3D. Journal of Hydrosciences and Environment, 1(2), 46–54.
Hemdan, N.T., Abdallah, M.Y., Mohamed, A.G., Basiouny, M., Abd-Elmaged, A.B.A. (2016). Experimental study on the effect of permeable blockage at front of one pier on scour depth at mult-vents bridge supports. Journal of Engineering Sciences, Assiut University, Faculty of Engineering, 44(1), 27–39.
0.00 0.02 0.04 0.06 0.08 0.10 0.12 0 1 2 3 4 ds (t) t(h) Dias (2018), Q=37.5 l/s Experimental test, Q=48.1l/s 0.00 0.02 0.04 0.06 0.08 0.10 0.12 0 1 2 3 t(h) 4 Flow-3D Experimental test a) b)
2821 Li, G., Lang, L. and Ning, J. (2013). 3D Numerical Simulation of Flow and Local Scour around a Spur Dike.
Proceedings of the 35th IAHR World Congress, Chengdu, China.
Mehnifard, M.A., Dalfardi, S., Baghdadi, H. and Seirfar, Z. (2014). Simulation of local scour caused by submerged horizontal jets with Flow-3D numerical model. Desert 20–1, 47–55.
Meyer-Peter, E. and Müller, R., (1948), Formulas for bed-load transport. Proceedings of the 2nd Meeting of the International Association for Hydraulic Structures Research. 39–64.
Mohamed, H.I. (2012). Numerical Simulation of Flow and Local Scour at Two Submerged-emergent Tandem Cylindrical Piers”. Journal of Engineering Sciences, Assiut University, 41(1).
Moussa, Y.A.M., Nasr-Allah, T.H. and Abd-Elhasseb, A. (2016). Studying the effect of partial blockage on multi-vents bridge pier scour experimentally and numerically. Ain Shams Engineering Journal, 9(4), 1439-1450. Neil, C.R. (1967). Mean velocity criterion for scour of coarse uniform bed-material. Proceeding of of the XII IAHR
Congress, Fort Collins, Colorado, 4654.
Pagliara, S. and Carnacina, I. (2010). Temporal scour evolution at bridge piers: roughness and porosity. Journal of Hydraulic Research, 48 (1), 3–13.
Rahimi, E., Qaderi, K., Rahimpour, M. and Ahmadi, M.M. (2017). Effect of Debris on Pier Group Scour: An Experimental Study. JKSCE ournal of Civil Engineering,1–10.
Ramos, C. M. (2005) - Drainage in Transport Infrastructure and Bridges Hydraulics. National Laboratory for Civil Engineering, Book, Chapter C2 (in Portuguese)
Robalo, R.M.T. (2014). Influence of vertical cylindrical elements permeability on flow behavior, MSc Thesis. University of Beira Interior (in Portuguese).
Shields, A.F. (1936). Application of similarity principles and turbulence research to bed-load movement. Vol 26. Simarro, G., Fael, C. and Cardoso, A. (2011). Estimating equilibrium scour depth at cylindrical piers in
experimental studies. Journal of Hydraulic Engineering, 137 (9), 1089–1093.
Simons, D.B., and Sentürk, F. (1992). Sediment transport technology. Fort Collins, Colorado, USA, Water Resources Publications.
Soulsby, R.L. and Whitehouse, R.J.S.W., (1997). Threshold of sediment motion in Coastal Environments. Proceedings of Combined Australian Coastal Engineering and Port Conference, EA, 49–154.
Vasquez, J.A. and Walsh, B.W. (2009). CFD simulation of local scour in complex piers under tidal flow. Proceedings of the 33rd IAHR Congress: Water Engineering for a Sustainable Environment, Vancouver, Canada.
Winterwerp, J.C., Bakker, W.T., Mastbergen, D.R. and Van Rossum, H., (1992) Hyperconcentrated sand-water mixture flows over erodible bed. Journal of Hydraulic Engineering, 118, 1508–1525.
Zevenbergen, L.W., Lagasse, P.F. and Clopper, P.E. (2007). Effects of Debris on Bridge Pier Scour. World Environmental and Water Resources Congress 2007: Restoring Our Natural Habitat, 1–10.