________________________________
1 Trabalho extraído da dissertação de mestrado do primeiro autor da UFGD e financiado pela FUNDECT.
2 Enga Agrônoma, Doutoranda em Agronomia, Universidade Federal da Grande Dourados - UFGD, Dourados - MS, Fone: (0xx67) 9956-1392, [email protected].
3 Prof. Adjunto, Departamento de Engenharia Agrícola - DEA, UFV, Viçosa - MG. 4 Bióloga, Mestre em Agronomia, Dourados - MS.
Recebido pelo Conselho Editorial em: 28-10-2010 Aprovado pelo Conselho Editorial em: 12-1-2012
CHARACTERIZATION OF WATER AVAILABILITY IN A HYDROGRAPHIC BASIN1
FABIANE K. ARAI2, SILVIO B. PEREIRA3, GEULA G. G. GONÇALVES4
ABSTRACT: The quantitative knowledge of hydrological parameters (rainfall and flow) and their spatial and temporal variability on the regions or basins should be understood as essential to the efficient planning and management of water resources. Because the Ivinhema Basin, located in the state of Mato Grosso do Sul, Brazil, represents an important inductor on the region agricultural development, characterized as a major producer of grains and meat, it was used to characterize the hydrological study. Knowing the rainfall, flow and drainage area of each of the studied affluent, it was calculated the proportion of contribution of the affluent. To that end, it was proposed the concepts of potential and real contributions, aiming to identify the proportion of contribution of each of the affluent to the formation of the flow in the Ivinhema Basin. The results revealed that: the highest rainfall in the Ivinhema Basin occurred in the headwater regions; the mean specific flow of long duration reduces from the headwater to the mouth of Ivinhema Basin; the Sub-basin of
Dorado’s River has the highest potential and real contribution for the formation of the Ivinhema Basin flow; and the drainage areas of the affluent Dourados and Vacaria contribute with 53% flow of the basin.
KEYWORDS: river discharge, water resources, rainfall.
CARACTERIZAÇÃO DA DISPONIBILIDADE HÍDRICA EM UMA BACIA HIDROGRÁFICA
RESUMO: O conhecimento quantitativo dos parâmetros hidrológicos (precipitação e vazão) e de suas variabilidades espacial e temporal sobre as regiões ou bacias hidrográficas deve ser entendido como imprescindível ao eficiente planejamento e gerenciamento dos recursos hídricos. Em virtude de a Bacia Hidrográfica do Ivinhema, localizada no Estado do Mato Grosso do Sul, representar um importante indutor do desenvolvimento agrícola da região, caracterizada como grande produtora de grãos e carne, ela foi utilizada para a caracterização do estudo hidrológico. Conhecidas a precipitação, a vazão e a área de drenagem de cada um dos afluentes estudados, calculou-se a proporção de contribuição dos afluentes. Para tanto, propuseram-se os conceitos de contribuições potencial e real, visando à identificação da proporção de contribuição de cada um dos afluentes para a formação da vazão da Bacia do Ivinhema. Os resultados permitiram constatar que: as maiores precipitações na Bacia do Ivinhema ocorreram nas regiões de cabeceira; a vazão específica média diminui da nascente para a foz na Bacia do Ivinhema; a Sub-bacia do Rio Dourados apresenta maior contribuição potencial e real para a formação da vazão da Bacia do Ivinhema; as áreas de drenagem dos afluentes Dourados e Vacaria contribuem com 53% da vazão da bacia.
PALAVRAS-CHAVE: descarga, recursos hídricos, precipitação.
INTRODUCTION
Water is an irreplaceable asset to the safeguarding of life, and its movement on Earth occurs through rainfall, which is responsible for transporting water from the atmosphere to the surface. The quantitative knowledge of spatial variability on the regions or hydrographic basins should be understood as essential to the efficient planning and management of water resources (SALGUEIRO & MONTENEGRO, 2008).
Population growth and socioeconomic development are often accompanied by increases in demand for water, whose quantity and quality are essential to health and development of any community (BUENO et al., 2005). However, this high demand has caused qualitative and quantitative shortages of water, generating serious conflicts of use.
The minimization of conflicts over water use in this basin requires the adoption of an appropriate program of water resource management. In this sense, knowledge of water availability is the basic information for decision making in this process, and the limited series of available fluviometric data and the need to know the flow, along the river system, make it difficult or often prevent creation of a proper water management. In order to overcome this difficulty, it was used the technique of regionalization of flows to transfer spatial information (MOREIRA, 2006).
To practice proper management of water resources, it is necessary to have databases and appropriate methodologies to quantify these features. The management process should consist of a policy to set up general guidelines for a management model that establishes the administrative and functional organization and a management system consisting of all the governmental and private agencies and facilities for the implementation of the policy (FREITAS, 2000).
The sustainable management of water resources requires the regulation of the use of water through the knowledge of the water supply of the basin and its balance facing the demands of use and environmental conservation. Considering the temporal and spatial variation of river flows, along with the demand, the appropriate estimate of water availability is essential for the effective deployment of management tools (CRUZ & TUCCI, 2008).
The importance of water management is directly linked with the issue of environmental sustainability, as a development function of the various policies, economic and social components acting within the basin, and the sensitivity of these components with the theme of integrated management of water resources (SÁNCHEZ-ROMÁN et al., 2009).
The Ivinhema Basin is located in south-central state of Mato Grosso do Sul, Brazil; it is formed by the junction of the Vacaria River, on the left margin, and the Dourados River, on the right margin, and occupies an area of approximately 46,500 km2. The Ivinhema Basin is of great importance to agricultural development and, with the growth of irrigated agriculture, the knowledge of the hydrological characteristics of this basin becomes of great importance for the utilization of its waters to be optimized, with less environmental impact.
Because the Ivinhema Basin represent an important inducer of agricultural development in the region, the knowledge of its hydrological behavior is extremely important to support the decision making in water resources management, as it will show the availability of this resource, consisting therefore, an important benefit to the management of water resources. Based on this approach, this study aimed to analyze water availability, pertaining to the data of annual mean rainfall, annual mean flow and outflow coefficient, characterizing the potential and actual contributions, in order to identify the proportion of contribution of each of the affluent to the flow formation of Ivinhema Basin.
MATERIAL AND METHODS
Due to lack of data prior to 2003 season for the Federal University of Grande Dourados (UFGD), it was used data from the meteorological station of Embrapa (CPAO) for the period before 2003. For the common period of these two stations, it was used the arithmetic mean.
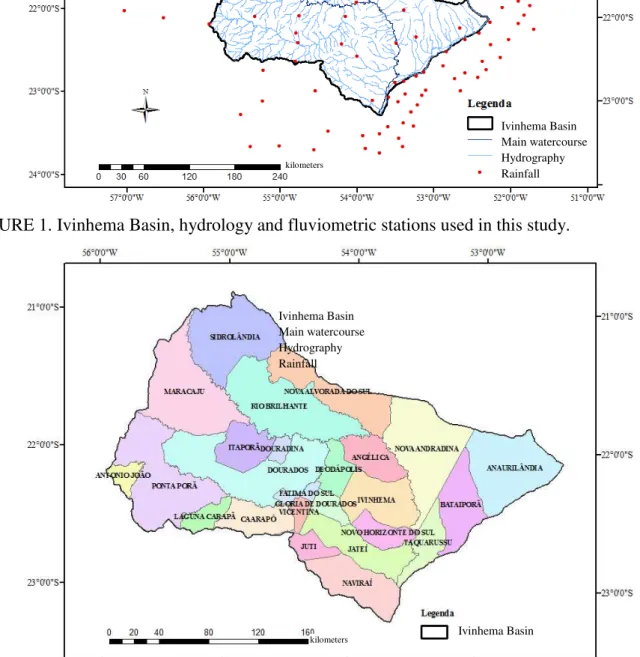
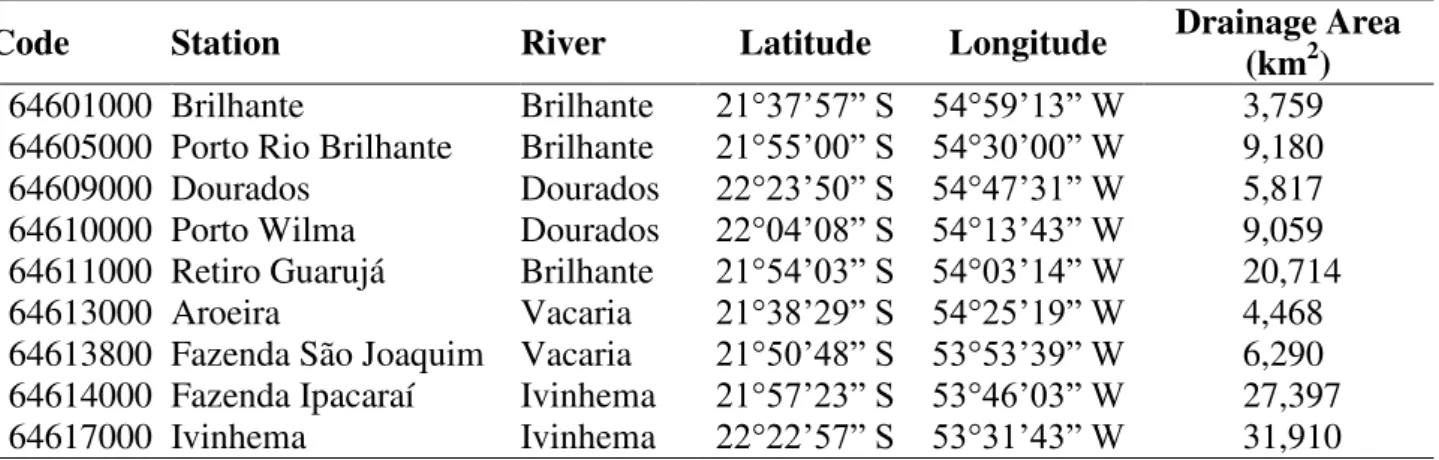
Figure 1 shows the map with the location of fluviometric stations used to analyze the behavior of the rainfall, both within and outside the Ivinhema Basin. And Figure 2 shows the Ivinhema Basin and its municipal boundaries. These maps were generated using software of Geographic Information System ArcGIS 9.3.1.
FIGURE 1. Ivinhema Basin, hydrology and fluviometric stations used in this study.
FIGURE 2. Ivinhema Basin and its municipal boundaries.
Ivinhema Basin Main watercourse Hydrography Rainfall
Ivinhema Basin Main watercourse Hydrography Rainfall
Ivinhema Basin
The criterion for the selection of stations was the existence of at least 10 years of data. After selected the stations, it was proceeded to the preliminary analysis for the identification of the period (common period of observations) to be used in the study. It was chose to select the base-period from 1976 to 2006, corresponding to a series of 31 years.
Often measurements are flawed, as the lack of data or gross errors due to problems in the unit or the lack of the station operator. However, it is necessary to work with uninterrupted series, which requires data to be subjected to preliminary analysis prior to use. The first step to prepare the data for statistical treatment is to identify and correct these errors. The main methods to fill regional gaps are regional weighting, linear regression and regional weighting based on linear regressions.
The method chosen to perform the failure filling of rainfall data was the regional weighting method, which consists to establish linear regressions between the post with data to be filled and each of the neighboring stations. From each of the linear regression performed, it was obtained correlation coefficient, and the filling was made using the following equation:
C C X B B X A A X
x N P
N P N N P N N 3 1
P (1)
in which:
P - rainfall;
N - annual normal rainfall;
X - index for the station that fails, and
A, B, C - indexes referring to support stations.
To calculate the spatial distribution of annual and monthly mean rainfall of Ivinhema Basin, it was used the method of isohyets, according to the methodology described by TUCCI (2004) and the Geographic Information System (GIS) Arcgis 9.3.1 for spatial rainfall.
To calculate the mean rainfall in the drainage area of Ivinhema Basin, it was used the Thiessen Polygon method, according to EUCLYDES & FERREIRA (2002). This method considers the non-uniformity of spatial distribution of posts, but does not take into account the topography of the basin. The method gives good results in slightly injured lands, when the location and exposure of rain gauges are similar and the distances between them are not too large (TUCCI, 2004). The calculation was performed by a weighted mean between the rainfall of each station and the weight assigned to it, which is the area of influence of rainfall in every season.
It was used nine fluviometric stations, belonging to hydro-meteorological network of the National Water Agency (ANA), to analyze the flow. In Table 1, fluviometric stations are shown with their identification codes of the ANA, the river where they are located, the geographic coordinates and the drainage area. The drainage areas were obtained by means of a digital elevation model generated in the GIS, so they are not obtained by fluviometric inventory of ANA.
TABLE 1. Characterization of selected fluviometric stations.
Code Station River Latitude Longitude Drainage Area (km2)
64601000 Brilhante Brilhante 21°37’57” S 54°59’13” W 3,759
64605000 Porto Rio Brilhante Brilhante 21°55’00” S 54°30’00” W 9,180
64609000 Dourados Dourados 22°23’50” S 54°47’31” W 5,817
64610000 Porto Wilma Dourados 22°04’08” S 54°13’43” W 9,059
64611000 Retiro Guarujá Brilhante 21°54’03” S 54°03’14” W 20,714
64613000 Aroeira Vacaria 21°38’29” S 54°25’19” W 4,468
64613800 Fazenda São Joaquim Vacaria 21°50’48” S 53°53’39” W 6,290
64614000 Fazenda Ipacaraí Ivinhema 21°57’23” S 53°46’03” W 27,397
After the analysis of hydrological data, to those missing or inconsistent considered data, failures were attributed to later filling. The gap filling for the mean flow data was performed by means of correlations, according to criteria established for selecting bases for regressions.
To carry out the filling to flow data, it was adopted, as criterion, the obtainment of correlation coefficient greater than 0.85 and the existence of, at least, ten pairs of events between the stations to perform regression.
At the stations in the affluent of the main river of Ivinhema Basin, the regionalization of the mean flows was held from the method of drainage area ratio, in order to estimate the flow in outflow sections of the sub-basins in the main river of Ivinhema Basin. For this, it was used the following equation:
Qx Ax Ay
Qy
(2)
in which:
Qy - reference flow at a point in the basin, m3 s-1;
Ay - drainage area of the section of interest, the flow downstream of the section known, km2; Ax - drainage area of flow section known, km2, and
Qx - reference flow at a near fluviometric post, m3 s-1.
Knowing the mean rainfall, the mean flow and drainage area of each of the affluent studied, it was calculated the proportion of contribution of each, as proposed by PEREIRA et al. (2007), aiming to identify the proportion of individual contributions in the formation of the main river flow.
The potential contribution is defined by the relation between the volume precipitated in the drainage area of each affluent and the volume precipitated in the drainage area of the basin. In other words, the contribution of the present affluent to the formation of the main river flow if all rainfall were converted to runoff, calculated with the following equation:
100 Vpbacia Vpafluente
Cp (3)
In which:
Cp - potential contribution, %;
Vpafluente - volume precipitated in the drainage area of studied affluent, m3, and
Vpbasin - volume precipitated in the drainage area of basin, m3.
The real contribution is defined by the ratio of annual mean volume drained on the drainage area of the affluent into the main river of the interest basin and the annual mean volume drained at its mouth, which was representative of the contribution that each affluent presents to the formation of the flow of main river, reflecting, in this case, to the losses incurred by evapotranspiration and consumptive uses in the basin. The following equation was used:
100 Vebacia Veafluente
Cr (4)
In which:
Cr - real contribution, %;
Veafluent - mean volume drained on the drainage area of the affluent into the main river, m3, and
Vebasin - mean volume drained at the mouth of the main river, m3.
The runoff coefficient is characterized by the ratio of the volume that flows through the section considered and the total rainfall volume, whose growth is directly related to the fact that with the increase in total rainfall, the lower portion of this will be converted into evapotranspiration, resulting in a greater proportion of rainfall converted to runoff into the river. The equation used for this determination was:
Vtp Vte
C (5)
In which:
C - runoff coefficient, dimensionless;
Vte - runoff volume in the drainage area, m3, and
Vtp - total rainfall volume, m3.
RESULTS AND DISCUSSION
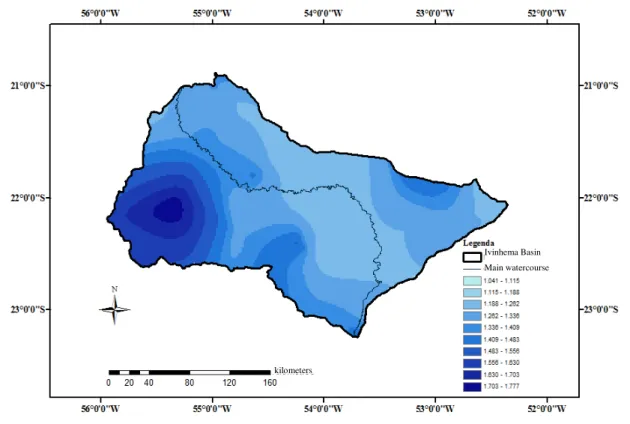
Figure 3 presents, for the Ivinhema Basin, the distribution of annual mean rainfall, in the period from 1976 to 2006. It is observed that the rainfall in the headwaters region, between the boundaries of Brilhante and Dourados Sub-basins, shows values greater than 1,700 mm, decreasing toward the mouth, where there is value around 1,000 mm.
FIGURE 3. Annual mean rainfall in the Ivinhema Basin.
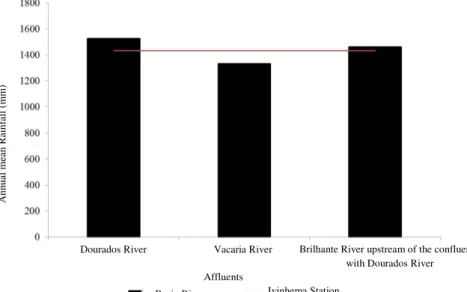
Figure 4 shows the annual mean rainfall in the drainage areas of the main affluents of the main river of Ivinhema Basin and the mean rainfall in the basin, represented by the fluviometric station of Ivinhema, with drainage area of 31,910 km2, which represents about 70% of the total area of the basin under study. It was may notice that the Vacaria sub-basin has mean rainfall less than shown on the Ivinhema station. The Dourados Sub-Basin, however, showed a mean rainfall higher than Ivinhema Basin. It appears also that the mean rainfall in the drainage area of Brilhante River, upstream of the confluence with Dourados River was lower than mean rainfall in the drainage area of Dourados River. This analysis affects the proportion of the potential contribution of affluents to the main river of the basin.
Ivinhema Basin Main watercourse
FIGURE 4. Annual mean rainfall in the drainage areas of major affluents (Dourados River and Vacaria River) and in the drainage areas of the Ivinhema Basin, represented by Ivinhema station, considering the period from 1976 to 2006.
In the analysis of the potential contribution of each affluent (Figure 5), it appears that Dourados Sub-basin, which represents 28.9% of the drainage area of Ivinhema Basin in relation to the point of the study (Ivinhema station), has the highest potential contribution (31%), and the rainfall in this sub-basin is 6.5% higher than the one from the basin (Figure 4). In Vacaria Sub-basin, which has the second largest contribution (19%), it was observed that its drainage area represents 20.6% of the area of Ivinhema Basin, in relation to Ivinhema station, and an mean rainfall of 6.8% lower than the basin.
FIGURE 5. Proportion of the potential contribution of the main affluent to the main river of Ivinhema Basin, considering the period from 1976 to 2006.
Analyzing the potential contribution of the Brilhante River, the upstream of the confluence with Dourados River, despite the larger drainage area (approximately 18% greater or a drainage area of 1,690 km2 more than the Dourados River), the proportion of potential contribution was only 4% higher. However, rainfall variations of these drainage areas showed a difference of 4.3%.
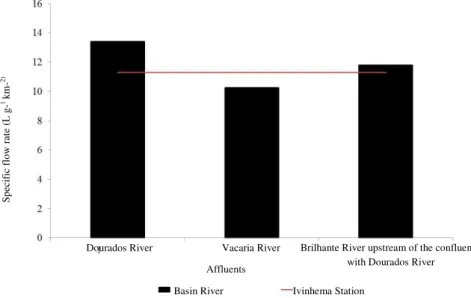
Figure 6 shows the long-term mean specific flow rates in the major affluent of Ivinhema Basin (Dourados and Vacaria Rivers) and the main river itself. The specific flow rate was observed
Dourados River Vacaria River Brilhante River upstream of the confluence with Dourados River Affluents
Basin River Ivinhema Station
Annua
l mea
n
R
ainf
all
(
mm
)
Others 15%
Dourados River 31%
Vacaria River 19%
Brilhante River upstream of the confluence with
in most Dourados Sub-Basin, which can be partially explained by the fact that they are the highest rainfalls in the headwaters region of this sub-basin, reaching 1,777 mm per year. The specific flow rate in Dourados Sub-basin was 18.5% higher when compared to that evidenced in Ivinhema Basin, represented by Ivinhema station.
The Vacaria Sub-basin showed specific flow rate lower than the mean specific flow rate shown in Ivinhema Basin, which is the sub-basin with mean rainfall in its drainage area below than the mean found in the basin.
FIGURE 6. Long-term mean specific flow rate in the major affluent and in the main river of the Ivinhema Basin, represented by Ivinhema station, considering the period from 1976 to 2006.
Analyzing the point of the potential contribution of Brilhante River, the upstream of the confluence with Dourados River, despite the larger drainage area, had a long-term mean specific flow rate lower (12%) than that one found in Dourados Sub-basin, emphasizing the importance of the formation of the flow of the main river of Ivinhema Basin.
Behavior similar to the long-term mean specific flow rate was also evidenced in the runoff coefficient (Figure 7), whose growth is directly related to the fact that, as an increase in total rainfall, the lower portion of it will be converted to evapotranspiration, resulting in a higher proportion of rainfall converted to runoff in the river.
FIGURE 7. Runoff coefficient in the main affluent and in the main river of Ivinhema Basin, represented by Ivinhema station, considering the period from 1976 to 2006.
Spe
cif
ic
fl
ow
ra
te
(L
g
-1 km
-2)
Brilhante River upstream of the confluence with Dourados River Vacaria River
Dourados River
Basin River Ivinhema Station
Ru
no
ff
Co
efficie
nt
Affluents
Brilhante River upstream of the confluence with Dourados River Vacaria River
Dourados River
Affluents
In the studied sub-basins it was found runoff coefficient values ranging from 0.23 (Vacaria Sub-basin) to 0.27 (Dourados Sub-basin), i.e., a variation of 17.4%. This fact, considering the Vacaria Basin, which has the lowest runoff coefficient, shows that from the total precipitated volume, 23% reaches its mouth, flowing into the Ivinhema River, and that 77% of the total rainfall is converted, a part to evapotranspiration, a part infiltrates into the soil and a parte is removed from the basin due to consumptive uses, i.e., those uses that remove water from its natural source reducing its quantitative or qualitative availability.
In Ivinhema Basin, represented by Ivinhema station, the mean runoff coefficient around was 25% of the total rainfall converted into runoff. This fact justifies the potential that the use of storage reservoirs represent for irrigated agriculture in the basin.
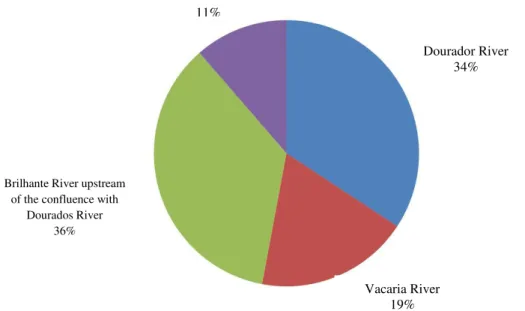
Figure 8 shows the proportions of the real contribution of the main affluent of Ivinhema Basin for the formation of its flow, considering the period from 1976 to 2006. It appears that the sub-basin with a higher proportion of real contribution was the Dourados (34%), which is higher than the proportion of the potential contribution corresponding to this sub-basin (31%). The Vacaria Sub-basin presented a real contribution of 19%, a value slightly lower than the potential contribution obtained for the same sub-basin (20%).
FIGURE 8. Proportion of actual contribution of the main affluent to the main river of Ivinhema Basin, considering the period from 1976 to 2006.
The corresponding behavior to these sub-basins may be understood by examining the total precipitated volume in their drainage areas. In Vacaria Sub-basin, it was observed values of annual mean rainfall lower than those found in Dourados Sub-basin, mainly in its headwaters (Figure 4).
Analyzing the real contribution of the Brilhante River, the upstream of the confluence with the Dourados River, it was noticed that, despite the larger drainage area (approximately 18% larger), the proportion of actual contribution was only 2% higher than the Dourados River.
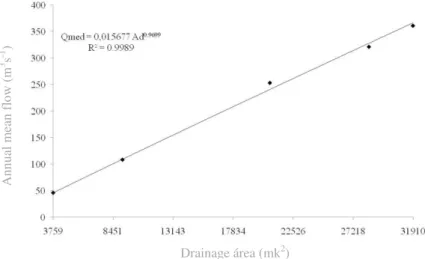
Figure 9 presents the annual mean flow of the fluviometric stations considered along the main river of Ivinhema Basin, as well as the fitted equation of the mean flow as a function of drainage area, considering the period from 1976 to 2006. The coefficient obtained by the adjusted equation of the annual mean flow rate resulted in a determination coefficient of about 0.99, and the adjusted equation of potential type. Despite the adjustment of potential type equation, it has, according to the value of the exponent, very close to unity, a similar behavior to the linear, characterizing an increase, approximately constant of the flow rates with increasing drainage area.
Others 11%
Dourador River 34%
Vacaria River 19%
Brilhante River upstream of the confluence with
FIGURE 9. Variation of annual mean flow along the main river of the Ivinhema Basin, depending on the drainage area, considering the period from 1976 to 2006.
The variations in the behavior of mean flows estimated by the adjusted equation in relation to the one observed presented the major differences at Retiro Guarujá (5.1%) and Fazenda Ipacaraí (2.1%) stations, with super - and underestimation, respectively. The estimated mean flow at Retiro Guarujá station was 240.9 m3 s-1 and the observed one was 253.1 m3 s-1, while at Fazenda Ipacaraí station the estimated flow was 327.9 m3 s-1 and the observed one was 321.1 m3 s-1. In the Ivinhema Basin, represented in this study by the Ivinhema station, with a drainage area of 31,910 km2
(corresponding to approximately 70% of basin area), the long-term mean specific flow rate, estimated by the equation was 366.4 m3 s-1, and the observed one was 360.9 m3 s-1.
Figure 10 presents the long-term mean specific flow rate in function of drainage area, for the main river of Ivinhema Basin. It is noteworthy that despite the increase in mean flow with increasing drainage area, the specific flow rate was reduced, with the lowest one evidenced in the Ivinhema station, with a value of 11.3 L s-1 km-2, while the most specific flow identified in the most upstream station (Brilhante) was 12.2 L s-1 km-2. This is due to the characteristic of rainfall distribution in the basin.
FIGURE 10. Long-term mean specific flow rate (Qesp) as a function of drainage area (Ad) in the main river of the Ivinhema Basin, considering the period from 1976 to 2006.
CONCLUSIONS
The highest rainfall in the Ivinhema Basin occurred in headwater regions.
The long-term mean specific flow rate decreases from the source to the mouth of the Ivinhema Basin, up to the limit with the Ivinhema station.
Drainage área (mk2)
An
nu
al
m
ea
n
fl
ow (m
3 s -1 )
Drainage área (mk2)
S
pe
cifi
c
flo
w rate
(Ls
The Dourados River Sub-basin, which represents 28.9% of the drainage area of Ivinhema Basin, has a higher potential and actual contribution to flow formation of the Ivinhema Basin.
The drainage areas of Dourados and Vacaria affluents, representing 49.5% of the Ivinhema Basin area, in relation to Ivinhema station, contribute 53% of its flow, considering the period from 1976 to 2006.
The Vacaria River Sub-basin showed rainfall and mean specific flow rate lower than the mean of Ivinhema Basin, represented by the Ivinhema station.
ACKNOLEDMENTS
This study was supported by the FUNDECT, Foundation to Support Development of Education, Science and Technology of the State of Mato Grosso do Sul, Brazil.
REFERENCES
BUENO, L.F.; GALBIATTI, J.A.; BORGES, M.J. Monitoramento de variáveis de qualidade de água no horto Ouro Verde - Conchal - SP. Engenharia Agrícola, Jaboticabal, v.25, n.3, p.742-748,
2005.
CRUZ, J.C.; TUCCI, C.E.M. Estimativa da disponibilidade hídrica através da curva de permanência. Revista Brasileira de Recursos Hídricos, Porto Alegre, v.13, n.1, p.111-124,
jan./mar. 2008.
EUCLYDES, H.P.; FERREIRA, P.A. Sub-Bacias do Alto e Médio São Francisco. Recursos
Hídricos e Suporte Tecnológico a Projetos Hidroagrícolas. Viçosa: UFV/RURALMINAS, 258 p.
(Boletim Técnico, 6).
FREITAS, A.J. Gestão de recursos hídricos. In: SILVA, D.D.; PRUSKI, F.F. Gestão de recursos hídricos: aspectos legais, econômicos, administrativos e sociais. Brasília: Secretaria de Recursos
Hídricos; Viçosa-MG: Universidade Federal de Viçosa; Porto Alegre: Associação Brasileira de Recursos Hídricos, 2000. 659 p.
MOREIRA, M.C. Gestão de recursos hídricos: sistema integrado para otimização da outorga de
uso da água. 2006. 97 f. Dissertação (Mestrado em Engenharia Agrícola) - Universidade Federal de Viçosa, Viçosa, 2006.
PEREIRA, S.B.; SOBRINHO, T.A.; FEDATTO, E.; PEIXOTO, P.P.P.; BONACINA, R. Variação temporal do comportamento hidrológico na Bacia do Rio Dourados no período de 1973 a 2002.
Engenharia Agrícola, Jaboticabal, v.27, n.2, p.560-568, maio/ago. 2007.
QUEIROZ, A.T.; BARBOSA, G.R.; ZANZARINI, R.M.; ALBINO, K.A.; MENDES, P.C.
Caracterização da distribuição pluviométrica do Rio Tijuco. In: SIMPÓSIO BRASILEIRO DE
GEOGRAFIA FÍSICA APLICADA, 13., 2009. Viçosa. Anais...
SALGUEIRO, J.H.P. de B.; MONTENEGRO, S.M.G.L. Análise da distribuição espacial da precipitação na Bacia do Rio Pajeú em Pernambuco segundo método estatístico. Revista Tecnologia, Fortaleza, v.29, n.2, p.174-185, dez. 2008.
SÁNCHEZ-ROMÁN, R.M.; FOLEGATTI, M.V.; ORELLANA-GONZÁLEZ, A.M.G. Situação dos recursos hídricos nas bacias hidrográficas dos rios Piracicaba, Capivari e Jundiaí utilizando modelo desenvolvido em dinâmica de sistemas. Engenharia Agrícola, Jaboticabal, v.29, n.4,
p.578-590, 2009.
TUCCI, C.E.M. (Org.). Hidrologia: ciência e aplicação. 3.ed. Porto Alegre: Ed. Universidade/