Associations of Infant Subcutaneous Fat Mass with Total and
Abdominal Fat Mass at School-Age: The Generation R Study
Susana Santos,a,bRomy Gaillard,b,c,dAndreia Oliveira,a,eHenrique Barros,a,eMarieke Abrahamse-Berkeveld,f Eline M. van der Beek,fAlbert Hofman,dVincent W. V. Jaddoeb,c,d
aEPI-Unit, Institute of Public Health, University of Porto, Porto, Portugal bThe Generation R Study Group
cDepartments of Pediatrics
dEpidemiology, Erasmus MC, University Medical Center, Rotterdam, The Netherlands e
Department of Clinical Epidemiology, Predictive Medicine and Public Health, University of Porto Medical School, Porto, Portugal
fNutricia Research, Danone Nutricia Early Life Nutrition, Utrecht, The Netherlands
Abstract
Background: Skinfold thickness enables the measurement of overall and regional subcutaneous fatness in infancy and may be associated with total and abdominal body fat in later childhood. We examined the associations of subcutaneous fat in infancy with total and abdominal fat at school-age.
Methods: In a population-based prospective cohort study among 821 children, we calculated total subcutaneous fat (sum of biceps, triceps, suprailiacal, and subscapular skinfold thicknesses) and central-to-total subcutaneous fat ratio (sum of suprailiacal and subscapular skinfold thicknesses/total subcutaneous fat) at 1.5 and 24 months. At 6 years, we measured fat mass index (total fat/height3), central-to-total fat ratio (trunk fat/total fat), and android-to-gynoid fat ratio (android fat/gynoid fat) by dual-energy X-ray absorptiometry and preperitoneal fat mass area by abdominal ultrasound.
Results: Central-to-total subcutaneous fat ratio at 1.5 months was positively associated with fat mass index and central-to-total fat ratio at 6 years, whereas both total and central-to-total subcutaneous fat ratio at 24 months were positively associated with all childhood adiposity measures. A 1-standard-deviation scores higher total subcutaneous fat at 24 months was associated with an increased risk of childhood overweight (odds ratio 1.70, 95% confidence interval 1.36, 2.12). These associations were weaker than those for body mass index and stronger among girls than boys.
Conclusions: Subcutaneous fat in infancy is positively associated with total and abdominal fat at school-age. Our results also suggest that skinfold thicknesses add little value to estimate later body fat, as compared with body mass index.
Keywords:infancy, subcutaneous fat, tracking, childhood, abdominal fat.
Infancy seems to be a critical period for the develop-ment of obesity.1 An accumulating body of evidence has suggested that nutrition and growth in infancy are related to the risk of obesity in later life.2,3Also, infant growth patterns seem to be related not only to body mass index but also to an adverse body fat distribu-tion.4,5 Several studies have shown that compared with body mass index, body fat distribution plays a greater role in the development of obesity-related
complications such as cardiovascular disease and type 2 diabetes.6Although previous studies have suggested that central fat mass tracks moderately from mid-childhood into adulthood,7–10it is not known whether body fat distribution measures in infancy are associ-ated with similar measures in later childhood.
Skinfold thickness is a valid measurement of subcu-taneous fat mass that enables assessment of overall and regional fatness in infancy.11 Previously, we reported the tracking of subcutaneous fat mass mea-sured by skinfold thickness during the first 2 years of life.12 Assessing the associations of these specific fat mass measures during infancy with fat mass mea-sures during childhood helps to further understand Correspondence:
Vincent W. V. Jaddoe, The Generation R Study Group, Erasmus MC, University Medical Center, PO Box 2040, 3000 CA Rotterdam, The Netherlands.
the stability of body fat across childhood. Also, skin-fold thickness measurements in infancy may be asso-ciated with an adverse body fat pattern in later childhood.
Therefore, we examined, in a population-based prospective cohort study among 821 children, the associations of infant subcutaneous fat mass measures with total and abdominal fat mass measures and with the risk of overweight at school-age.
Methods
Study design
This study was embedded in the Generation R Study, a population-based prospective cohort study from early pregnancy onwards among 9778 mothers and their children living in Rotterdam, the Netherlands.13 The study was approved by the local Medical Ethical Committee. Written informed consent was obtained from all mothers. Additional detailed assessments of fetal and postnatal growth and development were conducted in a subgroup of Dutch mothers and their children from late pregnancy onwards. Of all approached women, 80% agreed to participate. Of the total of 1205 singleton children participating in the subgroup study, 965 children had body mass index, or skinfold thicknesses measured at the age of 1.5 or 24 months. Of the group of 965 children, 821 children had follow-up measurements at the age of 6 years (Flow chart is given in Figure S1).
Body fat measurements during infancy
We measured weight to the nearest gram in naked infants at the age of 1.5 months using an electronic infant scale and at 24 months using a mechanical per-sonal scale (SECA, Almere, The Netherlands). Body length at the age of 1.5 months was measured in supine position to the nearest millimetre using a neonatometer and body height at 24 months was measured in standing position using a Harpenden sta-diometer (Holtain Limited, Dyfed, UK). Body mass index (kg/m2) was calculated.
We measured skinfold thicknesses at the ages of 1.5 and 24 months on the left side of the body at the biceps, triceps, suprailiacal, and subscapular area using a skinfold calliper (Slim Guide, Creative Health Products) according to standard procedures.12We cal-culated total subcutaneous fat mass from the sum of
all four skinfold thicknesses, and central subcuta-neous fat mass from the sum of suprailiacal and sub-scapular skinfold thicknesses.14,15 To create total subcutaneous fat mass independent of length or height and central subcutaneous fat mass indepen-dent of total subcutaneous fat mass, we estimated the optimal adjustment by log–log regression analyses.16 Details of these regressions are given in the Support-ing Information. Total subcutaneous fat mass was only weakly correlated with length or height, and was not adjusted for it, whereas a central-to-total subcuta-neous fat mass ratio was calculated as central divided by total subcutaneous fat mass.
Body fat measurements at school-age
Measurements were performed in a dedicated research centre by a well-trained staff.4We measured height to the nearest millimetre using a Harpenden stadiometer (Holtain Limited, Dyfed, UK) and weight to the nearest gram using a mechanical personal scale (SECA) in a standing position without shoes and heavy clothing. We calculated body mass index (kg/ m2), and defined overweight and obesity as described by Cole et al.17
We measured total and regional body fat mass using a DXA scanner (iDXA, GE-Lunar, 2008, Madi-son, WI, USA, ENCORE software v.12.6), according to standard procedures.4 Previous studies have vali-dated DXA against computed tomography for body fat assessment.18–20 We divided total fat mass by height3 in order to obtain a fat mass index uncorre-lated with height, as confirmed by a log–log regres-sion analysis.16,21We assessed central fat mass as fat mass of the trunk, and divided by total fat mass in order to obtain a central-to-total fat mass ratio effec-tively uncorrelated with total fat mass. We calculated the ratio of android and gynoid fat mass, which reflects the relation between fat mass in the abdomen (android) and hip (gynoid) regions.
Abdominal preperitoneal fat mass, as a proxy for vis-ceral fat mass, was measured by abdominal ultrasound (GE LOGIQ E9, Milwaukee, WI, USA), as described previously.22 Briefly, a linear (L12-5 MHz) transducer was placed perpendicular to the skin surface on the median upper abdomen.23 We scanned longitudinally from the xiphoid process to the navel along the midline (linea alba). Preperitoneal fat mass area was measured as the area of 2-cm length along the midline starting from the reference point in direction of the navel.
Covariates
Information on maternal age, educational level, par-ity, pre-pregnancy weight, and smoking habits during pregnancy was assessed using self-reported question-naires during pregnancy. We measured maternal height at enrolment, and calculated pre-pregnancy body mass index (kg/m2). Information about child’s sex, gestational age, and weight at birth was obtained from medical records. Information about breast-feed-ing duration, timbreast-feed-ing of introduction of solid foods, and average television watching time at 6 years old was obtained by questionnaires.
Statistical analysis
We examined differences between boys and girls for maternal and child’s characteristics with Student’s t-tests and Mann-Whitney t-tests for normally and non-normally distributed variables, respectively and with v2-test for dichotomous variables. We used Pearson’s or Spearman’s rank correlation coefficients to estimate correlations of subcutaneous fat mass measures at 1.5 or 24 months with total and abdominal fat mass mea-sures at 6 years. We assessed the associations of infant subcutaneous fat mass measures with childhood total and abdominal fat mass measures using linear regres-sion models and with the risk of childhood over-weight using logistic regression models. These regression models were adjusted for maternal age, educational level, parity, pre-pregnancy body mass index, and smoking habits during pregnancy, and child’s gestational age-adjusted birthweight SDS, breast-feeding duration, timing of introduction of solid foods, and TV-watching time. We included covariates in the models when they changed the effect estimates substantially (>10%), or when they were strongly associated with body fat mass in our or previous studies. Since we observed statistically significant interactions between infant subcutaneous fat mass measures and child’s sex in the association with childhood total and abdominal fat mass mea-sures, we performed all analyses for the total group and for boys and girls separately. No significant inter-actions were observed with body mass index cate-gories at 1.5 or 24 months. We constructed SDS ((observed value mean)/SD) for all continuous body fat measures at each age to take into account the expected changes in body composition and fat distri-bution across ages and also to enable comparisons in
effect size for different exposure and outcome mea-sures. Missing values in covariates (ranging from 0 to 15%) were multiple-imputed, using Markov chain Monte Carlo approach. Five imputed data sets were created and analysed together. We performed statisti-cal analyses using the SPSS version 21.0 for Windows (SPSS Inc, Chicago, IL, USA).
Results
Subject characteristics
Tables 1 and 2 show the subject characteristics. Boys had higher body mass index, whereas girls had higher central-to-total subcutaneous fat mass ratio at 1.5 months and a higher total subcutaneous fat mass and central-to-total subcutaneous fat mass ratio at 24 months. At 6 years, girls had higher fat mass index, central-to-total fat mass ratio, and abdominal preperi-toneal fat mass area than boys. Table S2 gives all sub-cutaneous fat mass measures at 1.5 and 24 months. Non-response analyses showed that as compared with children who did not participate in the follow-up stud-ies, those who did participate were born with a higher weight and gestational age at birth and were breastfed for a longer period (P< 0.05) (Table S3).
Body fat from infancy to childhood
The unadjusted correlations of infant subcutaneous fat mass measures at 1.5 or 24 months with total and abdominal fat mass measures at 6 years old for the total group and by sex are shown in Tables S4 and S5 respectively.
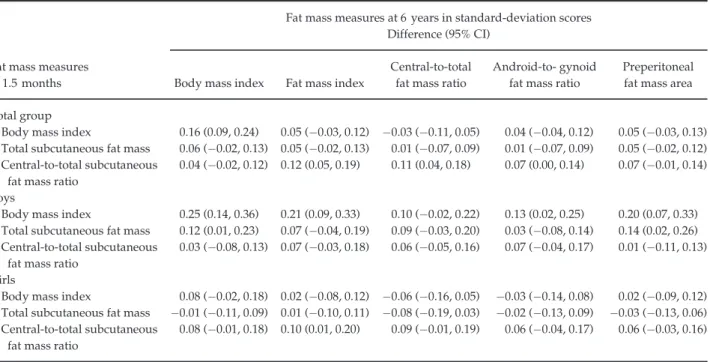
A 1-standard-deviation scores (SDS) higher body mass index at 1.5 months was only associated with a 0.16 (95% confidence interval (CI) 0.09, 0.24) SDS increase in body mass index at 6 years (Table 3). A 1-SDS higher central-to-total subcutaneous fat mass ratio at 1.5 months was associated with a 0.12 (95% CI 0.05, 0.19) SDS increase in fat mass index and a 0.11 (95% CI 0.04, 0.18) SDS increase in central-to-total fat mass ratio at 6 years. No other associations of fat mass at 1.5 months with fat outcomes at 6 years were observed. Also, no sex differences were observed.
A 1-SDS higher body mass index at 24 months was associated with an increase of 0.48 (95% CI 0.42, 0.54) SDS in body mass index, 0.33 (95% CI 0.26, 0.40) SDS in fat mass index, 0.18 (95% CI 0.11, 0.26) SDS in
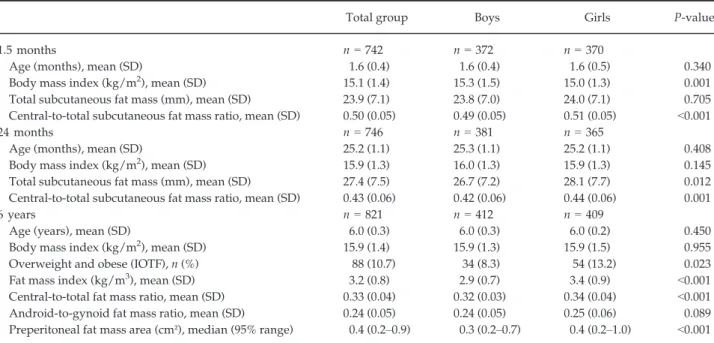
Table 2. Body fat at 1.5 and 24 months by skinfold thicknesses and at 6 years old by dual-energy X-ray absorptiometry and abdominal ultrasounda
Total group Boys Girls P-value
1.5 months n= 742 n= 372 n= 370
Age (months), mean (SD) 1.6 (0.4) 1.6 (0.4) 1.6 (0.5) 0.340
Body mass index (kg/m2), mean (SD) 15.1 (1.4) 15.3 (1.5) 15.0 (1.3) 0.001
Total subcutaneous fat mass (mm), mean (SD) 23.9 (7.1) 23.8 (7.0) 24.0 (7.1) 0.705
Central-to-total subcutaneous fat mass ratio, mean (SD) 0.50 (0.05) 0.49 (0.05) 0.51 (0.05) <0.001
24 months n= 746 n= 381 n= 365
Age (months), mean (SD) 25.2 (1.1) 25.3 (1.1) 25.2 (1.1) 0.408
Body mass index (kg/m2), mean (SD) 15.9 (1.3) 16.0 (1.3) 15.9 (1.3) 0.145
Total subcutaneous fat mass (mm), mean (SD) 27.4 (7.5) 26.7 (7.2) 28.1 (7.7) 0.012
Central-to-total subcutaneous fat mass ratio, mean (SD) 0.43 (0.06) 0.42 (0.06) 0.44 (0.06) 0.001
6 years n= 821 n= 412 n= 409
Age (years), mean (SD) 6.0 (0.3) 6.0 (0.3) 6.0 (0.2) 0.450
Body mass index (kg/m2), mean (SD) 15.9 (1.4) 15.9 (1.3) 15.9 (1.5) 0.955
Overweight and obese (IOTF), n (%) 88 (10.7) 34 (8.3) 54 (13.2) 0.023
Fat mass index (kg/m3), mean (SD) 3.2 (0.8) 2.9 (0.7) 3.4 (0.9) <0.001
Central-to-total fat mass ratio, mean (SD) 0.33 (0.04) 0.32 (0.03) 0.34 (0.04) <0.001
Android-to-gynoid fat mass ratio, mean (SD) 0.24 (0.05) 0.24 (0.05) 0.25 (0.06) 0.089
Preperitoneal fat mass area (cm²), median (95% range) 0.4 (0.2–0.9) 0.3 (0.2–0.7) 0.4 (0.2–1.0) <0.001 IOTF, International Obesity Task Force; SD, standard deviation.
a
Values are expressed as means (SD), medians (95% range), or numbers of subjects (valid %). Body mass index= weight/height2. Total subcutaneous fat mass= biceps + triceps + suprailiacal + subscapular skinfold thicknesses. Central-to-total subcutaneous fat mass ratio= (suprailiacal + subscapular skinfold thicknesses)/total subcutaneous fat mass. Fat mass index = total fat mass/height3. Central-to-total fat mass ratio= trunk fat mass/total fat mass. Android-to-gynoid fat mass ratio = android fat mass/gynoid fat mass.
Table 1. Characteristics of study participantsa
Total group (n= 821) Boys (n= 412) Girls (n= 409) P-value Maternal characteristics
Age (years), mean (SD) 32.0 (3.9) 31.8 (3.9) 32.1 (3.8) 0.346
Highest completed education, n (%)
Primary school 10 (1.2) 3 (0.7) 7 (1.7) 0.428
Secondary school 265 (32.3) 135 (32.8) 130 (31.8)
Higher education 546 (66.5) 274 (66.5) 272 (66.5)
Parity, n (%) primiparae 522 (63.6) 262 (63.6) 260 (63.6) 0.995
Pre-pregnancy body mass index (kg/m2), mean (SD) 23.5 (4.0) 23.4 (4.0) 23.7 (4.0) 0.208
Smoking habits during pregnancy, n (%) yes 175 (21.3) 87 (21.1) 88 (21.5) 0.776
Child’s characteristics
Sex, % 412 (50.2) 409 (49.8)
Birthweight (g), mean (SD) 3533 (522) 3588 (503) 3477 (536) 0.002
Gestational age at birth (weeks), median (95% range) 40.3 (36.3–42.4) 40.3 (36.5–42.4) 40.3 (36.0–42.4) 0.710
Breast-feeding duration (months), mean (SD) 4.8 (3.8) 4.7 (3.7) 4.9 (3.9) 0.442
Introduction of solid foods, n (%)
<3 months 47 (5.7) 23 (5.6) 24 (5.9) 0.885
3–6 months 631 (76.9) 316 (76.7) 315 (77.0)
>6 months 143 (17.4) 73 (17.7) 70 (17.1)
TV-watching time, n (%)≥ 2 h/day 76 (9.3) 45 (10.9) 31 (7.6) 0.131
SD, standard deviation.
aValues are expressed as means (SD), medians (95% range), or numbers of subjects (%). The values represent the pooled results after
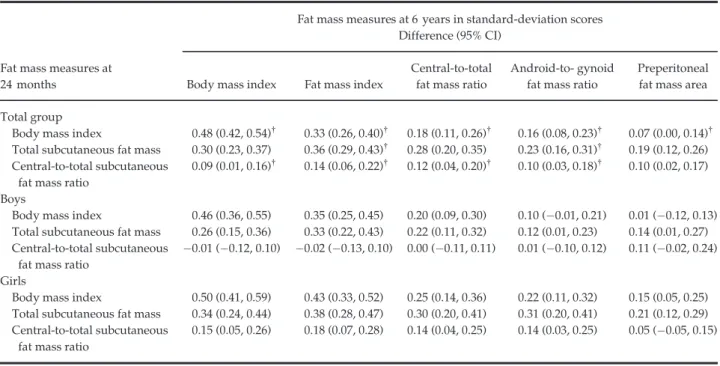
central-to-total fat mass ratio, and 0.16 (95% CI 0.08, 0.23) SDS in android-to-gynoid fat mass ratio (Table 4). A 1-SDS higher total subcutaneous fat mass at 24 months was associated with an increase of 0.30 (95% CI 0.23, 0.37) SDS in body mass index, 0.36 (95% CI 0.29, 0.43) SDS in fat mass index, 0.28 (95% CI 0.20, 0.35) SDS in central-to-total fat mass ratio, 0.23 (95% CI 0.16, 0.31) SDS in android-to-gynoid fat mass ratio, and 0.19 (95% CI 0.12, 0.26) SDS in preperitoneal fat mass area. The associations of central-to-total subcuta-neous fat mass ratio at 24 months with fat mass mea-sures at 6 years were also significant but weaker. The associations tended to be stronger among girls than among boys.
Infant body fat and risk of childhood overweight
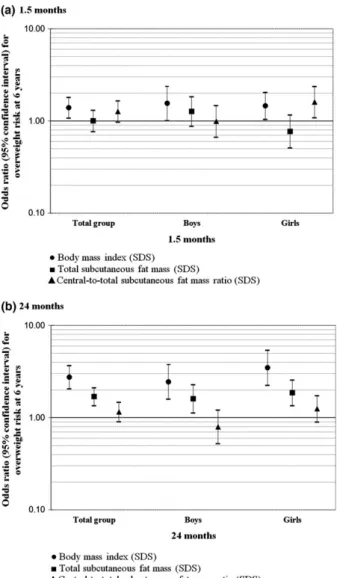
A 1-SDS higher body mass index at 1.5 months was associated with an increased odds of overweight at 6 years (OR, 1.40, 95% CI 1.08, 1.81) (Figure 1),
whereas a 1-SDS higher central-to-total subcutaneous fat mass ratio at 1.5 months was associated with an increased odds of overweight at 6 years among girls only (OR 1.61, 95% CI 1.09, 2.38). A 1-SDS higher body mass index and total subcutaneous fat mass at 24 months were associated with increased odds of childhood overweight (OR 2.76, 95% CI 2.07, 3.69) and OR 1.70, 95% CI 1.36, 2.12 respectively). We did not observe associations for central-to-total subcutaneous fat mass ratio at 24 months with the risk of childhood overweight. Stronger associations were present among girls than among boys.
Comment
We observed that infant subcutaneous fat mass mea-sures, calculated from skinfold thickness, are associated with total and abdominal fat mass at school-age. The effect estimates were stronger for body mass index and total subcutaneous fat mass than for central-to-total Table 3. Associations of subcutaneous fat mass measures at 1.5 months with total and abdominal fat mass at 6 years olda–c
Fat mass measures at 1.5 months
Fat mass measures at 6 years in standard-deviation scores Difference (95% CI)
Body mass index Fat mass index
Central-to-total fat mass ratio
Android-to- gynoid fat mass ratio
Preperitoneal fat mass area Total group
Body mass index 0.16 (0.09, 0.24) 0.05 ( 0.03, 0.12) 0.03 ( 0.11, 0.05) 0.04 ( 0.04, 0.12) 0.05 ( 0.03, 0.13) Total subcutaneous fat mass 0.06 ( 0.02, 0.13) 0.05 ( 0.02, 0.13) 0.01 ( 0.07, 0.09) 0.01 ( 0.07, 0.09) 0.05 ( 0.02, 0.12) Central-to-total subcutaneous
fat mass ratio
0.04 ( 0.02, 0.12) 0.12 (0.05, 0.19) 0.11 (0.04, 0.18) 0.07 (0.00, 0.14) 0.07 ( 0.01, 0.14) Boys
Body mass index 0.25 (0.14, 0.36) 0.21 (0.09, 0.33) 0.10 ( 0.02, 0.22) 0.13 (0.02, 0.25) 0.20 (0.07, 0.33) Total subcutaneous fat mass 0.12 (0.01, 0.23) 0.07 ( 0.04, 0.19) 0.09 ( 0.03, 0.20) 0.03 ( 0.08, 0.14) 0.14 (0.02, 0.26) Central-to-total subcutaneous
fat mass ratio
0.03 ( 0.08, 0.13) 0.07 ( 0.03, 0.18) 0.06 ( 0.05, 0.16) 0.07 ( 0.04, 0.17) 0.01 ( 0.11, 0.13) Girls
Body mass index 0.08 ( 0.02, 0.18) 0.02 ( 0.08, 0.12) 0.06 ( 0.16, 0.05) 0.03 ( 0.14, 0.08) 0.02 ( 0.09, 0.12) Total subcutaneous fat mass 0.01 ( 0.11, 0.09) 0.01 ( 0.10, 0.11) 0.08 ( 0.19, 0.03) 0.02 ( 0.13, 0.09) 0.03 ( 0.13, 0.06) Central-to-total subcutaneous
fat mass ratio
0.08 ( 0.01, 0.18) 0.10 (0.01, 0.20) 0.09 ( 0.01, 0.19) 0.06 ( 0.04, 0.17) 0.06 ( 0.03, 0.16)
a
Values are standardised regression coefficients (95% CI) and represent the difference in standard-deviation scores for fat mass mea-sures at 6 years per 1-standard-deviation scores increase in body mass index and subcutaneous fat mass meamea-sures at 1.5 months. Body mass index= weight/height2. Total subcutaneous fat mass= biceps + triceps + suprailiacal + subscapular skinfold thicknesses. Central-to-total subcutaneous fat mass ratio= (suprailiacal + subscapular skinfold thicknesses)/total subcutaneous fat mass. Fat mass index= total fat mass/height3. Central-to-total fat mass ratio= trunk fat mass/total fat mass. Android-to-gynoid fat mass ratio =
an-droid fat mass/gynoid fat mass.
bModels are adjusted for maternal age, educational level, parity, pre-pregnancy body mass index, smoking habits during pregnancy,
and child’s gestational age-adjusted birthweight standard-deviation scores, breast-feeding duration, timing of introduction of solid foods, and TV watching time.
c
subcutaneous fat mass ratio, and for girls compared with boys. Also, the effect estimates were stronger for 24 months than for 1.5 months fat mass measures.
Interpretation of main
findings
Body mass index tends to track from infancy onwards. A previous review among 21 studies has shown that large body size (weight or body mass index) in 0- to 4-year-old children was related to large body size at primary school age.24A meta-regression analysis among 48 cohort studies has shown a high degree of tracking for body mass index among chil-dren until 10 years of age. The tracking estimates gradually decreased over follow-up time and were not influenced by body mass index at first measure-ment or sex.25In our study, we observed a moderate tracking of body mass index from infancy to child-hood. Stronger associations were observed from 24 months onwards than from 1.5 months onwards,
in line with the stronger tracking reported in the meta-regression for shorter follow-up periods. We did not observe differences in results when we used pon-deral index (weight/height3) at 1.5 months (data not shown). We observed slightly stronger effect esti-mates among girls compared with boys.
Body mass index provides limited information about body fat distribution. Android-to-gynoid fat mass ratio as well as preperitoneal fat mass have pre-viously been associated with an adverse cardiovascu-lar risk profile in childhood and adulthood, independently of body mass index.26,27Previous stud-ies have suggested that total and central fat mass track moderately from childhood into adulthood,7–10,28–30 although with a lower tracking as compared with body mass index. Since we used different body fat mass measures in infancy and at school-age, we could not directly estimate tracking coefficients. However, we observed that total subcutaneous fat mass at 24 months was positively associated with fat mass Table 4. Associations of subcutaneous fat mass measures at 24 months with total and abdominal fat mass at 6 years olda,b
Fat mass measures at 24 months
Fat mass measures at 6 years in standard-deviation scores Difference (95% CI)
Body mass index Fat mass index
Central-to-total fat mass ratio
Android-to- gynoid fat mass ratio
Preperitoneal fat mass area Total group
Body mass index 0.48 (0.42, 0.54)† 0.33 (0.26, 0.40)† 0.18 (0.11, 0.26)† 0.16 (0.08, 0.23)† 0.07 (0.00, 0.14)† Total subcutaneous fat mass 0.30 (0.23, 0.37) 0.36 (0.29, 0.43)† 0.28 (0.20, 0.35) 0.23 (0.16, 0.31)† 0.19 (0.12, 0.26) Central-to-total subcutaneous
fat mass ratio
0.09 (0.01, 0.16)† 0.14 (0.06, 0.22)† 0.12 (0.04, 0.20)† 0.10 (0.03, 0.18)† 0.10 (0.02, 0.17) Boys
Body mass index 0.46 (0.36, 0.55) 0.35 (0.25, 0.45) 0.20 (0.09, 0.30) 0.10 ( 0.01, 0.21) 0.01 ( 0.12, 0.13) Total subcutaneous fat mass 0.26 (0.15, 0.36) 0.33 (0.22, 0.43) 0.22 (0.11, 0.32) 0.12 (0.01, 0.23) 0.14 (0.01, 0.27) Central-to-total subcutaneous
fat mass ratio
0.01 ( 0.12, 0.10) 0.02 ( 0.13, 0.10) 0.00 ( 0.11, 0.11) 0.01 ( 0.10, 0.12) 0.11 ( 0.02, 0.24) Girls
Body mass index 0.50 (0.41, 0.59) 0.43 (0.33, 0.52) 0.25 (0.14, 0.36) 0.22 (0.11, 0.32) 0.15 (0.05, 0.25) Total subcutaneous fat mass 0.34 (0.24, 0.44) 0.38 (0.28, 0.47) 0.30 (0.20, 0.41) 0.31 (0.20, 0.41) 0.21 (0.12, 0.29) Central-to-total subcutaneous
fat mass ratio
0.15 (0.05, 0.26) 0.18 (0.07, 0.28) 0.14 (0.04, 0.25) 0.14 (0.03, 0.25) 0.05 ( 0.05, 0.15)
a
Values are standardised regression coefficients (95% CI) and represent the difference in standard-deviation scores for fat mass mea-sures at 6 years per 1-standard-deviation scores increase in body mass index and subcutaneous fat mass meamea-sures at 24 months. Body mass index= weight/height2. Total subcutaneous fat mass= biceps + triceps + suprailiacal + subscapular skinfold thicknesses. Central-to-total subcutaneous fat mass ratio= (suprailiacal + subscapular skinfold thicknesses)/total subcutaneous fat mass. Fat mass index= total fat mass/height3. Central-to-total fat mass ratio= trunk fat mass/total fat mass. Android-to-gynoid fat mass ratio =
an-droid fat mass/gynoid fat mass.
bModels are adjusted for maternal age, educational level, parity, pre-pregnancy body mass index, smoking habits during pregnancy,
and child’s gestational age-adjusted birthweight standard-deviation scores, breast-feeding duration, timing of introduction of solid foods, and TV watching time.
†
index at school-age, suggesting tracking of total fat mass from infancy into school-age. Higher total and central-to-total subcutaneous fat mass ratio in infancy
were associated with higher central-to-total and android-to-gynoid fat mass ratios measured by DXA and preperitoneal fat mass area measured by abdomi-nal ultrasound at 6 years old. Our results suggest that besides higher body mass index, higher total subcuta-neous fat mass, and central-to-total subcutasubcuta-neous fat mass ratio in infancy relate to an adverse body fat pro-file at school-age.
We observed stronger effect estimates for infant total subcutaneous fat mass than for central-to-total subcuta-neous fat mass ratio, in the associations with similar measures at school-age, although both showed weaker effect estimates compared with the tracking of body mass index from infancy to childhood. The latter may be explained by the differences in methodology to assess the fat mass components in infancy and child-hood. In infancy, skinfold thickness measurements reflect the subcutaneous depots only, whereas in child-hood DXA comprise both subcutaneous and intra-abdominal depots.11 However, during the first 4 months of life, approximately 90% of body fat is located subcutaneously,31 and preperitoneal fat mass seems to increase only from the second year of life onwards.32 Finally, skinfold thickness measurements may be more liable to measurement error than body mass index,33,34which may also lead to an underestima-tion of the effect estimates for subcutaneous fat mea-sures from infancy onwards. We also observed stronger effect estimates among girls than boys. Sex-specific adi-posity differences have been attributed to sex hor-mones. During infancy, testosterone concentrations increase during the first week of life before decreasing around 6 months of life among boys, whereas oestro-gen increases shortly after birth and remains raised until 2–3 years among girls.35The stronger associations that we observed among girls may be partly a result of a more stable body fat development during infancy dri-ven by less hormonal fluctuations. Further studies are needed to explore the mechanisms underlying the observed sex differences in body fat development. The stronger associations observed for 24 months than for 1.5 months could be due to the shorter interval between 24 months and 6 years old, as previously reported for body mass index.25 Also, 1.5 months might be more reflective of fetal growth patterns which seemed to be less associated, as compared with postnatal growth, with later abdominal adiposity in our previous study.5
Whether skinfold thickness measurements during infancy are useful in clinical practice is not known. Our results suggest that compared with body mass Figure 1. Associations of subcutaneous fat mass measures at 1.5
or 24 months with risk of overweight at 6 years old. Values are odds ratios (95% CI) on a logarithmic scale and represent the risk of overweight at 6 years per 1-standard-deviation scores increase in body mass index and subcutaneous fat mass measures at 1.5 or 24 months. Body mass index= weight/height2. Total subcuta-neous fat mass= biceps + triceps + suprailiacal + subscapular skinfold thicknesses. Central-to-total subcutaneous fat mass ratio= (suprailiacal + subscapular skinfold thicknesses)/total subcutaneous fat mass. SDS, standard-deviation scores. Models are adjusted for maternal age, educational level, parity, pre-preg-nancy body mass index, smoking habits during pregpre-preg-nancy, and child’s gestational age-adjusted birthweight standard-deviation scores, breast-feeding duration, timing of introduction of solid foods, and TV watching time. P-value for interaction of child’s sex with total subcutaneous fat mass and central-to-total subcuta-neous fat mass ratio at 1.5 months≤0.05. P-value for interaction of child’s sex with body mass index at 24 months <0.05.
index, subcutaneous fat mass measures in infancy add little value to estimate total or abdominal fat mass at school-age. Given the challenges of obtaining pre-cise and reliable skinfold thickness measurements, the additional clinical value of skinfold thicknesses com-pared with body mass index may be only limited.
Methodological considerations
Major strengths of this study are the population-based prospective design with detailed infant and childhood body fat measurements available. Of the 965 singleton children with information on body fat mass measures at the age of 1.5 or 24 months, 85% (821) participated in the adiposity follow-up study at 6 years old. The non-response could lead to biased effect estimates if the associations of interest would differ between children included and not included in the analyses. Children included in the analyses were born with a higher weight and gestational age and were breastfed for a longer period compared with those not included. It is difficult to speculate if these differences might have influenced our effect estimates. However, this seems unlikely since children that did not participate in the follow-up studies did not differ from those who did participate regarding infant body mass index and subcutaneous fat mass measures. Our sample was eth-nically homogeneous, which may limit the generalis-ability of our results to other ethnic groups.25We used skinfold thickness which is a valid measurement of sub-cutaneous fat in children, but in extremely overweight children the measurement error is larger.15 The inter-and intra-observer measurement error is also larger as compared with other anthropometric measure-ments.33,34We did not have available skinfold thickness measurements from the lower limbs, such as thigh or calf, which could have improved our estimates of sub-cutaneous fat mass. We obtained detailed measures of adiposity at school-age using DXA that quantifies body fat content with high precision and abdominal ultra-sound which is a valid method to assess abdominal preperitoneal fat mass area.23 Finally, although we adjusted for a large number of potential confounders, residual confounding in the observed associations might still occur, as in any observational study.
Conclusion
Subcutaneous fat mass measures in infancy are posi-tively associated with total and abdominal fat mass at
school-age. The effect estimates were stronger for body mass index and total subcutaneous fat mass than for central-to-total subcutaneous fat mass ratio, and for girls compared with boys. Our results suggest that skinfold thickness measurements in infancy add little value to estimate body fat in later childhood, as compared with body mass index.
Acknowledgements
We gratefully acknowledge the contribution of gen-eral practitioners, hospitals, midwives, and pharma-cies in Rotterdam.
Conflict of interest statement: No conflict of interest was declared.
Funding
The Generation R Study is made possible by finan-cial support from Erasmus MC, University Medical Center, Rotterdam, Erasmus University Rotterdam, Netherlands Organization for Health Research and Development (ZonMw), Netherlands Organisation for Scientific Research (NWO), Ministry of Health, Welfare and Sport and Ministry of Youth and Fami-lies. Research leading to these results has received funding from an unrestricted grant from Nutricia Research and the European Union’s Seventh Frame-work Programme (FP7/2007-2013), project Early-Nutrition under grant agreement n° 289346. SS received a grant from the Portuguese Foundation for Science and Technology (SFRH/BD/81123/ 2011). VJ received an additional grant from the Netherlands Organization for Health Research and Development (VIDI 016.136.361) and Consolidator Grant from the European Research Council (ERC-2014-CoG-648916).
References
1 Gillman MW. The first months of life: a critical period for development of obesity. The American Journal of Clinical Nutrition 2008; 87:1587–1589.
2 McCarthy A, Hughes R, Tilling K, Davies D, Smith GD, Ben-Shlomo Y. Birth weight; postnatal, infant, and childhood growth; and obesity in young adulthood: evidence from the Barry Caerphilly Growth Study. The American Journal of Clinical Nutrition 2007; 86:907–913.
3 Taal HR, Vd Heijden AJ, Steegers EA, Hofman A, Jaddoe VW. Small and large size for gestational age at birth, infant growth, and childhood overweight. Obesity (Silver Spring) 2013;21: 1261–1268.
4 Gishti O, Gaillard R, Manniesing R, Abrahamse-Berkeveld M, van der Beek EM, Heppe DH, et al. Fetal and infant growth patterns associated with total and abdominal fat distribution in school-age children. The Journal of Clinical Endocrinology and Metabolism 2014; 99:2557–2566.
5 Durmus B, Mook-Kanamori DO, Holzhauer S, Hofman A, van der Beek EM, Boehm G, et al. Growth in foetal life and infancy is associated with abdominal adiposity at the age of 2 years: the generation R study. Clinical Endocrinology 2010; 72:633–640.
6 Despres JP. Body fat distribution and risk of cardiovascular disease: an update. Circulation 2012; 126:1301–1313. 7 Chrzanowska M, Suder A, Kruszelnicki P. Tracking and risk
of abdominal obesity in the adolescence period in children aged 7–15. The Cracow Longitudinal Growth Study. American Journal of Human Biology 2012; 24:62–67. 8 Freitas D, Beunen G, Maia J, Claessens A, Thomis M,
Marques A, et al. Tracking of fatness during childhood, adolescence and young adulthood: a 7-year follow-up study in Madeira Island, Portugal. Annals of Human Biology 2012; 39:59–67.
9 Monyeki KD, Kemper HC, Makgae PJ. Development and tracking of central patterns of subcutaneous fat of rural South African youth: Ellisras longitudinal study. BMC Pediatrics 2009; 9:74.
10 Psarra G, Nassis GP, Sidossis LS. Short-term predictors of abdominal obesity in children. European Journal of Public Health 2006; 16:520–525.
11 Wells JC, Fewtrell MS. Measuring body composition. Archives of Disease in Childhood 2006; 91:612–617.
12 Ay L, Hokken-Koelega AC, Mook-Kanamori DO, Hofman A, Moll HA, Mackenbach JP, et al. Tracking and determinants of subcutaneous fat mass in early childhood: the Generation R Study. International Journal of Obesity (Lond) 2008; 32: 1050–1059.
13 Jaddoe VW, van Duijn CM, Franco OH, van der Heijden AJ, van Iizendoorn MH, de Jongste JC, et al. The Generation R Study: design and cohort update 2012. European Journal of Epidemiology 2012; 27:739–756.
14 Ketel IJ, Volman MN, Seidell JC, Stehouwer CD, Twisk JW, Lambalk CB. Superiority of skinfold measurements and waist over waist-to-hip ratio for determination of body fat distribution in a population-based cohort of Caucasian Dutch adults. European Journal of Endocrinology 2007; 156:655–661. 15 Freedman DS, Wang J, Ogden CL, Thornton JC, Mei Z,
Pierson RN, et al. The prediction of body fatness by BMI and skinfold thicknesses among children and adolescents. Annals of Human Biology 2007; 34:183–194.
16 Wells JC, Cole TJ. ALSPAC study team. Adjustment of fat-free mass and fat mass for height in children aged 8 y. International Journal of Obesity and Related Metabolic Disorders 2002; 26:947–952.
17 Cole TJ, Bellizzi MC, Flegal KM, Dietz WH. Establishing a standard definition for child overweight and obesity worldwide: international survey. BMJ 2000; 320:1240–1243. 18 Kaul S, Rothney MP, Peters DM, Wacker WK, Davis CE,
Shapiro MD, et al. Dual-energy X-ray absorptiometry for quantification of visceral fat. Obesity (Silver Spring) 2012; 20:1313–1318.
19 Shuster A, Patlas M, Pinthus JH, Mourtzakis M. The clinical importance of visceral adiposity: a critical review of methods for visceral adipose tissue analysis. The Bristish Journal of Radiology 2012; 85:1–10.
20 Helba M, Binkovitz LA. Pediatric body composition analysis with dual-energy X-ray absorptiometry. Pediatric Radiology 2009; 39:647–656.
21 VanItallie TB, Yang MU, Heymsfield SB, Funk RC,
Boileau RA. Height-normalized indices of the body’s fat-free mass and fat mass: potentially useful indicators of
nutritional status. The American Journal of Clinical Nutrition 1990; 52:953–959.
22 Mook-Kanamori DO, Holzhauer S, Hollestein LM, Durmus B, Manniesing R, Koek M, et al. Abdominal fat in children measured by ultrasound and computed tomography. Ultrasound in Medicine and Biology 2009; 35:1938–1946. 23 Suzuki R, Watanabe S, Hirai Y, Akiyama K, Nishide T,
Matsushima Y, et al. Abdominal wall fat index, estimated by ultrasonography, for assessment of the ratio of visceral fat to subcutaneous fat in the abdomen. The American Journal of Medicine 1993; 95:309–314.
24 Stocks T, Renders CM, Bulk-Bunschoten AM, Hirasing RA, van Buuren S, Seidell JC. Body size and growth in 0- to 4-year-old children and the relation to body size in primary school age. Obesity Reviews 2011; 12:637–652.
25 Bayer O, Kruger H, von Kries R, Toschke AM. Factors associated with tracking of BMI: a meta-regression analysis on BMI tracking. Obesity (Silver Spring) 2011; 19:1069–1076. 26 Fox CS, Massaro JM, Hoffmann U, Pou KM,
Maurovich-Horvat P, Liu CY, et al. Abdominal visceral and
subcutaneous adipose tissue compartments: association with metabolic risk factors in the Framingham Heart Study. Circulation 2007; 116:39–48.
27 Gishti O, Gaillard R, Durmus B, Abrahamse M, van der Beek EM, Hofman A, et al. Body mass index, total and abdominal fat distribution and cardiovascular risk factors in school-age children. Pediatric Research 2015; 77:710–718.
28 Wright CM, Emmett PM, Ness AR, Reilly JJ, Sherriff A. Tracking of obesity and body fatness through mid-childhood. Archives of Disease in Childhood 2010; 95:612–617. 29 Toselli S, Brasili P, Di Michele R. Tracking of weight status
and body fatness in Italian children. Eating and Weight Disorders 2013; 18:383–388.
30 Vink EE, van Coeverden SC, van Mil EG, Felius BA, van Leerdam FJ, Delemarre-van de Waal HA. Changes and tracking of fat mass in pubertal girls. Obesity (Silver Spring) 2010;18:1247–1251.
31 Olhager E, Flinke E, Hannerstad U, Forsum E. Studies on human body composition during the first 4 months of life using magnetic resonance imaging and isotope dilution. Pediatric Research 2003; 54:906–912.
32 Holzhauer S, Zwijsen RM, Jaddoe VW, Boehm G, Moll HA, Mulder PG, et al. Sonographic assessment of abdominal fat distribution in infancy. European Journal of Epidemiology 2009; 24:521–529.
33 WHO Multicentre Growth Reference Study Group. Reliability of anthropometric measurements in the WHO Multicentre Growth Reference Study. Acta Paediatrica Supplement 2006; 450:38–46.
34 Moreno LA, Joyanes M, Mesana MI, Gonzalez-Gross M, Gil CM, Sarria A, et al. Harmonization of anthropometric measurements for a multicenter nutrition survey in Spanish adolescents. Nutrition 2003; 19:481–486.
35 Grumbach MM. A window of opportunity: the diagnosis of gonadotropin deficiency in the male infant. The Journal of Clinical Endocrinology and Metabolism 2005; 90:3122–3127.
Supporting Information
Additional Supporting Information may be found in the online version of this article at the publisher’s web-site:
Figure S1.Flow chart of participants in study. Data S1.Log–log regression analyses.
Table S1.Characteristics of study participants. Table S2.Subcutaneous fat mass (mm).
Table S3.Comparison of maternal and child’s charac-teristics between children included and not included in the analyses.
Table S4. Correlation coefficients between body fat mass measures at 1.5 months and 6 years old.
Table S5. Correlation coefficients between body fat mass measures at 24 months and 6 years old.