CAN GEOCACHING BE AN INDICATOR OF CULTURAL ECOSYSTEM
1SERVICES? THE CASE OF THE MONTADO SAVANNAH-LIKE
2LANDSCAPE
3ACCEPTED VERSION
4
Received 19 April 2018; Received in revised form 27 November 2018; Accepted 1 December 5
2018, Available online 9 January 2019. 6
Final version - https://doi.org/10.1016/j.ecolind.2018.12.003 7
Inês T. Rosário* 8
e-mail address: itrosario@fc.ul.pt
9
cE3c – Centre for Ecology, Evolution and Environmental Changes, Faculdade de Ciências da Universidade de Lisboa, Campo 10
Grande, 1749-016 Lisboa - Portugal 11
12
Rui Rebelo 13
e-mail address: rmrebelo@fc.ul.pt
14
cE3c – Centre for Ecology, Evolution and Environmental Changes, Faculdade de Ciências da Universidade de Lisboa, Campo 15
Grande, 1749-016 Lisboa - Portugal 16
17
Paulo Cardoso 18
e-mail address: paulo.c@bioinsight.pt
19
Bioinsight Lda. Rua Antero de Quental 52-B 2675-690, Odivelas, Lisboa - Portugal 20
21
Pedro Segurado 22
e-mail address: psegurado@isa.ulisboa.pt
23
Centro de Estudos Florestais, Instituto Superior de Agronomia, Universidade de Lisboa, Tapada da Ajuda 1349-017 Lisboa, 24 Portugal 25 26 Ricardo Mendes 27
e-mail address: rnmendes@fcsh.unl.pt
28
Centro Interdisciplinar de Ciências Sociais CICS.NOVA - Faculdade de Ciências Sociais e Humanas - Universidade Nova de Lisboa 29
(CICS.NOVA.FCSH/UNL) Avenida de Berna, 26 C, 1069-061, Lisboa, Portugal 30
31
Margarida Santos-Reis 32
e-mail address: mmreis@fc.ul.pt
33
cE3c – Centre for Ecology, Evolution and Environmental Changes, Faculdade de Ciências da Universidade de Lisboa, Campo 34
Grande, 1749-016 Lisboa - Portugal 35 *Corresponding author. 36 37 KEYWORDS: 38
Crowdsourcing databases, land use, spatial analysis, stated and revealed preferences, Iberian 39
Peninsula 40
41
Highlights: Please see also the attached file.
42
Geocachers did not show a priori preferences for different types of land use
43
After the visit, their stated preferences exposed the appreciation of the montado cultural landscape over
44
other forest landscapes; they also expressed preferences for open and aquatic landscapes
45
Geocaching is a good indicator for cultural ecosystem services
46
Montado landowners can diversify activities on their properties, decreasing their dependence of 47 provisioning services 48 49 50 51 52
Abstract
53Cultural Ecosystem Services (CES) are difficult to assess and are seldom considered by land 54
managers. Geocaching, an outdoor game that uses Global Positioning System (GPS) enabled 55
devices to find hidden containers (geocaches) in certain locations, has been seldom used as a 56
data source to assess CES. However, contrary to other crowdsourcing databases, geocaching 57
allows to associate particular experiences to accurate locations. Furthermore, databases 58
generated by geocachers provide an ideal case to compare revealed preferences (the frequency 59
of visits to a specific geocache) with stated preferences (a posteriori evaluation of each location). 60
We tested the relevance of geocaching databases as CES indicators using a dataset of 50 818 61
geocaches spread across continental Portugal, over eight land-use classes, with a focus on the 62
montado (a high nature value farmland found in Southwestern Iberian Peninsula). We found that
63
site visitation frequency was related with its availability, showing no revealed preference towards 64
any land use. However, site evaluations by geocachers, measured either through the number 65
of words describing the experience, the number of photos taken, or the number of votes for 66
“favourite geocaches”, showed marked differences in their stated preferences, with higher 67
appreciation for open land uses in general, and montado in particular, especially when 68
compared to other forested landscapes. Our results may contribute to the design of regional 69
development and land-use management policies of this threatened landscape, since they show 70
the system’s strong potential as CES provider and, consequently, promoter of diversification of 71 activities. 72 73
1. Introduction
74Cultural Ecosystem Services (CES) are defined as “the nonmaterial benefits people obtain from 75
ecosystems through spiritual enrichment, cognitive development, reflection, recreation, and 76
aesthetic experiences” (Millennium Ecosystem Assessment, 2005). This kind of interaction 77
between people and nature implies an emotional connection and the creation of strong ties with 78
the landscapes, nourishing the feeling of being “at home” (Schaich et al., 2010). The value of 79
CES among all Ecosystem Services (ES) is high, either in more industrialized societies, where 80
CES have an expected tendency to increase in importance, or in more traditional communities, 81
where they are often essential for cultural identity and even survival (Milcu et al., 2013). For 82
people in developed countries CES represent one of the strongest incentives to become 83
involved in environmental conservation (Phillips, 1998), and this tendency is also becoming 84
more noticeable in less developed regions (Sodhi et al., 2010). 85
CES are nowadays considered a fundamental component of the ES frameworks, often 86
influencing more the acquisition and management of the land than traditional commodity 87
production (Bieling, 2004; Plieninger et al., 2012). On the other hand, CES have less potential 88
for mediation by socioeconomic factors, as compared to other ES, which means that, once 89
degraded they are unlikely to be replaced by technical or other means (MA, 2005). 90
Cultural landscapes are defined as “landscapes with a long history, which evolved slowly and 91
where it took centuries to form a characteristic structure reflecting a harmonious integration of 92
abiotic, biotic and cultural elements” (Antrop, 1997). These landscapes have the peculiarity of 93
having an added value, as compared to more “natural” habitats, since besides the natural value, 94
they hold cultural value, due to the long and complex history of coexistence with man (Schaich 95
et al., 2010). However, cultural landscapes are undergoing rapid transformations across the 96
world, driven by abandonment and rural exodus on the one hand, and intensification of human 97
use on the other (Plieninger et al., 2014). 98
The Portuguese montado is a cultural landscape subject to the same type of rapid 99
transformation, affected by several threats and drivers of change, such as abandonment 100
(Bugalho et al., 2011; Godinho et al., 2016), tree mortality (Costa et al., 2010) overgrazing 101
(Almeida et al., 2015; Gonçalves et al., 2012), mechanised ploughing (Pinto-Correia, Ribeiro, & 102
Sá-Sousa, 2011) or climate change (Correia et al., 2018; López-Tirado et al., 2018; Ogaya and 103
Peñuelas, 2006; Vessella et al., 2017). 104 105 106 107 108 109
Montados are agro-silvo-pastoral systems that resulted from millennia of traditional land use
110
practices on the original Mediterranean woods dominated by cork oaks (Quercus suber) and 111
holm oaks (Quercus ilex or Q. rotundifolia) (Joffre et al., 1988, 1999). These man-modelled 112
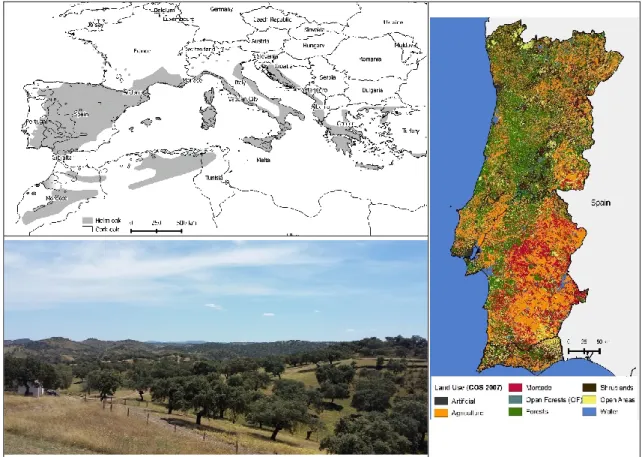
ecosystems have a savannah-like aspect (Figure 1) and are characterized by scattered trees, 113
with herbaceous understory and near absence of the shrub layer (Joffre et al., 1999). 114
Figure 1 – Up left) distribution of Mediterranean oaks (cork oak and holm oak) adapted from Caudullo et al., 2017; bottom 115
left) Montado landscape in southeast Portugal (Herdade da Coitadinha); right) land use map of mainland Portugal (COS – 116
Carta de Uso e Ocupação do Solo- 2007 reclassified to 8 land use classes). 117
118
On montados, three main rural activities are pursued simultaneously within a single space: 119
harvesting of forest products, livestock husbandry, and agriculture (Blondel, 2006). The largest 120
cork-oak montado area in the world is found in southern Portugal (Alentejo region, a district 121
inherently linked to montado landscape), where about 90% of the Portuguese distribution of this 122
system is located (Figure 1). Portuguese holm oak montados are also more frequent in the 123
Alentejo region and continue into Spain (where they are called dehesas), being part of the 124
largest holm oak montado landscape in the world (Ribeiro et al., 2010). Although created and 125
permanently managed by man, this ecosystem maintains high biodiversity levels (Blondel, 2006; 126
Bugalho et al., 2011; Carrete and Donazar, 2005; Díaz-Villa et al., 2003; Martins da Silva et al., 127
2008; Pereira, 2012; Tellería, 2001), and is considered a priority habitat for conservation (Annex 128
I of the European Union Habitats Directive 92/43/CEE) and a High Nature Value Farmland 129
(HNVF) (EEA, 2004). 130
This multi-use system is responsible for the delivery of many ES, such as, among the regulation 131
and maintenance ES, the protection of soil against erosion by vegetation, or climate regulation 132
(Barredo et al., 2015; Guerra et al., 2016). The most recognised ES is a provision ES, namely 133
the production of cork, an important revenue for Portugal, representing 1.2% of Portuguese 134
exports (APCOR, 2016). Other relevant provisioning services are food products from Alentejo, 135
which lead the Portuguese DOP (Protected Designation of Origin) markets (Tibério and 136
Francisco, 2012). Traditional products include a variety of sheep or goat cheeses, and especially 137
the ham or sausages made from the meat of free-ranging Iberian pigs fed on holm oak acorns. 138
Besides its important market value, these products have an additional cultural value, as the clear 139
connection with the landscape provides them a regional identity. Picking up asparagus or 140
mushrooms (picked up for food by local people for centuries) are also examples of activities that 141
nowadays represent more cultural services than provisioning ones (Molina et al., 2012). Other 142
leisure activities emerged more recently through well-established events associated to this 143
landscape, e.g. the running trail “Montado Running” or the mountain biking “BTT Terras do 144
Montado”. Even the harvesting of the bark of the cork oak tree has a cultural value, since it is a
145
traditional hand-made activity, carried by specialised workers using only a small axe, and 146
transmitted across generations (APCOR, n.d.). People also identify this landscape with 147
traditional music (“Cante Alentejano" was classified as Intangible Cultural Heritage of Humanity 148
in 2014), traditional clothes and language (very strong and peculiar regional accent). Finally, the 149
intrinsic natural characteristics of montado potentiates the delivery of CES similar to other 150
natural areas, namely nature-based recreation such as hunting, fishing, birdwatching or 151
geocaching (Belo et al., 2009). 152
Measuring CES has been one of the most difficult and least accomplished tasks in ES research 153
(Millennium Ecosystem Assessment, 2005), up to today (Daniel et al., 2012; Yoshimura and 154
Hiura, 2017). The intangibility of these services is often considered the reason for their poor 155
appraisal (Hernández-Morcillo et al., 2013; Schaich et al., 2010), and CES are seldom integrated 156
in management plans and reflected in economic indicators (Milcu et al., 2013). This 157
underrepresentation results in biased ES assessments (Hernández-Morcillo et al., 2013) and 158
management planning, preventing the integration of CES into policy measures. 159
Some researchers defend that CES cannot be split into discrete units for marginal valuation 160
(Abson and Termansen, 2011), and there are suggestions for the use of indicators attributed to 161
particular landscape characteristics which hold several CES (Norton et al., 2012; Plieninger and 162
Bieling, 2012). Participatory mapping (Fagerholm et al., 2012; Plieninger et al., 2013b; Van 163
Berkel and Verburg, 2014) or photo-based methods (Almeida et al., 2014; Oteros-Rozas et al., 164
2017) are among the methods used to define consensual indicators. More recently, 165
crowdsourcing indicators available in social networks such as Panoramio, Flickr, Facebook, 166
Twitter or Instagram, are becoming popular (Figueroa-Alfaro and Tang, 2017; Gliozzo et al., 167
2016; Tenerelli et al., 2016; Yoshimura and Hiura, 2017). These indicators are mostly estimated 168
from geotagged photographs voluntarily uploaded by users in social networks in high numbers. 169
Similarly to the social networks mentioned above, geocaching can provide visual and written 170
information through its online platforms, but studies using these data to assess CES are very 171
scarce and, to our knowledge, only related to recreational services (Cord et al., 2015; Mendes 172
et al., 2013; Santos et al., 2014, 2012). 173
Geocaching is an outdoor game where users (geocachers) use Global Positioning System 174
(GPS) enabled devices to find hidden containers, known as geocaches (or simply caches), and 175
then sign a logbook to record and share the visit with the geocacher community. According to 176
the game rules, each attempt to find a cache must also be registered (logged) on the geocache 177
web-page, on the official geocaching website, by writing the geocacher experience, uploading 178
photos, and voting on favourite caches (see methods for more information on this). The 179
availability of exact locations and additional information, comparatively to other online platforms, 180
is an opportunity to explore the feasibility of using geocachers’ logs as CES indicators, since, 181
while playing this game, geocachers can benefit from several bundles of CES, such as 182
aesthetics, bequest, recreation or inspiration for art. Motivation to find a particular geocache can 183
derive from many factors (Cord et al., 2015; O’Hara, 2008; Vartiainen and Tuunanen, 2013), 184
and not all of them are related to the landscape. However, regardless of his(her) motivations, 185
throughout the journey and culminating at the geocache, each geocacher will necessarily 186
experience the landscape; this interaction can be stated in the geocacher’s log and become a 187
source of information. 188
In this study we aim to demonstrate the usefulness of the until now largely unexplored 189
geocaching databases as CES indicators and focused our analysis on the montado cultural 190
landscape. With an innovative approach, we used both the number of visits to each geocache 191
and the amount of information stated in the logs (whether text, photos or votes) to evaluate 192
geocachers emotional connection with the different land use classes. First, to detect a potential 193
a priori drive towards a particular type of landscape, we compared the frequency of visits to
194
geocaches located in different land uses with their availability. Second, we assessed the stated 195
experience of geocachers at each land use by comparing the number of words, photos or votes 196
per log. We assumed that the time invested in writing or taking pictures (translated into number 197
of words or photos, respectively) should be proportional to the intensity of the emotion felt by 198
geocachers. Given the human preference for open landscapes that allow a view over wide areas 199
(Hartmann and Apaolaza-Ibáñez, 2010; Kaplan, 1987; Mendes et al., 2014), we hypothesized 200
that the savannah-like montado should be preferred over closed forest landscapes. We also 201
hypothesized that variables affecting the sense of vastness, such as altitude and landscape 202
heterogeneity, should be influential on the geocachers’ experience. 203
2. Materials and Methods
2042.1. Study area
205We considered mainland Portugal as our study area, covering a roughly rectangular 89.060 km2
206
area in the Western Iberian Peninsula (Figure 1). Higher altitudes occur in the north, reaching 207
1991m in Serra da Estrela, while through the south of the Tagus River flat plains are dominant. 208
Seashore extends for 850 km, alternating sandy beaches with cliffs. Southern regions are 209
subject to Mediterranean climate, while the north has Atlantic influences (Ferreira, 2000). Mean 210
annual temperature is very mild and ranges from 7.5 ºC to 17.5 ºC (Ferreira, 2000) and the 211
annual solar radiation reaches one of the highest levels in Europe (Joint Research Centre, n.d.). 212
These topographic and climate characteristics are an invitation to outdoor activities (Santos et 213
al., 2012). As in most Europe and particularly in the last two decades, the demand for outdoor 214
activities and leisure in Portugal shows a growing trend (Roque et al., 2014; Serôdio, 2012), and 215
geocaching is no exception. When this study was conducted circa 35000 geocaches were active 216
in Portugal (“Geopt.org - Portugal Geocaching and Adventure Portal,” n.d.). 217
2.2. Geocaching data
218When finding a geocache, in addition to sign in the logbook hidden in the container, geocachers 219
also can log in the official geocaching website, where anyone can register for free. Many logs 220
simply acknowledge another “found it”, but geocachers are encouraged to share their discovery 221
by posting small texts and photos, building a strong community sense around this recreational 222
activity. Premium members can also vote for favourite caches, leading other geocachers to try 223
to find them afterwards. All geocachers have access to the official website (geocaching.com), 224
where all this information is available. 225
Geocaching data for this study was collected from www.geopt.org (one of the two Portuguese 226
geocaching forums) on November 22nd, 2016 (full dataset). To build a uniform matrix of
227
comparable data, only the traditional geocaches (see Table 1 for terminology) were kept and 228
geocaches with less than 50 logs were excluded. 229
Table 1 - Geocaching terminology relevant for the present study. 230
Term Description
Geocacher Person who does geocaching, as opposed to “muggles”, who don’t know the game Geocache(s)/caches Hidden container at a specific coordinate1, which has at minimum a logbook for
geocachers to sign. There are 18 types of geocaches. Besides the traditional geocache (see definition below), the other types can involve several locations, being the last one the real cache or, for example, a puzzle that the geocacher must solve in order to obtain the container coordinates. 1Geocaching has emerged in the year 2000 after the removal of the
international degradation of GPS signals (Selective Availability) reducing the error to 10-15 m
(http://www.gps.gov).
Owner Geocacher that creates and places a geocache on the ground for the community. Traditional cache This is the original type of geocache and the most straightforward. These geocaches
are containers at specific coordinates. The size and contents of the container may vary, but at minimum, all have a logbook. Larger containers may also contain items for trade.
Log Act of registering a visit to the geocache at the website, even if the geocache was not found. Thus, we used the number of logs as a proxy to the number of visits.
Found/not found When a geocacher logs a geocache he (she) must register if it was found or not found. Terrain (TERR) Physical effort needed to reach a geocache. Provided by the owner of the cache on a
scale from 1 (less effort) to 5 (more effort). 231
2.3. Land use data
232In order to analyse the landscape surrounding each geocache we used a land use map (COS – 233
Carta de Uso e Ocupação do Solo - 2007) of mainland Portugal (DGT – Direção Geral do
234
Território, 2011) with a minimum mapping unit of 1 ha. This map has a hierarchical classification 235
from level 1 (minimum detail) to level 5 (maximum detail), where classes of higher detail are 236
nested within less detailed classes. For this study, 8 major land use classes were considered: i) 237
Artificial, ii) Agriculture, iii) Montado, iv) Open Forests (OF), v) Forests, vi) Shrublands, vii) Open 238
Areas and viii) Water (Figure 1). Some classes are the same as the defined in level 1 of COS 239
2007, such as Artificial, while others were defined using higher levels of detail (see table in 240
Annex for detailed description of land uses). COS 2007 level 3 legend perfectly matches 241
CORINE Land Cover CLC 2006 level 3 legend, allowing the integration of COS product with the 242
European CORINE program. The same COS level 3 also matches other international mapping 243
initiatives like TBFRA 2000 (UN-ECE/FAO, 2000) and LCCS (Di Gregorio et al., 2016). For the 244
classification of montado, all the open forests (canopy cover less than 30%) and agroforests 245
including cork oaks and/or holm oaks were considered. The category “Open forests” (OF) 246
corresponds to agroforests including other species and mixes of species different from those 247
found on the montado, such as the pyrenean oak (Quercus pyrenaica) and other oaks (Quercus 248
sp.), sweet chestnuts (Castanea sativa), eucalyptus or pines. We used this category to compare 249
the preferences for montado landscapes with other structurally similar, assuming that they are 250
not recognized by Portuguese as having the same cultural value. To extract land use variables, 251
the land use vector file was converted to a raster file with a 50 m resolution using GRASS (Team, 252
2015). Although there is a temporal mismatch between landscape data (2007) and geocaching 253
data (2016), land uses did not change significantly between those years (Caetano et al., 2018). 254
Considering the 8 land use classes defined for this study, it is evident the predominance of 255
Agriculture (31%) in Portugal, followed by Forests (24%). Shrublands (14%), Open Areas (10%) 256
and Montado (9%) were less represented and some classes (Artificial, OF and Water) covered 257
less than 5% of the land (Figure 1, Table 3). 258
A 250 m buffer was created around each geocache as a spatial unit to extract land use 259
geospatial variables: i) land use (LU) at the geocache coordinate; ii) dominant land use in the 260
buffer (DLU); iii) variety (VAR), i.e., the number of land use classes in each buffer. Average 261
altitude (ALT) in each buffer was withdrawn from the 90 meter SRTM v4.1 digital terrain model 262
(Jarvis et al., 2008). To minimise spatial autocorrelation some geocaches were excluded from 263
the analysis. This was done by a hierarchical process in GIS, starting by identifying and retaining 264
the non-overlapping geocaches. Then, a grid with 1km squares was superimposed on the 265
overlapping geocaches and we selected the geocache closer to the centroid in each square. 266
Finally, we merged these to the previously retained non-overlapping caches and attained our 267
final subset. All these analysis were performed using QGIS (QGIS Development Team, 2015). 268
2.4. Data analysis and statistics
269Revealed preferences (following the definition by Cord et al. (2015)) of geocachers for each land 270
use were assessed with Pearson’s correlation coefficient by taking the number of caches 271
available on each land use and the number of logs (=visits) to these sites. A positive correlation 272
between the number of available caches and the number of logs would reveal that geocachers 273
simply make more visits to land uses where more caches are available, suggesting that the main 274
reason for the decision of the sites to visit is not related to land use. 275
Stated preferences (again following Cord et al. (2015)) were assessed using a combined 276
approach. In a first step, we considered four variables from the geocaching database expressing 277
distinct attributes of geocacher preferences (Table 2) and those described by absolute values 278
(all except Log size) were divided by the number of logs, since the number of logs can be very 279
different among caches. The comparison of these variables, after transformation, between land 280
uses was done using column charts. In a second step, a Principal Component Analysis (PCA) 281
was applied on the four variables and the first axis of the PCA was considered as the new latent 282
variable representing the stated preferences of geocachers. PCA was performed based on the 283
correlation matrix of variables using R version 3.3.2. (R Core Team, 2017). Differences in stated 284
preferences (first axis of the PCA) between land uses were tested with non-parametric tests 285
(Mann-Whitney U tests or Kruskal-Wallis, according to the number of categories), followed by 286
post-hoc tests (with Bonferroni correction), in the case of Kruskall-Wallis. These analyses were 287
performed using the software SPSS (IBM Corp., 2017). 288 289 290 291 292 293 294 295
Table 2 - Variables used to measure stated preferences. a – original range of values, b – range of values after 296
transformation. 297
We further used a Generalized Additive Model (GAM) (Hastie and Tibshirani, 1990) to 298
understand which terrain features may influence geocachers stated preferences. GAM has the 299
advantage over other methods (e.g. Generalized Linear Models), as it allows to model non-linear 300
relationships between all or some explanatory variables and the response variable. GAM was 301
estimated by a quadratic penalised likelihood approach, as implemented in the mgvc package 302
for R (Wood, 2011). Smoothed terms were based on smoothed splines. Four variables 303
potentially related with geocachers connection with the landscape were used as explanatory 304
variables: the dominant land use in each buffer (DLU), the number of land uses present in each 305
buffer (VAR), the mean altitude in each buffer (ALT) and the physical effort needed to reach a 306
geocache (TERR). These four variables were selected because were suspected to have an 307
influence on perceptions of the landscape: DLU and VAR influence preferences, ALT influences 308
the perception of the surroundings and TERR was used to test if a variable non-related to land 309
use could influence preferences. 310
The first axis of the PCA described in second step was used as the response variable. DLU is 311
a categorical variable, i.e. coded as dummy variable in the analysis, and hence it was not 312
included in the GAM as a smoothed term, i.e., only parametric coefficients were computed for 313
this variable. The montado class of the dummy variable was coded as the reference DLU, i.e. 314
when all other DLUs equals zero, so the resulting coefficients of the parametric terms refers to 315
Variable Description Range (final dataset) Transformation
Photos Average number of photos
taken at each geocache and uploaded in the official website.
0 - 1555 a
0 - 5.97 b Number of photos divided by the number of logs.
Votes Average number of votes
given by geocachers, for each cache, at the GCVote site.
GCVote is an extension for the official geocaching site that enables geocachers to rate the quality of caches. Anyone can register for free at this site and vote for any geocache. Rating scale goes from 1 (poor) to 5 (awesome).
0 – 107 a 0 – 0.338b
Number of GC votes divided by the number of logs.
Favourites Average number of
favourites by cache. For every 10 geocaches
found, premium
geocachers can choose a favourite.
0 – 567 a
0 – 0.683 b Number of favourites divided by the number of logs.
Log size Average size of the log
(length of the text written during log in, measured by the number of characters) for each cache.
this class. Because the effect of VAR, ALT and TERR can be potentially influenced by DLU, we 316
also included the interaction terms between the three variables and DLU in the model. 317 318
3. Results
3193.1. Revealed preferences
320 3.1.1. Full dataset 321The full dataset integrated 50818 geocaches, prevailing those located in Artificial (37%), 322
followed by Forests (19%), Agriculture (17%), Shrublands (12%) and Open Areas (8%). All the 323
other LU classes had less than 4% of caches each (Table 3). The number of geocaches in each 324
LU was not proportional to area covered by it, particularly in artificial areas, which have the 325
highest density of geocaches (4.34 caches/km2), while all the other LUs had less than 1
326
cache/km2.
327
The percentage of geocaches available in each LU type was very similar to the percentage of 328
logs in the correspondent LU (Table 3), also shown by a very high correlation between the 329
number of logs and number of geocaches per land use (0.98 Pearson p<0.001), showing that 330
geocachers tend to visit the caches according to their availability, regardless of the land use. 331
The differences between these two percentages are less than 3% in every land use class, with 332
the single exception of Artificial (7.8%), which is the single land use having more visits than 333
expected. Artificial was the most visited land use (44% of logs) followed by Forest (17% of logs), 334
and then by Agriculture,Shrublands, Open Areas, Water, OF and Montado, in precisely the 335
same order as for the availability of caches per land use. 336
Table 3 - Percentage of each land use class on the study area, number and percentage of logs and number, percentage 337
and density (caches/km2) of geocaches from the full dataset in each land use category. 338
Land use Area Cache density Geocaches Logs
Land use (%) (Km2) (caches/ Km2) N (%) N (%)
Artificial 5 4267 4.34 18525 37 3856168 44 Forests 24 21365 0.45 9616 19 1462276 17 Agriculture 31 27870 0.31 8624 17 1210202 14 Shrublands 14 12181 0.48 5897 12 857746 10 Open Areas 10 9214 0.45 4143 8 704786 8 Water 2 1853 0.84 1556 3 288555 3 OF 5 4425 0.41 1834 4 260024 3 Montado 9 8099 0.08 623 1 81099 1 Total 100 89274 0.57 50818 100 8720856 100 339 340
3.1.2. Final subset 341
This dataset included 11335 geocaches, mainly distributed by three LU classes: Artificial (27%), 342
Forest (22%) and Agriculture (22%). Shrublands had 12% of the geocaches (1377) and only 2% 343
(207) were in Montado (Table 4). Altogether, the remaining LU categories had 15% of the 344
geocaches. The balanced proportion of geocaches in the three main LU categories results from 345
the exclusion of spatially correlated geocaches, particularly in artificial areas, where overlap was 346
more frequent. 347
Table 4 - Number and percentage of logs and number and percentage of geocaches from the final subset by each land use 348
(LU) and dominant land use (DLU) category. 349
When considering the dominant land use (DLU) around each cache (250 m buffer) the 350
distribution of caches per class changed slightly (Table 4). Geocaches surrounded mostly by 351
Agriculture became the most frequent (32%), followed by Forests (23%), Artificial (20%), 352
Shrublands (11%) and Open Areas (6%). All the remaining DLUs were present in 8% of the 353
buffers with the Montado representing only 2% (193 caches). 354
Geocaches with Agriculture, Forests or Artificial DLU are the most visited, in similar proportions 355
(20-28%) of the logs, while the remaining land uses are visited according to the availability of 356
caches. Thus, for our final dataset, although the order of available caches per DLU changed, 357
the correlation between available geocaches and the number of logs per DLU was still very high 358
(Pearson 0.94; p<0.001). 359
3.2. Stated preferences
360The four variables considered exposed the preference of geocachers by open and vast land 361
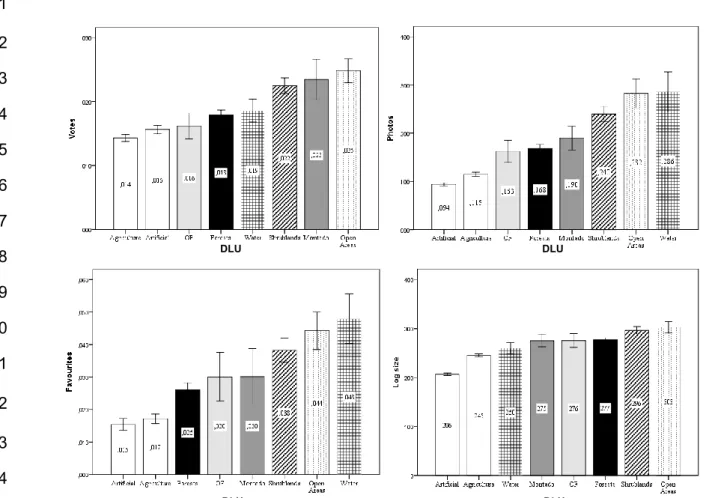
uses, particularly Open Areas, Water and Shrublands (Figure 2). More photos were taken, and 362
more favourites were chosen at Water sites while Open Areas were the land use where 363
geocachers attributed more votes and wrote longer texts. Shrublands were the second DLU 364
about which geocachers wrote longer texts and the third where they took more photos and voted 365
more both for Favourites and Votes. Considering forested land uses (Forests, Montado and 366
LU (at the geocache) DLU (for the 250m buffer)
Geocaches Logs Geocaches Logs
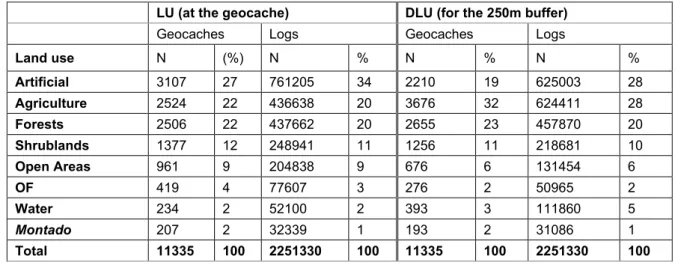
Land use N (%) N % N % N % Artificial 3107 27 761205 34 2210 19 625003 28 Agriculture 2524 22 436638 20 3676 32 624411 28 Forests 2506 22 437662 20 2655 23 457870 20 Shrublands 1377 12 248941 11 1256 11 218681 10 Open Areas 961 9 204838 9 676 6 131454 6 OF 419 4 77607 3 276 2 50965 2 Water 234 2 52100 2 393 3 111860 5 Montado 207 2 32339 1 193 2 31086 1 Total 11335 100 2251330 100 11335 100 2251330 100
Open Forests) preferences also go for more open habitats, namely for the Montado, which was 367
the second DLU most voted. Finally, a third group of DLUs includes the most human-368
transformed landscapes (Artificial and Agriculture), which were always the less preferred for any 369
of the variables considered. 370 371 372 373 374 375 376 377 378 379 380 381 382 383 384
Figure 2 – Average values (columns) in each DLU for the four variables considered to assess the stated preferences: 385
Photos, Votes, Favourites and log size. Error bars: 95% confidence interval. 386
The first PCA axis (Comp1) explained 49% of the variance and the second (Comp2) 24% (Table 387
5). 388
Table 5 - Factor loadings for Comp1 and Comp2 derived from the principal component analysis (PCA) to show revealed 389
preferences of geocacher for land uses. 390 Comp1 Comp2 Photos 0.584 -0.122 Votes 0.325 -0.861 Favourites 0.557 0.262 Log size 0.492 0.418 Eigenvalues 1.403 0.979 Variance explained (%) 49.2 24.0 Variance accumulated (%) 49.2 73.2 391 392 DLU DLU DLU DLU
The number of photos, log size and the number of favourites were the variables contributing the 393
most for Comp1. All variables had positive loadings on the first PCA component. Given this, we 394
assumed that this component can be interpreted as a stated preferences gradient with higher 395
values meaning a higher stated preference for a cache. 396
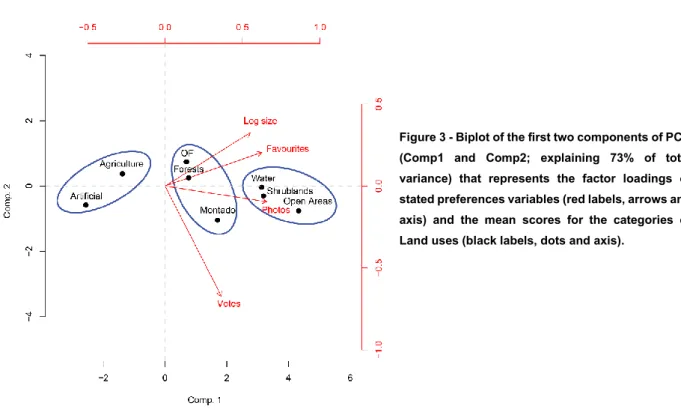
The first two PCA components are shown in Figure 3, where we also identified the three groups 397
of DLU previously suggested from the less preferred to the most preferred: i) Human-altered - 398
Artificial and Agriculture land uses, the group with lower stated preferences; ii) Forested - 399
Forests, OF and Montado, with intermediate stated preferences, and finally, iii) Open 400
landscapes (Water, Shrublands and Open Areas), with the highest stated preferences. The 401
Forested land use closer to the Open landscapes cluster is the Montado. 402
Figure 3 - Biplot of the first two components of PCA 403
(Comp1 and Comp2; explaining 73% of total 404
variance) that represents the factor loadings of 405
stated preferences variables (red labels, arrows and 406
axis) and the mean scores for the categories of 407
Land uses (black labels, dots and axis). 408
3.2.1. Forested land uses (Montado, OF, Forests) 409
Within the forested land uses significant differences were found (Kruskal-Wallis test, p<0.05) 410
when considering the new latent variable representative of the stated preferences, with Montado 411
having the highest Comp1 value (Figure 3). Post hoc tests revealed significant differences 412
between Montado and Forests (p=0.001) and between Montado and OF (p=0.030). No 413
differences were found between Forests and Open Forests. 414
3.2.2. Factors affecting the stated preferences 415
The GAM parametric coefficients reveal that, with the exception of Open Areas, geocachers 416
tend to prefer areas dominated by Montado more than any other DLU class, as shown by the 417
negative sign of the coefficients (Table 6). These differences are significant for the human-418
altered land uses, Forests and OF, but not for the open landscape uses (Water, Shrublands and 419
Open Areas). 420
421
Table 6 - Summary of GAM parametric terms (p-value interval codes: *** <0.001, ** < 0.01, * < 0.05, <0.1). 422
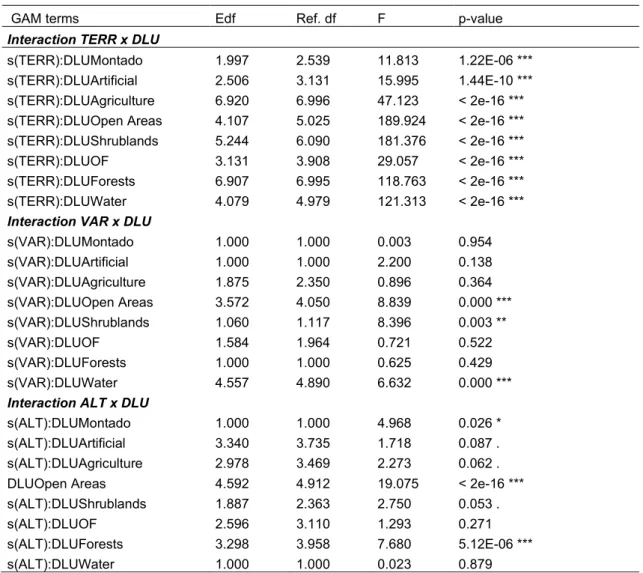
Besides DLU, stated preferences of geocachers were also influenced by ALT, TERR and VAR 423
as revealed by GAM (R2 = 0.38). Overall, geocachers preferred places more difficult to reach
424
(higher TERR values) and located at higher altitudes (Figure 4a). The influence of TERR is 425
consistent across the DLUs, as shown by the significance of smoothed terms (Table 7). The 426
influence of ALT is not as consistent, and it is not statistically significant for OF and water. The 427
influence of VAR is only statistically significant in areas dominated by open landscape uses 428
(Water, Shrublands and Open Areas); in these landscapes geocachers prefer less variety of 429
land uses (Table 7). Nevertheless, this influence is not as clear as for ALT, which means that 430
the preferences of geocachers are less strongly influenced by variety of land uses (Figure 4b). 431
432 Figure 4 – a) and b) 3-dimensional plots representing the joint effect of TERR with ALT and TERR with VAR. 433
434 435 436
GAM terms Estimate Std. Error t value p-value
(Intercept) 0.288 0.092 3.142 0.002 ** DLUArtificial -0.694 0.099 -7.008 2.56e-12 *** DLUAgriculture -0.455 0.094 -4.831 1.38e-06 *** DLUOpen Areas 0.030 0.105 0.289 0.772 DLUShrublands -0.095 0.100 -0.948 0.343 DLUOF -0.242 0.123 -1.969 0.049 * DLUForests -0.265 0.095 -2.806 0.005 ** DLUWater -0.041 0.142 -0.287 0.774 a) b)
Table 7 - -– Summary of GAM smoothed terms and their approximate significance (edf - estimated degrees of freedom; 437
Ref. df - degrees of freedom for reference distributions; F – F-statistics; p-value interval codes: *** <0.001, ** < 0.01, * < 438
0.05, . <0.1). 439
4. Discussion
440Our results indicate that overall there is no preference for any land use when geocachers plan 441
their visit, suggesting that playing the game is their main motivation. However, stated 442
preferences show that geocachers appreciate more open land uses, exposing the potential of 443
these crowdsourcing data as CES indicators. 444
4.1. Revealed vs stated preferences
445Geocache owners hid them in every land use, with the highest density in Artificial areas and in 446
regions with higher population densities. A relation between cache density and urban areas has 447
already been shown, although with preference for green spaces (Cord et al., 2015; Santos et 448
al., 2012). Probably, as in other countries, owners place caches near their residence, although 449
choosing places with elements that can attract geocachers (Cord et al., 2015). 450
The frequency of visits by geocachers to a site was clearly related to cache availability, which 451
means that they did not choose a priori any LU. Motivations to do geocaching seem to be more 452
GAM terms Edf Ref. df F p-value
Interaction TERR x DLU
s(TERR):DLUMontado 1.997 2.539 11.813 1.22E-06 ***
s(TERR):DLUArtificial 2.506 3.131 15.995 1.44E-10 ***
s(TERR):DLUAgriculture 6.920 6.996 47.123 < 2e-16 ***
s(TERR):DLUOpen Areas 4.107 5.025 189.924 < 2e-16 ***
s(TERR):DLUShrublands 5.244 6.090 181.376 < 2e-16 ***
s(TERR):DLUOF 3.131 3.908 29.057 < 2e-16 ***
s(TERR):DLUForests 6.907 6.995 118.763 < 2e-16 ***
s(TERR):DLUWater 4.079 4.979 121.313 < 2e-16 ***
Interaction VAR x DLU
s(VAR):DLUMontado 1.000 1.000 0.003 0.954 s(VAR):DLUArtificial 1.000 1.000 2.200 0.138 s(VAR):DLUAgriculture 1.875 2.350 0.896 0.364 s(VAR):DLUOpen Areas 3.572 4.050 8.839 0.000 *** s(VAR):DLUShrublands 1.060 1.117 8.396 0.003 ** s(VAR):DLUOF 1.584 1.964 0.721 0.522 s(VAR):DLUForests 1.000 1.000 0.625 0.429 s(VAR):DLUWater 4.557 4.890 6.632 0.000 ***
Interaction ALT x DLU
s(ALT):DLUMontado 1.000 1.000 4.968 0.026 *
s(ALT):DLUArtificial 3.340 3.735 1.718 0.087 .
s(ALT):DLUAgriculture 2.978 3.469 2.273 0.062 .
DLUOpen Areas 4.592 4.912 19.075 < 2e-16 ***
s(ALT):DLUShrublands 1.887 2.363 2.750 0.053 .
s(ALT):DLUOF 2.596 3.110 1.293 0.271
s(ALT):DLUForests 3.298 3.958 7.680 5.12E-06 ***
related to ludic aspects of the game such as the will to collect or the challenge of being the first 453
one discovering a cache (O’Hara, 2008). Although discovering new places or walking outdoors 454
can also motivate geocachers (O’Hara, 2008), previous studies already showed that geocachers 455
usually do not move far from their own municipality (Cord et al., 2015; Santos et al., 2012). 456
The evidence that geocachers do not show a priori preferences for any LU can be viewed as a 457
“natural experiment” when their stated preferences are assessed after the visit. In line with 458
previous studies on landscape appreciation by humans (Hartmann and Apaolaza-Ibáñez, 2010; 459
Kaplan, 1987; Williams and Cary, 2002, 2001), our study showed that in Portugal geocachers 460
prefer the more open land uses and higher places, a preference that may be explained by sense 461
of vastness at the geocache site; when at lower altitudes, and particularly in the case of forested 462
land uses, trees reduce the visual horizon. Geocachers also stated preference for places with 463
water, another common feature of human nature (Petrova et al., 2015; Tieskens et al., 2018) 464
Terrain difficulty was relevant for geocachers; regardless of the land use they showed 465
preference for sites more difficult to reach. The challenge is one important motivation for 466
geocachers, both from the individual and social point of view (O’Hara, 2008). Geocachers that 467
log at caches more difficult to reach attain a personal achievement and at the same time 468
increase their reputation in the community. A general preference for less fragmented areas 469
(fewer land uses within each buffer) although not as strong, has also been identified. More 470
fragmented areas lessen the sensation of vastness and the sense of control of the landscape 471
(de Val et al., 2006), which is in accordance with the preference for more open landscapes. 472
4.2. The montado landscape
473Although the montado is not the preferred land use when compared to open landscapes, 474
according to stated preferences, when associated with higher altitudes and terrain difficulty 475
becomes as preferred as those open land uses. It is also the preferred among land uses that 476
have trees. Human preference for savannah-like landscapes has been referred in many studies 477
(Falk and Balling, 2010; Hartmann and Apaolaza-Ibáñez, 2010; Williams and Cary, 2002). The 478
innate preference for open landscapes was suggested by the National Research Council (1986) 479
as an evolutionary advantage for hunters and gatherers living on savannahs, at the time when 480
the hominid brain was increasing in size. According to these authors, these landscapes provide 481
the best shelter, hunting and disease-free environments for hominids. The possibility to see 482
potential predators and prey without being seen (Appleton, 1975), or to easily move through the 483
landscape, is also advantageous (Kaplan, 1991). In spite of the appeal of the savannah 484
hypothesis (Dart, 1925), it is also evident that this preference can, and typically is, modified 485
through personal experience and enculturation (Falk and Balling, 2010; Svobodova et al., 2011). 486
People would tend to prefer more familiar land uses as they grow up, and it would be expected 487
that people that live near a particular land use would have a higher preference for that land use 488
as compared to the others. This could not be assessed in our study because geocache 489
databases do not provide personal details of the geocachers. However, the montado landscape 490
covers one of the less populated regions of Portugal (only 7,3% of the population lives in Alentejo 491
(PORDATA and INE, n.d.)), and the proportion of geocachers that was born and raised in 492
Alentejo is expectedly small. Most of the Portuguese population lives near the coast, where 493
artificial, agricultural and forest plantations are the dominant land uses, and so it is probable that 494
most of the positive appreciations of montado have been stated by geocachers that do not live 495
surrounded by this landscape. 496
The preference for the montado, comparable to that for the open landscapes, can be explained 497
by the presence of scattered trees, considered an element of appreciation of landscapes (Cook 498
and Cable, 1995; Kaplan et al., 1989; Kaplan and Kaplan, 1989; Ruddell and Hammitt, W., 1987; 499
Williams and Cary, 2002). However, and very interestingly, the other types of open forests (OF) 500
that may be found in Portugal, which are also open, savannah-like landscapes with scattered 501
trees, are not as appreciated by geocachers as the montado. One of the factors that can explain 502
this preference is the spreading shape of the canopies, which is characteristic of evergreen oaks 503
(cork and holm oaks). In effect, the other open forest types have different tree species, such as 504
eucalyptus, pine trees or other conifers with more columnar canopy formats, or broadleaf 505
deciduous trees, such as the sweet chestnut or the Pyrenean oak, which are more rounded in 506
shape. An aesthetic, emotional and physiological preference for spreading canopies, as 507
compared to columnar or rounded canopies, was found previously, with people feeling happier 508
when viewing spreading trees compared to other tree formats (Lohr and Pearson-Mims, 2006), 509
this being consistent with the savannah hypothesis. 510
Another explanation for the preference for montado could be the typical presence of free-ranging 511
livestock in this landscape, but we cannot confirm if it occurred by the time geocachers visited 512
the caches. Although the general interest of human beings for life is acknowledged, the aesthetic 513
and emotional value that the animals represent remains rarely discussed (Parsons, 2007). 514
Finally, this preference can be attributed to the branding of this landscape, already considered 515
a national trademark. The name montado is the brand for several food products, from sausages 516
to wine, cork products such as wallets or footware, and even hospitality and tourism, being 517
representative of the Alentejo region. 518
4.3. Geocaching as a crowdsourcing indicator for CES assessment
519The value of a landscape to humans is not easy to quantify since many of the services delivered 520
are not products traded on markets. Some services, such as ecotourism or recreation, can only 521
be valued by monetary revealed preferences techniques, such as travel cost methods or 522
hedonic pricing. However, most CES can only be valued by stated preferences methods, where 523
people are asked about their preferences in face of hypothetical changes of the landscape. 524
These economic methods have been criticized since revealed preference based on monetary 525
valuation is dependent on consumers’ sovereignty and not on ecological conditions (Kumar and 526
Kumar, 2008; Milcu et al., 2013), and stated preferences monetary valuation (such as 527
Contingent valuation or Choice Experiments) are not real situations and the money people state 528
be willing to pay is not real (Spash, 2007). Given the problems associated with monetary 529
valuation, many authors increasingly focus on non-economic methods (Buchel and 530
Frantzeskaki, 2015; Edwards et al., 2012; Fagerholm et al., 2012; Hermelingmeier and Nicholas, 531
2017; Palomo et al., 2013; Plieninger et al., 2013a, 2013b; Sherren et al., 2010; Williams and 532
Cary, 2002, 2001). In recent years, crowdsourcing indicators are becoming popular (Figueroa-533
Alfaro and Tang, 2017; Gliozzo et al., 2016; Tenerelli et al., 2016; Yoshimura and Hiura, 2017) 534
given the high number of photographs, the easiness to obtain them and the geographical 535
location they provide. Most studies use the number of photographs taken from a particular site 536
as a proxy for the intensity of the respective CES (Martínez-Pastur et al., 2016; Tenerelli et al., 537
2016). 538
Geocaching delivers large numbers of photographs available online, and thus can be a good 539
crowdsourcing indicator of CES. As compared to the other user generated contents, geocaching 540
is certainly less known and maybe this is the reason why it is still rarely used as an ES indicator. 541
Nevertheless, the main difference between geocaching and the other user generated contents 542
is that it does not assume that people go to a place attracted by landscape attributes, but rather 543
motivated by the activity itself (which was corroborated in this study). In addition, all participants 544
go to the same specific point where the cache is located rather than being scattered through the 545
landscape. This provides the opportunity to compare information stated by people exactly at the 546
same location, overcoming an often referred problem, which is the error in geotagged photos of 547
other social networks (Tenerelli et al., 2016; Yoshimura and Hiura, 2017). 548
Besides the number of photos taken, other parameters were chosen to evaluate geocachers 549
perceptions about the landscape, such as the number of votes and their scores. These stated 550
preferences have the advantage of using the same scale for all practitioners. However, one of 551
the most promising parameters is the people’s writings in the log. Although not explored in this 552
study, the text contents may contain very relevant information about the landscape and about 553
the geocachers’ emotional state. Also out of the scope of this study, but with similar information 554
potential and deserving to be further explored, is the description of the cache itself made by the 555
owner and whose information is generally quite extensive and revealing of the choice of location 556
(Mendes et al., 2014). 557
Besides not addressing the information on the text and photo contents, this study has other 558
limitations and it should be considered as a first approach to the use of geocaching to assess 559
CES. To actually understand the feelings of geocachers when at a particular place, further work 560
is needed. For instance, text mining and sentiment analysis, by revealing the emotional polarity 561
of the texts written in the log and the landscape features most times referred (Bermingham et 562
al., 2009; Li and Wu, 2010), would reveal much about connection of geocachers with the 563
landscape. Nevertheless, Fartoukh et al. (2012) found a significant correlation between the 564
number of words and positive emotions in texts written by children with different ages, providing 565
strength to our working hypothesis. Furthermore, the factor loadings of Photos, Log size and 566
Favourites on the first axis of the PCA (Figure 3) are positive and similar, suggesting that long 567
texts are used to describe favourite places. In the same way, as suggested above, the number 568
of photos of a particular landscape is probably positively correlated to a positive emotion but 569
only by analysing the content of the photographs we could understand which are the landscape 570
attributes most captured by geocachers and, consequently their actual preferences (Figueroa-571
Alfaro and Tang, 2017; Martínez-Pastur et al., 2016). 572
4.4. Key Insights and Policy Implications
573This study reveals that the montado is a landscape valued by geocachers, and this may apply 574
to other social groups. Montado ecosystem has therefore the potential to provide more 575
recreational and cultural services that what has been acknowledged thus far, since ES for the 576
montado remain somewhat poorly studied (Leal et al., 2018)
577
The montado faces several threats, some of which are global and common to many ecosystems, 578
such as climate change and increased aridity, with the aggravating factor that almost all the 579
holm (about 99.4%) and cork (about 93%) oak forests are located in areas of high susceptibility 580
to desertification (Dias et al., 2013). Other threats are more specific of the montado, such as 581
diseases affecting cork oaks, abandonment or poor management techniques, all of which 582
exacerbated by the dependence of this landscape on the production of cork. 583
Diversification of forestry products and services is one of the strategic objectives for the forest 584
in the National Strategy for Climate Adaptation (Dias et al., 2013), following the Commission 585
White Paper on Adapting to Climate Change – Towards a European Framework for Action
586
(2009) and the EU Strategy on Adaptation to Climate Change (2013). Several municipalities 587
within the montado range already developed strategies for mitigation and adaptation to climate 588
change, including non-structural measures such as information dissemination, economic 589
incentives to reduce vulnerabilities and awareness for adaptation (and against maladaptation), 590
and economic instruments (such as environmental markets). 591
Although these landscapes have a high potential to expand the supply of ES as a response to 592
economic incentives (Bugalho et al. 2017), there is a low uptake of agri-environmental measures 593
for the montado-covered areas, mostly due to low compensation values from the landowners 594
perspective (Santos et al., 2015). However, some landowners and managers already regard 595
cultural services as a potential source of income. Their numbers should increase as the 596
recreational or inspirational potential of these landscapes becomes better known. 597
598
5. Conclusions
599In this study, we demonstrated that the information provided online by geocachers can be used 600
to ascertain landscape preferences. Along with expected results, such as the preference for 601
landscapes with water, we have gained insights on the determinants that may explain the 602
attraction for montado savannah-like landscapes and this information may support the design 603
of regional development and land-use management policies. Allowing the comparison of a priori 604
preferences (choice of place to visit) with the stated preferences (a posteriori site evaluation) is 605
one of the great advantages of using geocaching-produced data, as it allows to assess the 606
effects of any a priori preference for a region or landscape. Other advantage of geocaching data 607
is the reduced error in caches location as compared to other crowdsourcing data and a more 608
numerous and diversified data. On the other hand, when geocachers write their opinions in the 609
logs they are not feeling pressured by anyone, as sometimes happens with face-to-face 610
interviews and other kinds of methods which requires the intervention of a mediator. Our results 611
also indicate that the montado has a strong potential as CES provider and, consequently, as a 612
promoter of this landscape diversification, reducing the risks of being highly dependent on 613
provision services. Given the considerable increase of tourism in Portugal, representing 7% of 614
the Portuguese GDP (PORDATA, 2017), this would be of interest and compatible with activities 615
already implemented and, if properly conducted, environmentally sustainable. 616
617
Acknowledgements
618The lead author was supported by the OPERA Project (Operational Potential of Ecosystem 619
Research Applications) European Union Seventh Framework Programme (FP7-ENV.2012.6.2-620
1) under grant agreement n° 308393. Pedro Segurado was supported by a contract funded by 621
the Fundação para a Ciência e Tecnologia (FCT) under the IF Researcher Programme 622
(IF/01304/2015). Ricardo N. Mendes was supported by CICS.NOVA - Interdisciplinary Centre 623
of Social Sciences of the Universidade Nova de Lisboa (UID/SOC/04647/2013) and Margarida 624
Santos-Reis and Rui Rebelo by cE3c – Centre for Ecology, Evolution and Environmental 625
Changes (UID/BIA/00329/2013), both units with the financial support of FCT/MCTES through 626
National funds. 627
628 629
Annex
630631 632 633
This study COS description Agregation
Artificial Artificial surfaces level 1
Water Wetlands level 1
Water bodies level 1
Agriculture
Arable land level 2
Permanent crops level 2
Pastures level 2
Annual crops associated with permanent crops level 3
Complex cultivation patterns level 3
Land principally occupied by agriculture, with significant areas of
natural vegetation level 3
Montado Cork or holm oaks agro-forestry with non-irrigated crops level 5 Cork or holm oaks agro-forestry with irrigated crops level 5
Cork or holm oaks agro-forestry with pastures level 5
Cork or holm oaks agro-forestry with permanent crops level 5
Cork or holm oak open forests level 5
Cork or holm oak open forests with other broadleaf trees level 5 Cork or holm oak open forests with evergreen trees level 5
Forests Forests level 2
Open Forests (OF) Other agro-forests with non-irrigated crops level 5
Other agro-forests with irrigated crops level 5
Other agro-forests with pastures level 5
Other agro-forests with permanent crops level 5
Broadleaf open forests level 5
Pure or mixed evergreen open forests level 5
Evergreen and broadleaf open forests level 5
Open Areas Natural grasslands level 3
Clear cuts and new plantings Level 4
Tree nurseries Level 4
Firebreaks Level 4
Open spaces with little or no vegetation Level 2
Water Wetlands Level 2
6. References
634Abson, D.J., Termansen, M., 2011. Valuing Ecosystem Services in Terms of Ecological Risks 635
and Returns. Conserv. Biol. 25, 250–258. https://doi.org/10.1111/j.1523-636
1739.2010.01623.x 637
Almeida, M., Azeda, C., Guiomar, N., Pinto-Correia, T., 2015. The effects of grazing 638
management in montado fragmentation and heterogeneity. Agrofor. Syst. 639
https://doi.org/10.1007/s10457-014-9778-2 640
Almeida, M., Loupa-Ramos, I., Menezes, H., Carvalho-Ribeiro, S., Guiomar, N., Pinto-Correia, 641
T., 2014. Urban population looking for rural landscapes: Different appreciation patterns 642
identified in Southern Europe. Land use policy 53, 44–55.
643
https://doi.org/10.1016/j.landusepol.2015.09.025 644
Antrop, M., 1997. The concept of traditional landscapes as a base for landscape evaluation and 645
planning. The example of Flanders Region. Landsc. Urban Plan. 38, 105–117. 646
https://doi.org/10.1016/S0169-2046(97)00027-3 647
APCOR, 2016. APCOR’s Cork Yearbook 2016. Santa Maria de Lamas. 648
APCOR, n.d. APCOR [WWW Document]. URL http://www.apcor.pt (accessed 7.10.17). 649
Appleton, J., 1975. The experience of landscape. John Wiley, NewYork, NY. 650
Barredo, J.I., Bastrup-Birk, A., Teller, A., Onaindia, M., Manuel, B., Madariaga, I., Rodríguez-651
Loinaz, G., Pinho, P., Nunes, A., Ramos, A., Batista, M., Mimo, S., Cordovil, C., 652
Branquinho, C., Grêt-Regamey, A., Bebi, P., Brunner, S., Weibel, B., Kopperoinen, L., 653
Itkonen, P., Viinikka, A., Chirici, G., Bottalico, F., Pesola, L., Vizzarri, M., Garfì, V., 654
Antonello, L., Barbati, A., Corona, P., Cullotta, S., Giannico, V., Lafortezza, R., Lombardi, 655
F., Marchetti, M., Nocentini, S., Riccioli, F., Travaglini, D., Sallustio, L., Rosário, I., Von 656
Essen, M., Nicholas, K., Máguas, C., Rebelo, R., Santos-Reis, M., Santos-Martín, F., 657
Zorrila-Miras, P., Montes, C., Benayas, J., Martín-López, B., Snäll, T., Berglund, H., 658
Bengtsson, J., Moen, J., Busetto, L., San-Miguel-Ayanz, J., Thurner, M., Beer, C., Santoro, 659
M., Carvalhais, Wutzler, T., Schepaschenko, D., Shvidenko, A., Kompter, E., Ahrens, B., 660
Levick, S.R., Schmullius, C., 2015. Mapping and assessment of forest ecosystems and 661
their services – Applications and guidance for decision making in the framework of MAES, 662
European Comission Report, Joint Research Centre, Forest Resources and Climate Unit. 663
https://doi.org/10.2779/12398 664
Belo, C.C., Pereira, M.S., Moreira, A.C., Coelho, I.S., Onofre, N., Paulo, A.A., 2009. Montado, 665
in: Pereira, H.M., Domingos, T., Vicente, L., Proença, V. (Eds.), Ecossistemas e Bem-Estar 666
Humano: Avaliação Para Portugal Do Millennium Ecosystem Assessment. Escolar Editora, 667
Lisboa, pp. 251–293. 668
Bermingham, A., Conway, M., Mclnerney, L., O’Hare, N., Smeaton, A.F., 2009. Combining 669
social network analysis and sentiment analysis to explore the potential for online 670
radicalisation. Proc. 2009 Int. Conf. Adv. Soc. Netw. Anal. Mining, ASONAM 2009 231– 671
236. https://doi.org/10.1109/ASONAM.2009.31 672
Bieling, C., 2004. Non-industrial private-forest owners: Possibilities for increasing adoption of 673
close-to-nature forest management. Eur. J. For. Res. 123, 293–303.
674
https://doi.org/10.1007/s10342-004-0042-6 675
Blondel, J., 2006. The ‘Design’ of Mediterranean Landscapes: A Millennial Story of Humans and 676
Ecological Systems during the Historic Period. Hum. Ecol. 34, 713–729. 677
https://doi.org/10.1007/s10745-006-9030-4 678
Buchel, S., Frantzeskaki, N., 2015. Citizens’ voice: A case study about perceived ecosystem 679
services by urban park users in Rotterdam, the Netherlands. Ecosyst. Serv. 12, 169–177. 680
Bugalho, M.N., Caldeira, M.C., Pereira, J.S., Aronson, J., Pausas, J.G., 2011. Mediterranean 681
cork oak savannas require human use to sustain biodiversity and ecosystem services. 682
Front. Ecol. Environ. 9, 278–286. https://doi.org/10.1890/100084 683
Caetano, M., Marcelino, F., Igreja, C., Girão, I., 2018. A ocupação e uso do solo em 2015 e 684
dinâmicas territoriais 1995-2007-2010-2015 em Portugal Continental. Lisboa, Portugal. 685
Carrete, M., Donazar, J., 2005. Application of central-place foraging theory shows the 686
importance of Mediterranean dehesas for the conservation of the cinereous vulture,. Biol. 687
Conserv. 126, 582–590. https://doi.org/10.1016/j.biocon.2005.06.031 688
Caudullo, G., Welk, E., San-Miguel-Ayanz, J., 2017. Chorological maps for the main European 689
woody species. Data Br. 12, 662–666. 690
Cook, P.S., Cable, T.T., 1995. The scenic beauty of shelterbelts on the Great Plains. Landsc. 691
Urban Plan. 32, 63–69. https://doi.org/10.1016/0169-2046(94)00171-X 692
Cord, A.F., Roeßiger, F., Schwarz, N., 2015. Geocaching data as an indicator for recreational 693
ecosystem services in urban areas: Exploring spatial gradients, preferences and 694
motivations. Landsc. Urban Plan. 144, 151–162.
695
https://doi.org/10.1016/j.landurbplan.2015.08.015 696
Correia, R.A., Bugalho, M.N., Franco, A.M.A., Palmeirim, J.M., 2018. Contribution of spatially 697
explicit models to climate change adaptation and mitigation plans for a priority forest 698
habitat. Mitig. Adapt. Strateg. Glob. Chang. 23, 371–386. https://doi.org/10.1007/s11027-699
017-9738-z 700
Costa, A., Pereira, H., Madeira, M., 2010. Analysis of spatial patterns of oak decline in cork oak 701
woodlands in Mediterranean conditions. Ann. For. Sci. Sci. 67, 67–204. 702
https://doi.org/10.1051/forest/2009097 703
Daniel, T.C., Muhar, a., Arnberger, a., Aznar, O., Boyd, J.W., Chan, K.M. a., Costanza, R., 704
Elmqvist, T., Flint, C.G., Gobster, P.H., Gret-Regamey, a., Lave, R., Muhar, S., Penker, 705
M., Ribe, R.G., Schauppenlehner, T., Sikor, T., Soloviy, I., Spierenburg, M., Taczanowska, 706
K., Tam, J., von der Dunk, a., 2012. Contributions of cultural services to the ecosystem 707
services agenda. Proc. Natl. Acad. Sci. 109, 8812–8819.
708
https://doi.org/10.1073/pnas.1114773109 709
Dart, R.A., 1925. Australopithecus africanus: the man-ape of South Africa. Nature 115, 195– 710
199. 711
de Val, G., Atauri, J.A., de Lucio, J. V., 2006. Relationship between landscape visual attributes 712
and spatial pattern indices: A test study in Mediterranean-climate landscapes. Landsc. 713
Urban Plan. 77, 393–407. https://doi.org/10.1016/j.landurbplan.2005.05.003 714
DGT – IDireção Geral do Território, 2011. Cartografia de Ocupação do Solo de Portugal 715
Continental para 2007 (COS 2007). 716
Di Gregorio, A., Henry, M., Donegan, E., Fenegold, Y., Latham, J., Jonckheere, Cumani, R., 717
2016. Land Cover Classification System - Classification concepts Software version 3, d 718
and Agri. ed. Rome, Italy. 719
Dias, A., Franco, A., Araújo, A., Ferreira, C., Santos, E., Silva, E., Borges, F., Lima, F., Goes, 720
F., Lopes, G., Louro, G., Faria, J., Pinho, J., Figueiredo, J., Rodrigues, J., Rodrigues, M., 721
Calaím, L., Pereira, M., Calado, N., 2013. Adaptação das florestas às alterações climáticas. 722
Trabalho no âmbito da Estratégia Nacional de Adaptação às Alterações Climáticas. Lisboa, 723
Portugal. 724
Díaz-Villa, M.D., Marañón, T., Arroyo, J., Garrido, B., 2003. Soil seed bank and floristic diversity 725
in a forest-grassland mosaic in southern Spain. J. Veg. Sci. 14, 701–709. 726
https://doi.org/10.1658/1100-9233(2003)014[0701:SSBAFD]2.0.CO;2 727
Edwards, D.M., Jay, M., Jensen, F.S., Lucas, B., Marzano, M., Montagn??, C., Peace, A., 728
Weiss, G., 2012. Public preferences across Europe for different forest stand types as sites 729
for recreation. Ecol. Soc. 17, 27. https://doi.org/10.5751/ES-04520-170127 730
EEA, 2004. High nature value farmland. Characteristics , trends and policy challenges. 731
Copenhagen, Denmark. 732