www.arch-anim-breed.net/58/57/2015/ doi:10.5194/aab-58-57-2015
© Author(s) 2015. CC Attribution 3.0 License. Archives Animal Breeding
Investigation of the genetic distances of bovids and
cervids using BovineSNP50k BeadChip
R. Kasarda1, N. Moravˇcíková1, R. Židek2, G. Mészáros3, O. Kadleˇcík1, A. Trakovická1, and J. Pokorádi4 1Department of Animal Genetics and Breeding Biology, Slovak University of Agriculture, Nitra, Slovakia
2Department of Food Hygiene and Safety, Slovak University of Agriculture, Nitra, Slovakia 3Division of Livestock Sciences, University of Natural Resources and Life Sciences, Vienna, Austria
4XCELL Breeding Services Ltd., Bratislava, Slovakia
Correspondence to:R. Kasarda ([email protected])
Received: 7 August 2014 – Accepted: 13 November 2014 – Published: 4 March 2015
Abstract. This study presents the application of BovineSNP50 BeadChip for genome-wide screening of two taurine breeds (Bos primigenius taurus) and Zebu (Bos primigenius indicus), and two species from the family Cervidae: red deer (Cervus elaphus) and fallow deer (Dama dama). The aim of the paper was to evaluate the use of bovine array for cross-species genotyping and analyse single nucleotide polymorphism (SNP) distribution, diversity within groups of animals and genetic distance among analysed species. The number of polymorphic SNPs decreased with the increase of phylogenetic distance between species, which also reflected a decrease in call rate (from 99.54 to 61.19 %). The minor allele frequency (MAF) values were significantly different between species and ranged from 0.18±15 (Zebu) to 0.26±0.14 (Pinzgau). The subsequent analyses of genetic diversity were based on the polymorphic loci detected in cervids. Differences in the expected heterozygosity was low (0.06), on average 0.34. In analysed groups theFISvalues were close to zero, which suggested low SNP variance
within them. The value ofFIT indicated homozygote excess in evaluated individuals. Analysis of molecular
variance revealed that most of the variability was distributed within all individuals. Observed genetic distances within and across groups of animals suggested that taurine cattle and cervids were more distant. The study results showed that genotyping array prepared for model species can be applied not only to organisms for which was developed, but can be also successfully used in closely related and more phylogenetically divergent species.
1 Introduction
The families Bovidae and Cervidae belong to the Pecorans (higher ruminants, order Artiodactyls), the most important group of large terrestrial herbivorous mammals. A 25.1–30.1 million year divergence was found between these two fami-lies. The richness in species and geographical spread of ru-minants are reasons for the general interest in much phylo-genetic and diversity research (Hassanin and Douzery, 2003; Fernández and Vrba, 2005; Decker et al., 2009). Bovidae and Cervidae represent the greatest degree of taxonomic and geographical diversity among the ruminants, with 48 bovid genera in Africa, most of Eurasia, and North America and 16 cervid general from mainly North and South America and Eurasia (Hassanin and Douzery, 2003). Traditionally, the
species such as those from the family Cervidae (Wada et al., 2010). Because of complete genome-wide sequences not be-ing available for all species, much of the analyses in the dis-covery of nuclear DNA markers of non-model organisms are based on comparative work with already sequenced genomes of other “model” species (Hall, 2009). Nevertheless, the phy-logenetic relationships among Cervidae and Bovidae species have been until now investigated using both mitochondrial and nuclear markers (Decker et al., 2009; Wada et al., 2010; Zhang and Zhang, 2012). Moreover, the availability and pop-ularity of single nucleotide polymorphisms (SNPs) as use-ful nuclear markers for investigating not only evolutionary processes but also genetic diversity parameters are growing. The genomic programmes in livestock species have enabled the building and application of large SNP panels containing more than 50 000 markers (Bixley et al., 2009). The appli-cation of SNPs in population genetics studies of non-model organisms can be difficult due to the absence of genomic resources (Seeb et al., 2011). However recent studies have shown that the high-density SNP array development for live-stock species such as cattle, sheep and horse can be success-fully used in closely related and also phylogenetically more distant non-model species, in which they can yield large numbers of markers for relatively modest technical efforts and expenditure (Pertoldi et al., 2010; Haynes and Latch, 2012; Miller et al., 2012; Hoffman et al., 2013).
The aim of this study was to evaluate the transferability of bovine SNP array for cross-species genotyping in closely re-lated and more evolutionary distant species and analyse vari-ation and distribution of useful polymorphic SNPs for the de-termination of genetic diversity parameters and the relation-ship between species based on genetic distance and pairwise
FST.
2 Material and methods
Samples of semen were collected from in total 89 males cre-ating four different groups (of that 19 Pinzgau, 30 Brown Swiss, 30 Zebu and 10 cervids) and used for analysis. Ten cervid samples were obtained from unrelated farmed three red deers (male progeny of New Zealand sires and dams from Hungary) and free range four red and three fallow deer. Genotyping of samples was carried out in a commercial lab using Illumina BovineSNP50 BeadChip. A 50K SNP array was constructed with 54 609 SNPs in Pinzgau and cervids, 54 001 in Brown Swiss and 48 734 in Zebu.
Quality control of genotype data was performed accord-ing to Purcell et al. (2007). The proportion of usable SNPs for analyses of genetic diversity and relatedness between ani-mals was computed by identifying polymorphic SNPs within the arrays used in all analysed groups. The quality control was arranged to remove any SNPs with more than 10 % of missing genotype, SNPs with less than 0.05 minor allele fre-quency (MAF) and Hardy–Weinberg equilibrium test with
limit of 0.0001. The variations and distribution of remain-ing SNPs across and within all chromosomes for each group were evaluated in the first step. Subsequently, for the analysis of genetic structure within and across all animal groups, only polymorphic loci localized on autosomal chromosomes were selected.
After quality control application, only autosomal loci based on cervids polymorphic SNPs from all data sets were selected in order to infer genetic diversity and relationships among the analysed groups. The Hardy–Weinberg equilib-rium (HWE) within each analysed group was tested using Fisher’s exact test (Raymond and Rousset, 1995). Animal groups were evaluated by theF statistic (Wright, 1965) and inbreeding-like effects within subpopulations (FIS), among
subpopulations (FST)and across the entire analysed animal
group (FIT). Level of observed (Ho)and expected (He)
het-erozygosity and theFISindices (Weir and Cockerham, 1984)
were calculated within each group according to Excoffier et al. (2005) and Belkhir et al. (2004). The genetic differentia-tion within and among groups and pairwiseFSTwere
mea-sured by analysis of molecular variance (AMOVA) with 1000 permutations (Excoffier et al., 2005). The pairwise Nei’s ge-netic distances between individuals used for construction of neighbour-joining tree were calculated from allelic fre-quencies under the Nei 1982 model (Liu and Muse, 2001) with 100 bootstrap replications. A consensus phylogenetic tree was obtained by Phylip software package (Felsenstein, 2005).
3 Results and discussion
The number of successfully genotyped SNPs in least 90 % of individuals ranged from 98 % (taurine breeds) to 53.85 % (cervids). The call rate had a decreasing tendency from tau-rine breeds (99.15–99.54 %) to cervids (61.19 %) due to phy-logenetic distances between analysed species and reflects the degree of diversity between their genomic regions. Genetic relatedness betweenBos primigenius taurus andBos prim-igenius indicuscompared to cervids confirms only a slight decrease in detected value of call rate (98.91 %). By cross-species genotyping using bovine, ovine and equine SNP50 array, a consistent linear decrease in call rate was found of about 1.5 % per million years and retention polymorphisms showed an exponential decay (Miller et al., 2012).
Table 1.MAF distribution of BovineSNP50 BeadChip in analysed groups.
Fixed Rare Intermediate Common
Population N Average MAF (0) (> 0 and < 0.05) (≥0.05 and < 0.10) (≥0.10 and≤0.50)
SNP % SNP % SNP % SNP %
Brown Swiss bulls 30 0.24±0.15 11 298 21.31 4337 8.18 4582 8.64 32 790 61.86
Pinzgau bulls 19 0.26±0.14 8480 15.69 2540 4.70 4792 8.87 38 230 70.74
Zebu cattle 30 0.18±0.15 19 632 41.33 5964 12.56 4655 9.80 17 251 36.32
Cervids 10 0.23±0.16 27 866 94.76 0 0.00 289 0.98 1253 4.26
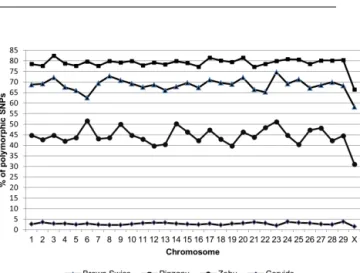
genotyped SNPs, and 5.24 % (1542) of SNPs were polymor-phic. Rapid decrease in the proportion of polymorphic SNPs in cervids can be related to the phylogenetic distance be-tween them and the species for which was the array opti-mized. Miller et al. (2012) showed that only about 5 % of amplified loci remain polymorphic after application of geno-typing array to species which diverged 3 million years ago. Only few studies so far have utilized commercially devel-oped SNP arrays for genotyping more phylogenetically dis-tant species (Decker et al., 2009; Haynes and Latch, 2012; Miller et al., 2012; Hoffman et al., 2013). Since the initial genotyping array has a large enough number of loci, even a low proportion of cross-amplifying SNPs may represent a useful set of markers for species which lack genomic re-sources (Hoffman et al., 2013). The distribution of SNPs over entire genomes of all chromosomes was not uniform and var-ied among the analysed groups. The proportion of polymor-phic SNPs to the total number of SNPs for each chromosome on the genotyping arrays is shown in Fig. 1. The highest pro-portion of polymorphisms and lowest level of fixed SNPs within analysed groups showed Pinzgau and Brown Swiss with proportions of monomorphic loci of only 20.21 and 29.71 %, respectively. Conversely the highest level of fixed SNPs showed cervids and across all analysed groups was the number of fixed SNPs highest on chromosome 1 (ranging from 709 to 1777). Only 1.18 % of SNPs were on average polymorphic across all evaluated groups. Figure 2 shows the proportion of common SNP variants and SNPs exclusive for bovids and cervids groups to the total number of markers. Most of polymorphic SNPs were localized on chromosome 1 (2694 in taurine cattle and 1364 in Zebu) and chromosome 2 (100 in cervids). In all analysed groups, the lowest number of polymorphic SNPs was found on chromosome X (ranging from 16 to 777). Chromosome Y has not been evaluated be-cause the 50K bovine chip used in this study included only one Y specific SNP, which was additionally monomorphic in the cervids group.
The average value and distribution of minor allele fre-quency (MAF), which refers to the frefre-quency of least com-mon SNP allele, in analysed groups shown in Table 1. The values of MAF varied across analysed groups and ranged from 0.18 (Zebu) to 0.26 (Pinzgau). Significant dif-ferences were observed between different groups of animals
Figure 1.Proportion of polymorphic SNPs to the total number of SNPs for each chromosome on the BovineSNP50 BeadChip.
Figure 2.Proportion of SNPs by polymorphic status of the Bovi-neSNP50 BeadChip across bovids and cervids.
Table 2.HWEpvalues, expected (He)and observed (Ho)heterozygosity and fixation indexes (FIS).
Brown Swiss bulls Pinzgau bulls Zebu cattle Cervids
HWE 0.995 0.997 0.999 P value – highly significant < 0.05
HE 0.37±0.13 0.38±0.13 0.32±0.14 0.32±0.15
HO 0.37±0.14 0.38±0.15 0.32±0.16 0.28±0.37
FIS −0.02±0.0001 0.003±0.0001 −0.01±0.0001 0.13±0.0006
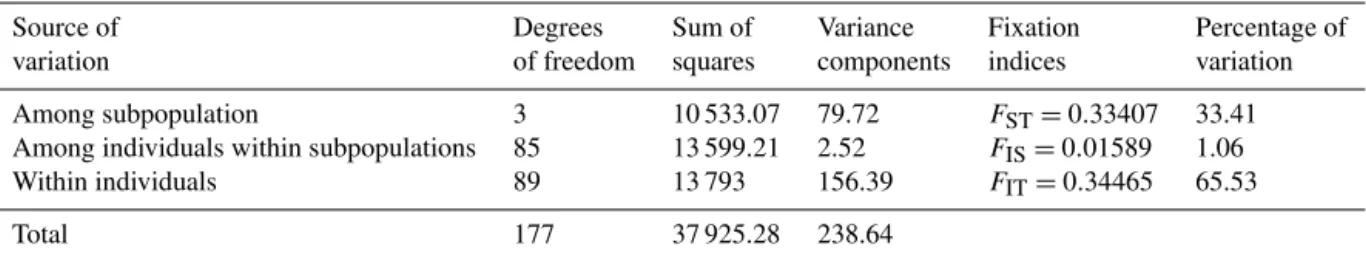
Table 3.Analysis of molecular variance (AMOVA) based on selected SNPs.
Source of Degrees Sum of Variance Fixation Percentage of
variation of freedom squares components indices variation
Among subpopulation 3 10 533.07 79.72 FST=0.33407 33.41
Among individuals within subpopulations 85 13 599.21 2.52 FIS=0.01589 1.06
Within individuals 89 13 793 156.39 FIT=0.34465 65.53
Total 177 37 925.28 238.64
presented results and previous studies could be caused by different densities of SNPs on the used genotyping arrays. Moreover the MAF value can be affected in the application of cross-species genotyping arrays by ascertainment bias, the systematic deviations from the expected allele frequency dis-tribution leading to downstream biases in the evaluation of many indices (Satkoski Trask et al., 2011). Probability that a SNP is identified in ascertainment panel with small size com-pared to the population is a function of its MAF and the SNP discovery process, favours the most variable sites and elimi-nates rare SNPs (Garvin et al., 2010; Helyar et al., 2011). The evaluation of population genetic parameters such as diversity can be biased mainly because the SNPs on the chip optimized for model species are not completely representative for non-model animals. The number and variability of individuals used in SNP discovery panel in non-model species can also lead to some degree of ascertainment bias because the panel consists of only a small subset of the genotyped individuals (Albrechtsen et al., 2010). The degree of ascertainment bias depends on the number in which the SNPs were originally found and results in a skewing of the allele frequency spec-trum towards common alleles (De Donato et al., 2013). In our data set, some level of ascertainment bias could be in-troduced because bovine genotyping array was used to deter-mine polymorphic SNPs in closely related (Bos primigenius indicus) and more phylogenetically distant species from the family Cervidae, and therefore the comparison should be in-terpreted with caution.
Genetic variability and phylogenetic relationship within and between analysed groups was evaluated based on se-lected polymorphic loci (MAF≥0.05) from cervids (Ta-ble 1). The level of expected heterozygosity was relatively comparable in all evaluated groups of animals. The highest
Hewas observed in Pinzgau and lowest in cervids and Zebu,
but differences were very low (0.06). The observed
heterozy-gosity ranged from 0.28 (cervids) to 0.38 (Pinzgau). In tau-rine and Zebu groups, HWE equilibrium was found (Table 2). In cervids, the variation in proportion of SNPs led to the deviation from the Hardy–Weinberg equilibrium (P <0.05). Because of the low number of cervids and the fact that this group consists of two different species, the determination of HWE in this case is a modelled computation to obtain an overall view of the data. The within population fixation index (FIS)had negative values in Brown Swiss and Zebu,
suggest-ing relatively higher proportion of heterozygote genotypes and conversely positive values in Pinzgau and cervids. All
FISvalues were close to zero (Table 2), suggesting low SNP
variance within separately evaluated groups. The average es-timatedFIS(within group inbreeding estimates) andFIT
(to-tal inbreeding) values were positive (Table 3), indicating a higher proportion of homozygote genotype on the level of particular groups and all evaluated animals as well.
The AMOVA and ascertained value ofFST revealed that
the most of the variance was distributed within all evalu-ated individuals (Table 3). A lesser part of the genetic varia-tion (33.41 %) was attributed to variavaria-tion among the groups. Only a very low proportion of variation explained differences among individuals within groups.
The genetic relationship between analysed species was ex-amined using pairwiseFST and Nei’s genetic distances. The
pairwiseFST estimated between analysed groups based on
total of 1530 autosomal SNPs shown in Table 4. TheFST
values from pairwise comparisons between different groups ranged from 0.11 (Pinzgau vs. Zebu) to 0.47 (Brown Swiss vs. cervids). As expected, the most genetically differentiated group of those compared was cervids. The higher observed
FST value between Pinzgau and Brown Swiss compared to
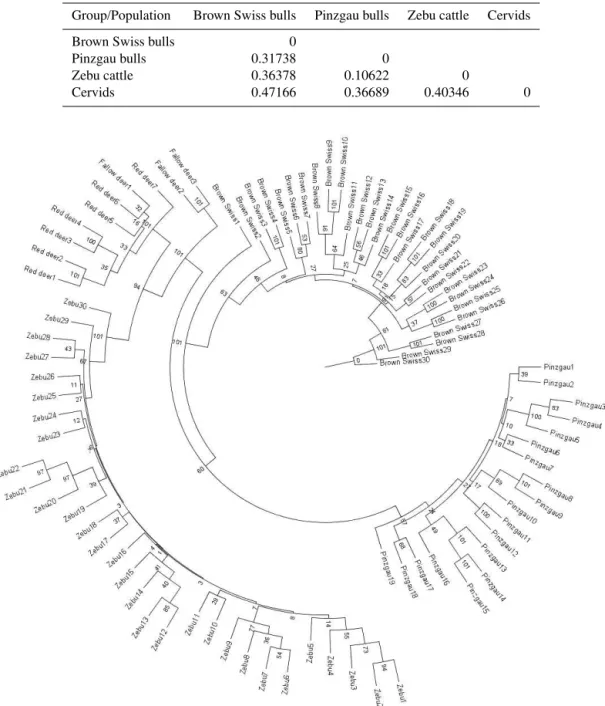
Table 4.The pairwiseFSTvalues between analysed groups.
Group/Population Brown Swiss bulls Pinzgau bulls Zebu cattle Cervids
Brown Swiss bulls 0
Pinzgau bulls 0.31738 0
Zebu cattle 0.36378 0.10622 0
Cervids 0.47166 0.36689 0.40346 0
Figure 3.Neighbour-joining tree clustering genetic distances and bootstraps estimates among zebu, two taurine breeds and cervids.
average genetic distances between pairs of individuals from the same analysed groups was lowest between Pinzgau and Brown Swiss (0.07).
The greatest genetic distance between pairs of analysed groups showed Brown Swiss and cervids (D=0.31). Sim-ilar distances between cervids were found also for Pinzgau (D=0.28) and Zebu (D=0.30). Pinzgau were relatively genetically closer to cervids than Zebu, but the difference was only 0.02. The genetic distance between Zebu and Pinz-gau were lower than between Brown Swiss and Zebu (0.21 vs. 0.24). Overall the results showed that the most genetic
distant from all other evaluated groups were cervids, and the closest were the taurine breeds. The neighbour-joining tree (Fig. 3) created from allelic frequencies of polymor-phic SNPs, selected based on data set from cervids, showed clear differentiation between the two taurine breeds, Zebu and cervids.
discovery process of SNPs in non-model organisms based on a genotyping array designed for phylogenetically distant species must be interpreted with caution because it may be affected by ascertainment bias. However, if the genotyping arrays for non-model species are not commercially available, utilization of these arrays is one possible approach for ge-netic research in this area.
Acknowledgements. This project was co-financed by the European Union under project no. 26240220080, which supports research activities in Slovakia, and the Slovak Research and Development Agency under the contract no. APVV-0636-11.
Edited by: K. Wimmers
Reviewed by: three anonymous referees
References
Albrechtsen, A., Nielsen, F. C., and Nielsen, R.: Ascertainment bi-ases in SNP chips affect measures of population divergence, Mol. Biol. Evol., 24, 1–20, 2010.
Belkhir, K., Borsam, P., Chikhi, L., Raufaste, N., and Bonhomme, F.: [GENETIX 4.05, software for Windows TM for population genetics]. Laboratoire Génome, Populations, Interactions, CNRS UMR 5000, Université de Montpellier II, Montpellier, France, 2014 (in French).
Bibi, F.: A multi-calibrated mitochondrial phylogeny of extant Bovidae (Artiodactyla, Ruminantia) and the importance of the fossil record to systematics, BMC Evol. Biol., 13, 166, doi:10.1186/1471-2148-13-166, 2013.
Bixley, M. J., Ward, J. F., Brauning, R., Archer, J. A., and Fisher, P. J.: Building a deer SNP chip, Proc. Assoc. Adv. Anim. Breed. Genet., 18, 300–303, 2009.
Boichard, D., Chung, H., Dassonneville, R., David, X., Eggen, A., Fritz, S., Gietzen, K. J., Hayes, B. J., Lawley, C. T., Sonste-gard, T. S., Van Tassell, C. P., VanRaden, P. M., Viaud-Martinez, K. A., and Wiggans, G. R.: Design of a Bovine Low-Density SNP Array Optimized for Imputation, PLoS One, 7, e34130, doi:10.1371/journal.pone.0034130, 2012.
De Donato, M., Peters, S. O., Mitchell, S. E., Hussain, T., and Imumorin, I. G.; Genotyping-by-Sequencing (GBS): A Novel, Efficient and Cost-Effective Genotyping Method for Cat-tle Using Next-Generation Sequencing, PLoS One, 8, e62137, doi:10.1371/journal.pone.0062137, 2013.
Decker, J. E., Pires, J. C., Conant, G. C., McKay, S. D., Heaton, M. P., Chen, K., Cooper, A., Vilkki, J., Seabury, C. M., Caetano, A. R., Johnson, G. S., Brenneman, R. A., Hanotte, O., Eggert, L. S., Wiener, P., Kim, J. J., Kim, K. S., Sonstegard, T. S., Van Tassell, C. P., Neibergs, H. L., McEwan, J. C., Brauning, R., Coutinho, L. L., Babar, M. E., Wilson, G. A., McClure, M. C., Rolf, M. M., Kim, J. W., Schnabel, R. D., and Taylor, J. F.: Resolving the evo-lution of extant and extinct ruminants with high-throughput phy-logenomics, P. Natl. Acad. Sci. USA, 106, 18644–18649, 2009. Excoffier, L., Laval, G., and Schneider, S.: Arlequin (version 3.0):
An integrated software package for population genetics data analysis, Evol. Bioinform. Online, 1, 47–50, 2005.
Felsenstein, J.: PHYLIP (Phylogeny Inference Package) version 3.6. Distributed by the author, Department of Genome Sciences, University of Washington, Seattle, USA, 2005.
Fernández, M. H. and Vrba, E. S.: A complete estimate of the phy-logenetic relationships in Ruminantia: a dated species-level su-pertree of the extant ruminants, Biol. Rev., 80, 269–302, 2005. Garvin, M. R., Saitoh, K., and Gharrett, A. J.: Application of
sin-gle nucleotide polymorphisms to non-model species: a technical review, Mol. Ecol. Resour., 10, 915–934, 2010.
Hall, R. J.: Deer, in: Genome Mapping and Genomics in Domestic Animals, edited by: Cockett, N. E. and Kole, C., Berlin, Ger-many, 47–74, 2009.
Hassanin, A. and Douzery, E. J. P.: Molecular and Morphological Phylogenies of Ruminantia and the Alternative Position of the Moschidae, Syst. Biol., 52, 206–228, 2003.
Haynes, G. D. and Latch, E. K.: Identification of Novel Sin-gle Nucleotide Polymorphisms (SNPs) in Deer (Odocoileus
spp.) using the BovineSNP50 BeadChip, PLoS One, 7, e36536, doi:10.1371/journal.pone.0036536, 2012.
Helyar, S. J., Hemmer-Hansen, J., Bekkevold, D., Taylor, M. I., Og-den, R., Limborg, M. T., Cariani, A., Maes, G. E., Diopere, E., Carvalho, G. R., and Nielsen, E. E.: Application of SNPs for pop-ulation genetics of nonmodel organisms: new opportunities and challenges, Mol. Ecol. Resour., 11 (Suppl.), 123–136, 2011. Hoffman, J. I., Thorne, M. A. S., McEwing, R., Forcada, J., and
Og-den, R.: Cross-amplification and validation of SNPs conserved over 44 million years between seals and dogs, PLoS One, 8, e68365, doi:10.1371/journal.pone.0068365, 2013.
Liu, K. J. and Muse, S. V.: PowerMarker: an integrated analy-sis environment for genetic marker analyanaly-sis, Bioinformatics, 21, 2128–2129, 2005.
Marcot, J. D.: Molecular phylogeny of terrestrial artiodactyls: Con-flicts and resolution, in: The Evolution of Artiodactyls, edited by: Prothero, D. R. and Foss, S. E., Baltimore, USA, 4–18, 2007. Miller, J. M., Kijas, J. W., Heaton, M. P., McEwan, J. C., and
Colt-man, D. W.: Consistent divergence times and allele sharing mea-sured from cross-species application of SNP chips developed for three domestic species, Mol. Ecol. Resour., 12, 1145–1150, 2012.
Mustafa, H., Heather, H. J., EuiSoo, K., Ahmad, N., Ali, A., Khan, W. A., Pasha, T. N., Farooq, M. Z., Javed, K., Ajmal, A., and Sonstegard, T. S.: Comparative analysis of genome wide differ-ence in Red Sindhi and Holstein cattle breeds using dense SNP marker, Int. J. Adv. Res., 2, 300–304, 2014.
Pertoldi, C., Tokarska, M., Wójcik, J. M., Kawałko, A., Randi, E., Kristensen, T. N., Loeschcke, V., Coltman, D., Wilson, G. A., Gregersen, V. R., and Bendixen, C.: Phylogenetic relation-ships among the European and American bison and seven cattle breeds reconstructed using the BovineSNP50 Illumina Genotyp-ing BeadChip, Acta Theriol., 55, 97–108, 2010.
Purcell, S., Neale, B., Todd-Brown, K., Thomas, L., Ferreira, M. A. R., Bender, D., Maller, J., Sklar, P., de Bakker, P. I. W., Daly, M. J., and Sham, P. C.: PLINK: A Tool Set for Whole-Genome As-sociation and Population-Based Linkage Analyses, Am. J. Hum. Genet., 81, 559–575, 2007.
Satkoski Trask, J. A., Malhi, R. S., Kanthaswamy, S., Johnson, J., Garnica, W. T., Malladi, V. S., and Smith, D. G.: The effect of SNP discovery method and sample size on estimation of pop-ulation genetic data for Chinese and Indian rhesus macaques (Macaca mulatta), Primates, 52, 129–138, 2011.
Seeb, J. E., Carvalho, G., Hauser, L., Naish, K., Roberts, S., and Seeb, L. W.: Single-nucleotide polymorphism (SNP) discovery and applications of SNP genotyping in nonmodel organisms, Mol. Ecol. Resour., 1 (Suppl.), 1–8, 2011.
Wada, K., Okumura, K., Nishibori, M., Kikkawa, Y., and Yoko-hama, M.: The complete mitochondrial genome of the domestic red deer (Cervus elaphus) of New Zealand and its phylogenic position within the family Cervidae, J. Anim. Sci., 81, 551–557, 2010.
Weir, B. S. and Cockerham, C. C.: Estimating F-Statistics for the Analysis of Population Structure, Evolution, 38, 1358–1370, 1984.
Wiggans, G. R., Cooper, T. A., VanRaden, P. M., Olson, K. M., Tooker, M. E.: Use of the Illumina Bovine3K BeadChip in dairy genomic evaluation, J. Dairy Sci., 95, 1552–1558, 2012. Wright, S.: The Interpretation of Population Structure by
F-Statistics with Special Regard to Systems of Mating, Evolution, 19, 395–420, 1965.