Engineering
ISSN: 1809-4430 (on-line)
_________________________
1 Eng° A grônomo, Doutor, Syngenta Seeds, São Paulo - SP, Fone: (16) 3209-2666, [email protected]. 2 Eng° A grônomo, M estre, Departamento de Produção Vegetal, UNESP/Jaboticabal - SP, [email protected]. 3
Enga Florestal, Prof. Doutora, Departamento de Silvicultura, FATEC/Capão Bonito - SP, [email protected]. 4
Eng° A grônomo, Prof. Livre-Docente, Departamento de Produção Vegetal, UNESP/Jaboticabal - SP, [email protected]
SPRAY DEPOSITION AT TWO GROWTH STAGES OF CATTAIL
Doi:http://dx.doi.org/10.1590/ 1809-4430-Eng.Agric.v36n1p 194-205/ 2016
JOÃO R. V. SILVA1, ANTONIO C. DA SILVA JUNIOR2, MARIA R. R. PEREIRA3,
DAGOBERTO MARTINS4
ABSTRACT: Surfactant use in spray solutions has a major advantage of reducing droplet surface tension and increasing deposition. We aimed to evaluate droplet deposition on cattail plants (Typha
subulata) using food coloring (Brilliant Blue - FD & C-1) as marker added to spray solution at two
different growth stages: vegetative (4 leaves) and flowering (5 leaves). The treatments were arranged in a completely randomized design with four replications and five plants per plot (16.2-L tanks). Treatments consisted of adding into spray solutions Brilliant Blue alone (control), Brilliant Blue + 0.5% v/v Aterbane and Brilliant Blue + 0.01% v/v Silwet. Spraying was performed by a pressurized CO2 sprayer at 220 kPa using two Teejet XR 8002 nozzles at a spray volume of 200 L
ha-1. We observed that surfactant addition provided uniform deposition of spray solution on T. subulata plants at both growth stages compared to treatments without surfactant. However, this product has not increased spray deposits on cattail leaves at both stages.
KEYWORDS:Aterbane, droplet, Silwet, surfactant, Typha subulata
DEPOSIÇÃO DE CALDA DE PULVERIZAÇÃO EM DOIS ESTÁDIOS DE CRESCIMENTO DE TABÔA
RESUMO:O uso de surfactantes na calda de pulverização tem como principal vantagem a redução da tensão superficial das gotas na planta-alvo, que pode proporcionar aumento em sua deposição. O objetivo deste estudo foi avaliar a deposição de gotas com o uso do corante alimentício Azul Brilhante FD&C-1 utilizado como marcador de deposição, em duas fases de crescimento da planta aquática (Typha subulata) taboa, na fase de desenvolvimento vegetativo (4 folhas) e na fase de florescimento (5 folhas). Os tratamentos experimentais foram dispostos em um delineamento inteiramente casualizado, com quatro repetições, sendo utilizadas cinco plantas por caixa d’água (16,2 L). Os tratamentos foram: Azul Brilhante FD&C-1 (testemunha), Azul Brilhante FD&C-1 + 0,5% v/v de Aterbane e Azul Brilhante FD&C-1 + 0,01% v/v de Silwet na solução de pulverização. A aplicação dos tratamentos foi realizada com um pulverizador pressurizado com CO2 a 220 kPa,
utilizando duas pontas Teejet XR 8002, a um volume de 200 L ha-1. A adição dos surfactantes proporcionou deposição uniforme da calda de pulverização nos dois estádios de crescimento das plantas de T. subulata estudados, em relação à calda sem surfactante, porém seu uso não aumentou os depósitos nas folhas da taboa, em ambos os estádios de desenvolvimento.
PALAVRAS-CHAVE:Aterbane, gota, Silwet, surfactante, Typha subulata.
INTRODUCTION
The use of surfactants in herbicide sprays has as main benefit the reduction of droplet surface tension, which can increase deposition. MENDONÇA et al. (2007) and TERRA et al. (2014) observed increased droplet deposits on leaves of different crops by adding surfactants, such as Aterbane and Silwet, into spray solutions.
Cuticle surface physical and chemical properties determine leaf wettability and represent the first barrier against penetration of applied chemicals; thus, influencing product deposition, distribution and retention on plants. Plant surfaces may present distinct characteristics as being fully hygroscopic or even hydrophobic (WANG et al., 2014).
KISSMANN (1997) described sheath invaginations at base of cattail leaves, from which new leaf blades unfold without any apparent separation. These leaves are linear, erect, 1 to 2 m long and 4 cm wide, acuminate, without apparent veins and with a coriaceous consistency. Internally, they show multiple columns of rectangular compartments intercepted by alternating thicker and thinner transversal diaphragms, presenting externally one straight and one curved side.
Since cattail leaves grow almost upright, there have been carried studies on leaf wettability in order to decrease runoff of pesticides into water bodies. This way, surfactants have been used in spray solutions to decrease droplet surface tension, so increasing pesticide spreading and contact with the crop leaves; once it reduces the contact angle between liquid and leaf cuticle layer (MENDONÇA et al., 2007).
Typha spp., Brachiaria mutica (Forsk) Stapf, B. arrecta (Trin.) Hitchc, Echinochloa spp., and
Commelina spp. predominate in farming dams and irrigation and drainage channels, among other
aquatic sites. In irrigation channels, these plants reduce water flow, allowing greater infiltration to the soil, increasing losses by transpiration, as well as reducing crop efficiency.
These plants, especially Typha spp., may facilitate eroded material accumulation and reduce water storage capacity of reservoirs for further irrigation, besides decreasing their usable life. Cattail coverage has increased in many wetlands in response to increased sedimentation and hydrologic regime changes, which facilitate invasion (NEWMAN et al., 1998; GALATOWITSCH et al., 1999). Frequent disturbance by tillage and elevated salinity contribute to cattail spread (RALSTON et al., 2007)
Moreover, herbicide spray runoff into aquatic environments suggests the importance of studies regarding droplet deposition on aquatic plants to determine the extent of such damage. Determinations with different markers can be performed to evaluate deposition and drift losses. IOST & RAETANO (2010) explained that when these determinations are carried using phytosanitary products themselves bring high costs and sophisticated equipment, as well as trained personnel.
The objective of this study, carried out under controlled water runoff conditions, was to evaluate the use of a food coloring (Brilliant Blue – FD & C-1) as a marker, by assessing its deposition on leaves of cattail (Typha subulata Crespo & Peres-Moreau f.) at two different growth stages.
MATERIAL AND METHODS
We evaluated spray droplet deposition on cattail leaves at two growth stages. The first was considered as fully developed plants, including plants of up to 0.7 m in height (four leaves). The second was named as fully flowering (five leaves), in which at least 50% of plants within the reservoir had inflorescences. Four reservoirs with 16.2 L of water capacity were used; and five plants at both first and second stage were left in each reservoir, totaling about 218 plants per hectare.
v/ v). Surface tension of these solutions was determined by method described by MENDONÇA et al. (2007) and TERRA et al. (2014). We opted for food coloring since it is slowly degraded by light, which would allow us to evaluate the spray solution samples for longer periods (MENDONÇA et al, 2007; TERRA et al., 2014).
Since the most effective form of dispersal in this species is by vegetative reproduction, we used rhizomes from adult plants for plantings. Plants were cut and rhizomes separated, being later cut to a height of 15 cm. Each vegetative part consisted of at least 10-cm rhizome length and 15-cm stem height. We planted two vegetative propagules with these characteristics at each reservoir. Nitrogen fertilization was carried whenever necessary to maintain plant development.
Coloring solutions were sprayed during spring and fall at the first and second plant growth stages, respectively. Climate conditions at spraying time for both stages were the following: 28 ºC and 23 ºC of air temperature, 64% and 67% of relative humidity and 4 and 2 m s-1 of wind speed, respectively. The same application technology was used for both stages, using a CO2 pressurized
backpack sprayer, at constant pressure of 220 kPa, attached to a boom containing two Teejet XR 8002 flat- fan nozzles, which were 50 cm apart from each other, delivering 200 L ha-1. Neighboring plots were protected by a plastic tarp raised to a height of 2.5m.
Coloring solution was applied at a concentration of 3,000 mg L-1. Previously leaves were washed with 100 mL and 150 mL distilled water for the first and second stages, respectively. The BB solution was quantified after leaf washing at an optical density (absorbance) of 630 nm using a GBC UV–Visible Cintra 40 Spectrometer.
Therefore, we carried out readings of solutions washed off each leaf surface. Calibrations were performed through linear standard curves using solutions of known concentrations. The product concentration curves were obtained by linear regression and values were transformed into ppm. These values, obtained as mg L-1, were converted into the original conce ntration of the solution, i.e. dividing them by 100 and by 150 (distilled water volume used to wash leaf surface at both stages, in mL) and then by the initial concentration of BB in the solution. Once obtained, these values were divided by leaf area to obtain the amount of product deposited per area unit. The leaf area of each leaf sample was measured by a leaf area meter (CI-203 Handheld Laser Area Meter, CID, Inc., Vancouver, Washington, USA).
According to Equation 1, deposition data were adjusted to the Gompertz’s model into cumulative frequency (Y) in percentage, using the SAS statistical software. The model was simplified by the procedure described by VELINI (1995). We adopted the value of 4.6051 as parameter "a", so that "ea" is equal to 100. Non-cumulative frequency curves were presented (Y') for better visualization of the results, which corresponded to the first derivative of the above-mentioned model (Equation 2).
Gompertz’s model:
Cumulative frequency (%) (E1): (1)
Non-cumulative frequency or probability density (%) (E2): (2)
where,
a, b, and c = parameters of equation;
ea = 100; in which “a” is the maximum value of the curve’s asymptote;
b = curve displacement along the X axis;
c = curve slop or concavity in relation to the respective frequencies Y and Y’;
According to VELINI (1995), the first derivative corresponds to a non-cumulative frequency distribution curve (probability density function), or to an increment of cumulative frequencies when the corresponding values are increased by one unit.
Equation 3, described below, was used to calculate coefficients of variation:
CV = Standard deviation ×100/mean (3)
where,
CV = coefficient of variation;
Standard deviation = marker deposit percentage data;
Mean= mean for marker deposit percentage data.
The determination coefficients (R2) and residue square sums of the equations were used to assess Gompertz's model accuracy.
RESULTS AND DISCUSSION First Growth Cattail Stage
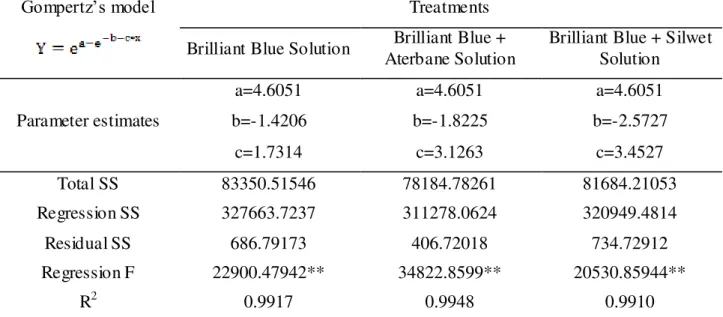
Deposit data were analyzed by regression and expressed in microliters per square centimeter, and adjusted to Gompertz’s model. Table 1 shows the regression analysis with coefficients of determination, F values at 1% probability, besides parameters used by the model for quantifying the amount of marker per squared centimeterof leaf surface. The coefficients of determination (R2) were 0.99176, 0.99486 and 0.991005 for treatments with BB, BB plus Aterbane and BB with Silwet, respectively. Given the high R2 values, the residual sum of squares (regression derivations) were low, indicating thus high precision of the Gompertz’s model for the first stage evaluation.
TABLE 1. Regression analyses results of marker deposit cumulative frequencies, in microliters per cm2 of leaf surface, for deposition on cattail leaves during the first growth stage, using
Gompertz’s model.
Gompertz’s model Treatments
Brilliant Blue Solution Brilliant Blue + Aterbane Solution
Brilliant Blue + Silwet Solution
Parameter estimates
a=4.6051 a=4.6051 a=4.6051
b=-1.4206 b=-1.8225 b=-2.5727
c=1.7314 c=3.1263 c=3.4527
Total SS 83350.51546 78184.78261 81684.21053
Regression SS 327663.7237 311278.0624 320949.4814
Residual SS 686.79173 406.72018 734.72912
Regression F 22900.47942** 34822.8599** 20530.85944**
R2 0.9917 0.9948 0.9910
Y=cumulative frequency percentage; X=marker deposit percentage in relation to total applied; a, b and c are model parameter estimates for their respective markers. ** Significant at 1% probability.
value of 50 on the y-axis. These values were found by drawing a straight line from the y-axis up to the curve and another from the curve up to the x-axis.
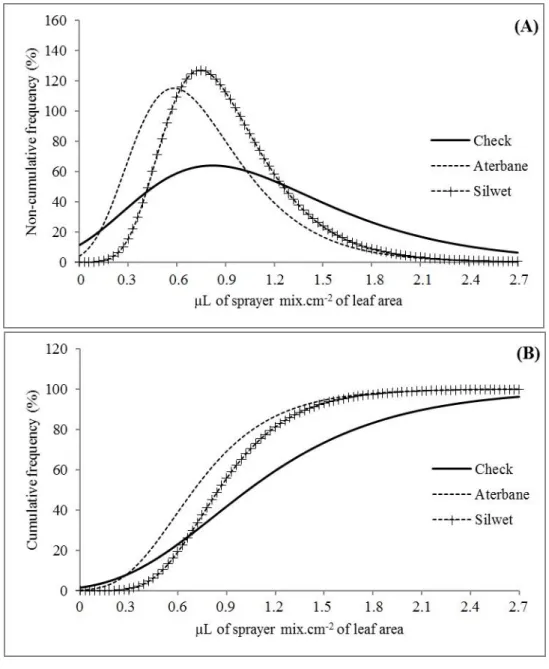
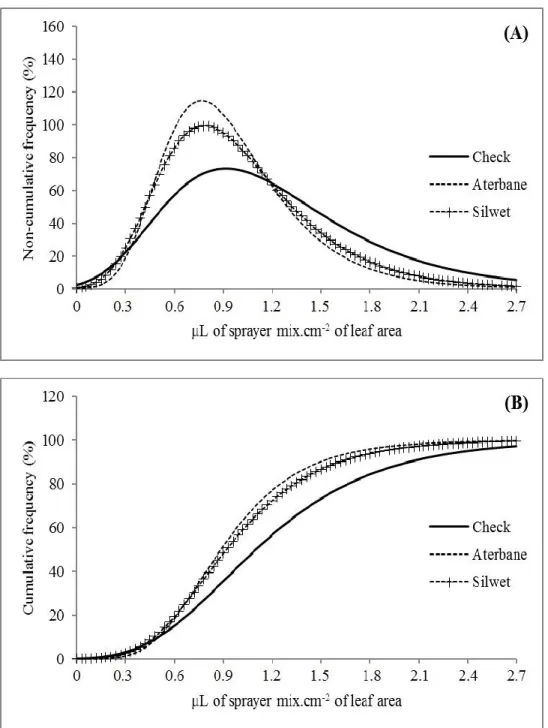
The non-cumulative frequency or probability density function corresponds to the first derivative frequency curve. The peaks shown on curve represent kurtosis, which, according to VELINI (1995), show the frequency of extreme values. It can be understood that the flatter the curve peaks, the larger the number of these values, and consequently, the more uneven they are. Agricultural spray uniform distribution is an important factor if sprayed product is to have a well-distributed absorption, mainly for contact products, which require larger coating areas, be it an insecticide, fungicide, or herbicide. One of the roles of surfactants is to promote an enhanced and precise uniform distribution of droplets.
FIGURE 1. (A) Non-cumulative frequencies (%) and (B) cumulative (%) as a function of deposition on plants, in microliters of sprayed mix per cm2 of leaf area, for coloring solution alone, coloring solution plus Aterbane, and coloring solution plus Silwet at the first spraying stage.
Graphs show cumulative frequency versus µLs of mix sprayed by cm2 leaf area, in which we can identify more or less steep slope. Steep curves indicate enhanced data dispersion and, consequently, greater single deposit variations.
addition could impair droplet quality. It can also be observed that, although surfactant addition standardized distribution, mean deposition was higher in control. Figure 1 also indicates that all surfactants promoted uniform droplet sizes compared to control.
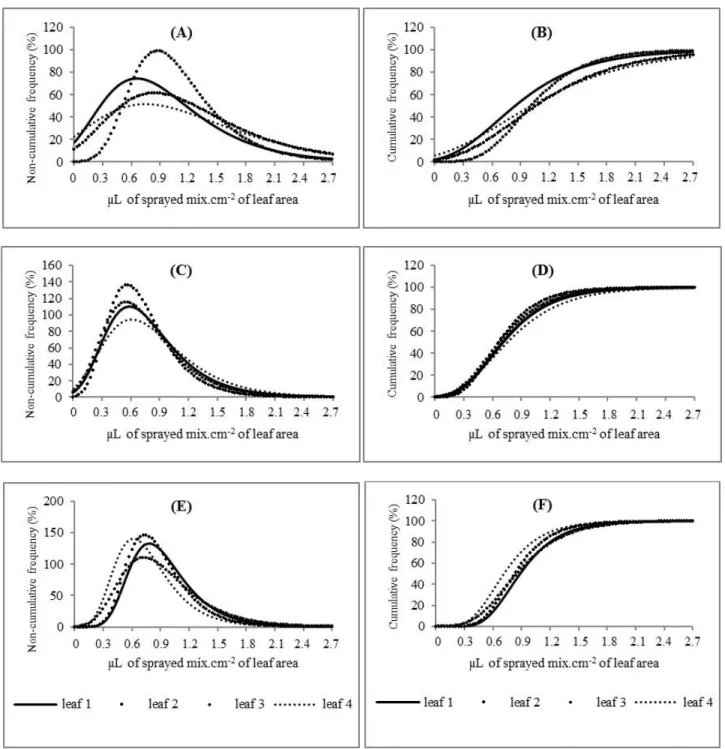
As mentioned above, lower distribution uniformity was found in control, corroborating results of the entire plant. In general, the best distribution was given by Silwet addition (Figure 2). It might have occurred because this adjuvant shows greater effectiveness of equilibrium dynamic surface tension and contact angle of zero degree (IOST & RAETANO, 2010).
FIGURE 2. Non-cumulative frequencies (%) and cumulative (%) as a function of depositions of brilliant blue coloring (A and B), brilliant blue coloring plus Aterbane (C and D) and brilliant blue coloring plus Silwet (E and F), in microliters of sprayed mix per cm2 of leaf area, values given by leaf at the first spraying stage.
Cumulative frequency means show the greater variation of unitary deposits, of which the best values were seen in treatment without surfactant (leaf 3); yet for brilliant blue plus Aterbane, it was seen for leaf 2. The addition of Silwet increased deposits on leaf 4 in detriment of others leaves.
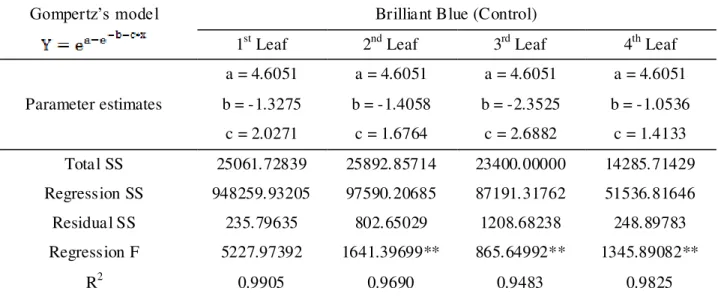
Table 2 presents the regression analysis results, coefficients of determination, F values of regression at 1% probability, as well as parameters used by the model for the amount of marker (in microliters) applied per cm2 of leaf area.
All leaf pairs receiving brilliant blue with Aterbane were fitted to the equation and had R² values ranging from 0.9771 to 0.9926, showing great adjustment to the selected model. Table 3 presents R², regression analysis results, F values for regression at 1%, and the parameters used by the model.
TABLE 2. Regression analyses results between brilliant blue deposit without the addition of surfactant and cumulative frequencies, in µL of mix.cm-2 of leaf area, using
Gompertz’s model for each leaf at the first spraying stage.
Gompertz’s model Brilliant Blue (Control)
1st Leaf 2nd Leaf 3rd Leaf 4th Leaf
Parameter estimates
a = 4.6051 a = 4.6051 a = 4.6051 a = 4.6051
b = -1.3275 b = -1.4058 b = -2.3525 b = -1.0536
c = 2.0271 c = 1.6764 c = 2.6882 c = 1.4133
Total SS 25061.72839 25892.85714 23400.00000 14285.71429
Regression SS 948259.93205 97590.20685 87191.31762 51536.81646
Residual SS 235.79635 802.65029 1208.68238 248.89783
Regression F 5227.97392 1641.39699** 865.64992** 1345.89082**
R2 0.9905 0.9690 0.9483 0.9825
Y=cumulative frequency percentage; X=marker deposit percentage in relation to total applied; a, b and c are model parameter estimates for their respective markers. ** Significant at 1% probability.
TABLE 3. Regression analyses results between deposit of brilliant blue added Aterbane and cumulative frequencies, in µL of mix.cm-2 of leaf area, using Gompertz’s model per leaf at the first spraying stage.
Gompertz’s model Brilliant Blue + Aterbane
1st Leaf 2nd Leaf 3rd Leaf 4th Leaf
Parameter estimates
a = 4.6051 a = 4.6051 a = 4.6051 a = 4.6051
b = -1.7513 b = -2.0952 b = -1.7410 b = -1.5577
c = 2.9949 c = 3.7093 c = 3.1266 c = 2.5606
Total SS 25892.85714 25892.85714 25892.85714 8571.42857
Regression SS 97800.43761 98083.1272 98202.19954 28409.78199
Residual SS 592.41953 309.72994 190.6576 161.64658
Regression F 2228.66709** 4275.08638** 6953.45802** 527.25733**
R2 0.9771 0.9880 0.9926 0.9811
Y=cumulative frequency percentage; X=marker deposit percentage in relation to total applied; a, b and c are model parameter estimates for their respective markers. ** Significant at 1% probability.
Gompertz’s model. Then, the parameter "c" refers to the curve slope, that is, the flatter the apex more uneven is the distribution of drops on the target; as consequence, the extreme values in droplet spectral composition become larger.
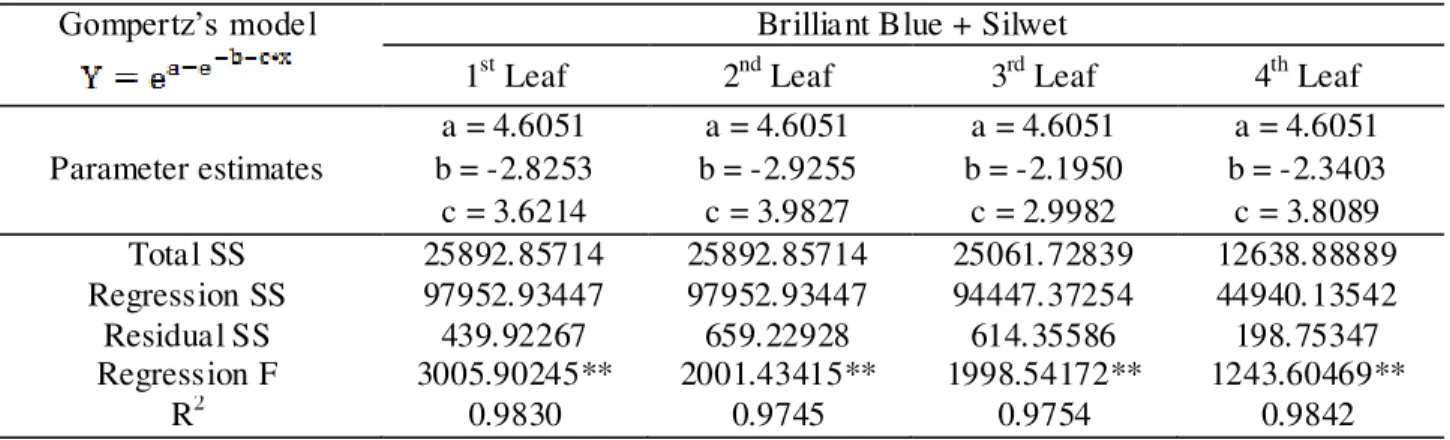
TABLE 4. Regression analyses results between deposit of brilliant blue added Silwet and cumulative frequencies, in µL of mix.cm-2 of leaf area, using Gompertz’s model per leaf at the first spraying stage.
Gompertz’s model Brilliant Blue + Silwet
1st Leaf 2nd Leaf 3rd Leaf 4th Leaf
Parameter estimates
a = 4.6051 a = 4.6051 a = 4.6051 a = 4.6051
b = -2.8253 b = -2.9255 b = -2.1950 b = -2.3403
c = 3.6214 c = 3.9827 c = 2.9982 c = 3.8089
Total SS 25892.85714 25892.85714 25061.72839 12638.88889
Regression SS 97952.93447 97952.93447 94447.37254 44940.13542
Residual SS 439.92267 659.22928 614.35586 198.75347
Regression F 3005.90245** 2001.43415** 1998.54172** 1243.60469**
R2 0.9830 0.9745 0.9754 0.9842
Y=cumulative frequency percentage; X=marker deposit percentage in relation to total applied; a, b and c are model parameter estimates for their respective markers. ** Significant at 1% probability.
Evaluating isolated spray mix deposits on aquatic plants is crucial both for achieving an effective control and for reducing runoff into watercourses. KISSMANN (1997) made reports on the effect of growth erect habit of cattail leaves with one flat and another curved side on withstanding wind action. Each leaf has a different insertion angle, which change as plant grows. Surfactants are responsible for breaking water surface tension as it falls onto leaves, increasing surface coverage. However, overuse of these products or in very high spray- volumes may increase runoff, carrying the active ingredient for the environment, increasing impacts.
Second Growth Cattail Stage
Single marker depositions on the second growth stage of cattail plants were also fitted by
Gompertz’s model. Coefficients of determination (R2) were higher than 0.97902, indicating a high
precision fits. Table 5 shows the regression analysis results between marker deposit and cumulative frequencies.
TABLE 5. Regression analyses results between marker deposit and cumulative frequencies, in µL of mix.cm-2 of leaf area, for the second deposition stage on cattail plants.
Gompertz’s model Treatments
Brilliant Blue Solution Brilliant Blue + Aterbane
Solution
Brilliant Blue + Silwet Solution
Parameter estimates
a=4.605170 a=4.605170 a=4.605170
b=-1.828959 b=-2.391420 b=-2.117768
c=1.997064 c=3.119475 c=2.701003
Total SS 80851.06383 76685.39326 74186.04651
Regression SS 316654.4639 301131.2129 291342.1037
Residual SS 1969.59991 554.18037 343.94279
Regression F 8678.78886** 23908.79022** 36000.25005**
R2 0.97902 0.99277 0.99536
A previously observed at the first stage, Figure 3 shows that surfactant addition increased deposition uniformity. A smaller value for the “c” parameter in Gompertz’s model can also be observed, which represents a greater lack of data uniformity (Table 5). Again, on average terms, the addition of surfactant decreased the amount of mix.cm-2 of leaf area.
FIGURE 3. (A) Non-cumulative frequencies (%) and (B) cumulative (%) as a function of plant deposition, in microliters of sprayed mix per cm2 of leaf area, for coloring solution alone, coloring solution plus Aterbane, and coloring solution plus Silwet at the second spraying stage.
TABLE 6. Regression analyses results between brilliant blue deposit and cumulative frequencies, in µL of mix.cm-2 of leaf area, using Gompertz’s model per leaf at the second spraying stage.
Gompertz’s model Brilliant Blue (Control)
1st Leaf 2nd Leaf 3rd Leaf 4th Leaf 5th Leaf
Parameter estimates
a = 4.6051 a = 4.6051 a = 4.6051 a = 4.6051 a = 4.6051 b = -2.0147 b = -1.5994 b = -1.6955 b = 2.8396 b = -1.8134
c = 2.5998 c = 1.8005 c = 1.7698 c = 2.8259 c = 2.3048 Total SS 19250.0000 19250.0000 19250.0000 19250.0000 14285.7143 Regression SS 70663.4280 71325.7764 71438.7920 70817.8571 51612.5289 Residual SS 1086.57201 424.2236 311.2080 932.41429 173.18539 Regression F 1597.259** 1597.259** 2180.755** 721.5323** 1937.123**
R2 0.9735 0.9779 0.9838 0.9515 0.9878
Y=cumulative frequency percentage; X=marker deposit percentage in relation to total applied; a, b and c are model parameter estimates for their respective markers. ** Significant at 1% probability.
TABLE 7. Regression analyses results between deposit of brilliant blue added Aterbane and cumulative frequencies, in µL of mix.cm-2of leaf area, using Gompertz’s model per leaf at the second spraying stage.
Gompertz’s model Brilliant Blue + Aterbane
1st Leaf 2nd Leaf 3rd Leaf 4th Leaf 5th Leaf
Parameter estimates
a = 4.6051 a = 4.6051 a = 4.6051 a = 4.6051 a = 4.6051 b = -2.2781 b = -2.9546 b = -2.0800 b = -2.4698 b = -3.9084
c = 3.4833 c = 4.2807 c = 2.7780 c = 2.8216 c = 4.5480 Total SS 18421.0526 19250.0000 18421.0526 19250.0000 11818.1818 Regression SS 68186.1979 71412.8358 67758.5695 71024.5645 41611.9958 Residual SS 234.85474 337.64237 662.48307 725.43552 206.18599 Regression F 2613.001** 2012.141** 920.5173** 930.1080** 1009.089**
R2 0.9872 0.9824 0.9640 0.9623 0.9825
Y=cumulative frequency percentage; X=marker deposit percentage in relation to total applied; a, b and c are model parameter estimates for their respective markers. ** Significant at 1% probability.
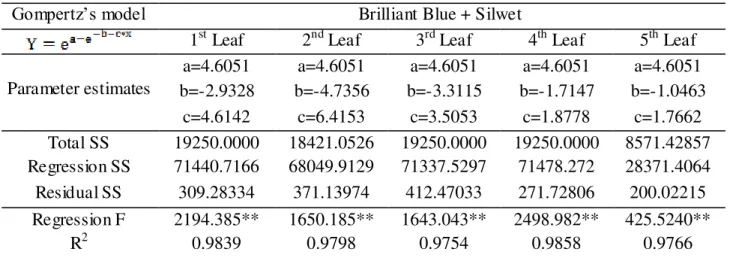
TABLE 8. Regression analyses results between deposit of brilliant blue added Silwet and cumulative frequencies, in microliters of mix per cm2 of leaf area, using Gompertz’s model per leaf at the second spraying stage.
Gompertz’s model Brilliant Blue + Silwet
1st Leaf 2nd Leaf 3rd Leaf 4th Leaf 5th Leaf
Parameter estimates
a=4.6051 a=4.6051 a=4.6051 a=4.6051 a=4.6051 b=-2.9328 b=-4.7356 b=-3.3115 b=-1.7147 b=-1.0463
c=4.6142 c=6.4153 c=3.5053 c=1.8778 c=1.7662 Total SS 19250.0000 18421.0526 19250.0000 19250.0000 8571.42857 Regression SS 71440.7166 68049.9129 71337.5297 71478.272 28371.4064 Residual SS 309.28334 371.13974 412.47033 271.72806 200.02215
Regression F 2194.385** 1650.185** 1643.043** 2498.982** 425.5240**
R2 0.9839 0.9798 0.9754 0.9858 0.9766
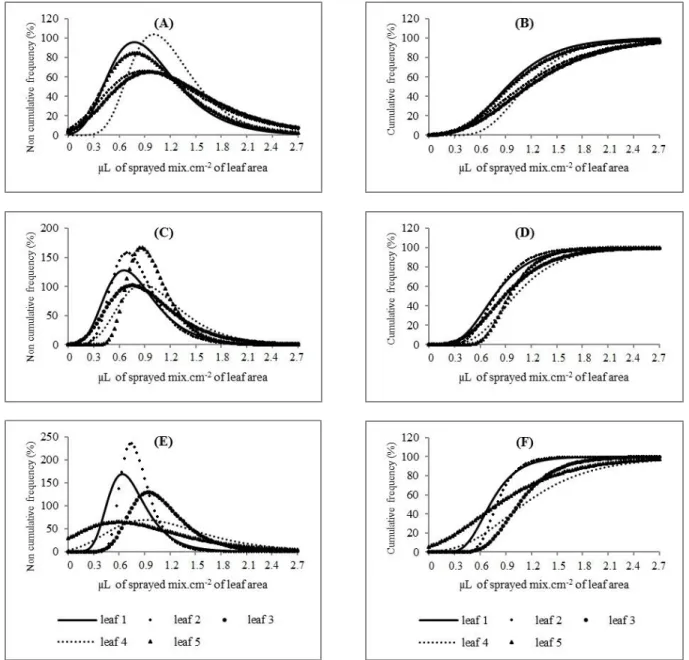
From the non-cumulative frequency graph, we noted that leaf 4 without surfactant addition showed the greatest variation in deposit uniformity, with a higher kurtosis. When adding Aterbane and Silwet, leaf 5 and 2 had the greatest variations in deposit uniformity, respectively (Figure 4).
By cumulative frequency data (%), we can observe that the best results were obtained for leaf 4 without surfactant; however, when Aterbane was added, the leaf 5 curves presented steeper slopes, the same as leaf 4 with the addition of Silwet.
FIGURE 4. Non-cumulative frequencies (%) and cumulative (%) as a function o f deposition of brilliant blue coloring solution (A and B), brilliant blue coloring solution plus Aterbane (C and D) and brilliant blue coloring solution plus Silwet (E and F), in µL of sprayer mix.cm-2 of leaf area, per leaf at the second spraying stage.
CONCLUSIONS
Surfactant addition provided uniform deposition of spray solution on cattail leaves in both vegetative and flowering stages. However, spray solutions without surfactant did not increase droplet deposition on plants in both phases.
REFERENCES
BUTLER-ELLIS, M.C.; MILLER, P.C.H. The effect of some adjuvants on sprays produced by agricultural flat fan nozzles. Crop Protection, Guildford, v.16, n.1, p.41-50, 1997.
CARBONARI, C.A.; MARTINS, D.; MARCHI, S.R.; CARDOSO, L.R. Efeito de surfactantes e pontas de pulverização na deposição de calda de pulverização em plantas de grama-seda. Planta Daninha, Viçosa, v.23, n.4, p.725-729, 2005.
GALATOWITSCH, S.M.; ANDERSON, N.O.; ASCHER, P.D. Invasiveness in wetland plants in temperate North America. Wetlands, Amsterdam, v.19, n.4, p.733-755, 1999.
IOST, C.A.R.; RAETANO, C.G. Tensão superficial dinâmica e ângulo de contato de soluções aquosas com surfactantes em superfícies artificiais e naturais. Engenharia Agrícola, Jaboticabal, v.30, n.4, p.670-680, 2010.
KISSMANN, K.G. Plantas infestantes e nocivas. 2. ed. São Paulo: BASF, 1997, tomo I, 825p.
MENDONÇA, C.G.; RAETANO, C.G.; MENDONÇA, C.G. Tensão superficial estática de soluções aquosas com óleos minerais e vegetais utilizados na agricultura. Engenharia Agrícola, Jaboticabal, v.27, p.16-23, jan. 2007. Número Especial.
MEUSEL, I.; LEISTNER, E.; BARTHLOTT, W. Chemistry and micromorphology of compound epicuticular wax crystalloids (Strelitzia type). Plant Systematics and Evolution, Vienna, v.193, n.1, p.115-123, mar.1994.
NEGRISOLI, E.; TOFOLI, G.R.; VELINI, E.D.; MARTINS, D.; PALLADINI, L.A. Depósitos unitários de calda de pulverização com e sem surfatante em plantas de Salvinia molesta. Planta Daninha, Viçosa, v. 20, p. 51-56. 2002. Edição Especial.
NEWMAN, S.; SCHUETTE, J.; GRACE, J.B.; RUTCHEY, K.; FONTAINE, T.; REDDY, K.R; PIETRUCHA, M. Factors influencing cattail abundance in the northern Everglades. Aquatic Botany, Amsterdam, v.60, n.3, p.265-280, 1998.
RALSTON, S.T.; LINZ, G.M.; BLEIER, W.J.; HOMAN, H.J. Cattail distribution and abundance in North Dakota. Journal Aquatic Plant Manage, Gainesville, v.45, n.1, p.21-24. 2007.
RODRIGUES, A.C.P.;MARTINS, D.; COSTA, N.V.; PEREIRA, M.R.R. Aspectos quantitativos da deposição de gotas de pulverização em plantas de amendoim e Brachiaria plantaginea. Planta Daninha, Viçosa, v.30, n.1, p.201-209, 2012.
TERRA, M.A.; MARTINS, D.; COSTA, N.V., MARCHI, S.R. Avaliação de pontas e taxas de aplicação na deposição de calda no milho e em planta daninhas. Bioscience Journal, Uberlândia, v.30, n.6, p.1661-1670, 2014.
VELINI, E.D. Estudos e desenvolvime nto de métodos experimentais e amostrais adaptados à matologia. 1995. 250f. Tese (Doutorado em Produção Vegetal) - Universidade Estadual Paulista, Faculdade de Ciências Agrárias e Veterinárias, Jaboticabal, 1995.
VIGANO, L.L.S.; RAETANO, C.G. Assistência de ar e volume de aplicação na deposição de calda e no controle do arroz vermelho (Oryza sativa L.). Engenharia Agrícola, Jaboticabal, v.27, n.3, p.734-741, 2007.