QUANTIFICATION OF CO
2EMISSION
Vigor de sementes de canola quantificado pela liberação de CO2
João Alexandre Lopes Dranski1, Artur Soares Pinto Júnior2, Neusa Francisca Michelon Herzog2,
Ubirajara Contro Malavasi3, Marlene de Matos Malavasi3, Vandeir Francisco Guimarães3
ABSTRACT
Seed marks the beginning of grain production from cultivated crops. Ensuring seed quality is the priority in the field of seed technology. In this context, the purpose of this study was to evaluate the use of carbon dioxide concentration to classify
Brassica napus seed lots of different quality resulting from various sowing dates. Seed lots were evaluated by percentage of normal plantlets and the germination rate index. CO2 concentration was quantified in samples submitted to five periods of incubation at 40° C with the aid of a gas exchange analyzer coupled to an injection and airflow system. The results were subjected to analysis of variance and the mean values were compared by the Duncan test and by regression analysis at the 5% level of significance. B. napus seeds from all lots showed a high percentage of normal plantlets and germination rate index. Percentage of
normal plantlets was correlated with CO2 concentration. Determination of the CO2 concentration was more efficient with three hours of incubation which allowed classification of canola seed lots into four vigor classes. CO2 concentration was inversely proportional to the percentage of normal plantlets.
Index terms: Brassica napus L., seed respiration, infrared gas analyser, physiological quality.
RESUMO
A semente marca o inicio da produção de grãos de plantas cultivadas. Assegurar a qualidade da semente é a prioridade da tecnologia de sementes. Neste contexto, o trabalho objetivou aferir o uso da concentração de dióxido de carbono na classificação de sementes de Brassica napus de diferentes níveis de qualidade resultante de diferentes datas de semeadura. nos quais avaliou-se a porcentagem de plântulas normais e o índice de velocidade de germinação. A concentração CO2 foi quantificada em amostras mantidas por cinco períodos de incubação a 40 °C e mensuradas com o auxílio de um medidor de trocas gasosas, acoplado a um sistema de injeção e fluxo de ar. Os resultados foram submetidos à análise de variância e as médias comparadas pelo teste de Duncan e pela análise de regressão a 5%. Os resultados da porcentagem de plântulas normais foram correlacionados com os
resultados da concentração de CO2. Sementes de B. napus apresentaram alta porcentagem de plântulas normais. Contudo, para o
índice de velocidade de germinação houve possibilidade de classificação em pelo menos duas classes de vigor. A determinação da concentração de CO2 foi mais eficiente após três horas de incubação, sendo possível agrupar os lotes em quatro classes de vigor.
A concentração de CO2 foi inversamente proporcional à porcentagem de plântulas normais, com melhor coeficiente de correlação
obtido após três horas de incubação.
Termos para indexação: Brassica napus L., respiração de sementes, analisador infravermelho de gases, qualidade fisiológica.
(Received in january 18, 2013 and approved in april 1, 2013)
INTRODUCTION
Seed quality results from the aggregate of genetic, physical, physiological, biochemical, agro-climatic and seed health components that affect the capacity of producing plants with greater yield (MARCOS-FILHO, 2005). Currently, the greatest interest in quantifying the physiological quality of seeds is bound up with the importance of obtaining rapid and reliable results that aid in decision making at different stages of seed production and storage.
1Universidade Estadual do Oeste do Paraná/UNIOESTE – Programa de Pós-graduação em Agronomia – Rua Pernambuco – 1777 – 85960-000 –
Marechal Cândido Rondon – PR - Brasil – joaodranski@yahoo.com.br
2Universidade Estadual do Oeste do Paraná/UNIOESTE – PR – Brasil
3Universidade Estadual do Oeste do Paraná/UNIOESTE – Centro de Ciências Agrárias – PR – Brasil
The most studied rapid vigor tests are related to the initial events of the deterioration process, such as degradation, loss of selectivity of cellular membranes, and changes in respiratory activity (BRADFORD et al., 2008). With the beginning of hydration, gene transcription and translation are resumed in orthodox seeds, culminating in catabolic activation of enzymes. All these physiological processes require consumption of energy generated by aerobic as well as anaerobic respiration.
catabolized in the citric acid cycle, generating cofactors (NADH, FADH2 and CO2) in the mitochondrial matrix, which will be oxidized for formation of water and ATP in the mitochondrial cristae during the electron transport chain (WEITBRECHT et al., 2011). The glycolytic phase of respiration is the primary source of ATP production in the absence of operability of the inner mitochondrial membrane (TAIZ; ZEIGER, 2009). According to Bewley and Black (1994), the mitochondria are known for being the primary sites of seed deterioration, reducing energy generation capacity by the aerobic pathway, providing for increased participation in energy generation by the anaerobic pathway. Therefore, quantification of CO2 concentration resulting from respiration may be an indicative of vigor because seeds with greater physiological potential are capable of minimizing deterioration of the cell membranes and, consequently, efficiency in oxidation of sugars is greater, generating less CO2 in comparison with seeds with less vigor (BUCKLEY; HUANG, 2011).
The most widely used test for evaluation of respiratory activity of seeds is the tetrazolium test. The test qualifies the reduction of the triphenyltetrazolium chloride by the activity of dehydrogenase enzymes in the citric acid cycle, producing formazan in different intensities, according to the viability of the tissues (DELOUCHE et al., 1976). The test exhibits some limitations, such as seed size which reduces direct observation of the embryo, and the somewhat empirical results due to visual acuity to colors.
Respiratory activity may be quantified by means of determination of carbon dioxide released by the respirator y process th rough titration or gas chromatography (CRISPIN et al., 1994; MENDES et al., 2009; BUCKLEY; HUANG, 2011). However, those tests require time and labor and have high operational cost, limiting their utilization in seed analysis. Alternatively, CO2 release can be quantified by an infrared gas analyzer (IRGA). The use of an IRGA allows for non destructive sampling of individual as well as several seeds without relying on visual acuity inherent to the tetrazolium method in spite of the equipment price.
The purpose of the present study was to evaluate the use of carbon dioxide concentration with an infrared gas analyser in classification of Brassica napus L. seeds
of different levels of quality.
MATERIAL AND METHODS
The experiment was developed in the Seed and Seedling Technology and Physiology Laboratory of the Universidade Estadual do Oeste do Paraná (West Parana
State University), campus of Marechal Cândido Rondon in July and August of 2012.
The treatments comprised five lots of Brassica napus seeds of the Loyola 61 cultivar (Embrapa Trigo),
with different sowing dates (04/14/11, 04/27/11, 05/11/11, 05/25/11 and 06/08/11) which hereinafter will be designated as lots 1, 2, 3, 4 and 5, respectively. The seeds were collected according to the phenology of the species and were kept in Kraft paper bags. Seed lots were stored under laboratory conditions (25.0o C ± 3.0o C) for one year before essay.
Seed lots were characterized through germination test, moisture content and one thousand seed weight.
The germination tests was conducted with four replications of 50 seeds per lot in blotting paper substrate, kept in Gerbox® boxes maintained in BOD at 20.0 ± 2.0o C
with the results expressed in percentage of seeds producing normal plantlets seven days after sowing (BRASIL, 2009). Seed moisture content was obtained through drying in a laboratory oven at 105o C for 24 hours
four replications of 2 g of seeds per lot. The 1000 seed weight used the gravimetric method of one-hundred-seed subsamples followed by drying in a laboratory oven at 60 ± 2.0o C until constant weight (BRASIL, 2009).
Vigor tests were comprised of the percentage of normal seedlings obtained in the field and the germination rate index of four repetitions of 25 seeds each. To perform the field test, canola seeds were sown in plastic trays filled with local soil and kept in full sun for 21 days after sowing (ÁVILLA et al., 2005). Mean temperature during the experimental period was 20.0 ± 9.0o C.
The germination rate index was conducted together with the normal seedling percentage test, noting on a daily basis the number of seedlings that exhibited totally expanded cotyledon leaves and the first definitive leaf. At the end of the test, with the daily data on the number of emerged seedlings, the emergence speed index was calculated using the equation proposed by Maguire (1962). Quantification of CO2 was obtained through peak concentration of CO2 released during respiration with the aid of a gas exchange analyzer (LI-COR 6400 XT). In preparation of the sample, 1.5 g of seeds with deionized water was used, the volume being that which allowed reaching a moisture level of 30% (w/w) according to equation 1, and placed in 60 mL glass containers with a lid for injectables duly sealed. The containers were then incubated in BOD type chambers at 40o C.
seed
total 30% M
M =
[1- 0.
Where: Mtotal 30% represents the total mass obtained in the sum of the sample with the mass of the water to be added; Msem represents the biomass of the sample.
Since the equipment had low gas suction capacity, a system for injection and flow of CO2-free air was set up with an air compressor Master Super II® with discharge
of 1.5 m s-1, which injected air in a 60 mL vial filled with
soda lime duly sealed and with a lid for injectables. For connecting the system formed by the compressor, container with soda lime and vial with the sample, plastic tubing were used (3.0 mm diameter and 15 cm length) connected by disposable hypodermic needles (1.6 mm x 40 mm).
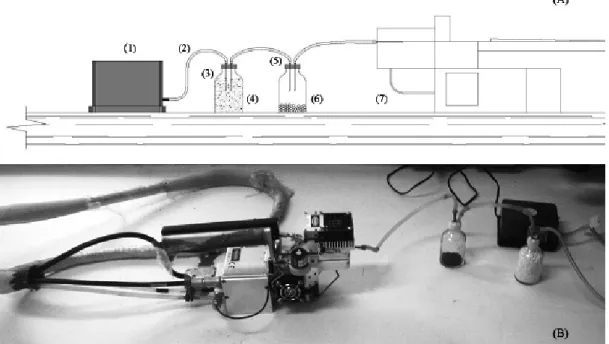
On the equipment, a segment of plastic hose with the same characteristics described above was connected, with one end fastened in the IRGA gas chamber and the other inserted in the vial of the sample. Then, in the act of taking a reading, two needles were inserted in the vial with the sample and, subsequently, the air injection and flow system was connected simultaneously with the equipment detailed in figure 1.
The readings of carbon dioxide concentration were quantified in five time periods comprised of the first 30 minutes, and then after 1, 3, 6 and 9 hours of incubation. To obtain the value of each replication, the equipment was
Figure 1 – Diagram of the system used to quantify CO2 released by respiration of Brassica napus seeds(A) in which
(1) ar compressor; (2) plastic tubing; (3) disposable hipodermic needle; (4) container with soda lime; (5) container lid for injectables; (6) sample vial; (7) IRGA gas chamber. Photo of the apparatus (B).
programmed to record the CO2 concentration every 0.5 seconds for 30 seconds. The reading interval between the samples did not last more than one minute.
The peak computed concentration was used and the results were expressed in µmol CO2 gram-1 of seeds.
The experiment was carried out in a randomized block design composed of four replications. A 5 x 5 factorial arrangement was adopted for the CO2 concentration formed by five lots and five incubation periods while for the percentage of normal seedlings germinated in the field, the factorial arrangement was composed by five lots and 21 days.
Table 2 – Summary of analysis of variance of the parameters evaluated regarding the physiological quality of Brassica napus seeds.
SV – sources of variation; GF – degrees of freedom; MS – mean square error; CO2 – carbon dioxide concentration; PN – percentage of normal seedlings; IVG – germination rate index.
RESULTS AND DISCUSSION
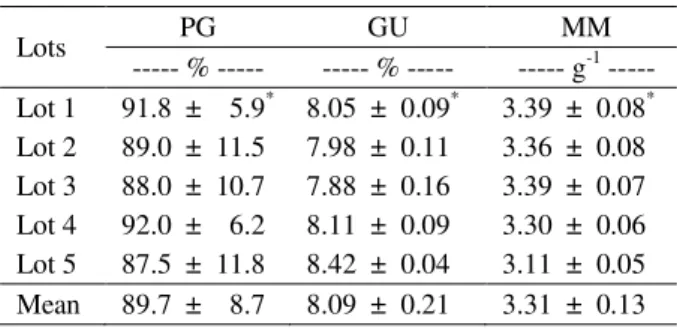
Characterization of plant material (Table 1) indicated that the B. napus seeds showed a high
germination 89.7% (± 8.7%), with moisture content of 8.09% (± 0.21%) and thousand seed weight of 3.31 g (± 0.13 g). Germination result was higher than the minimum of 80% described in the Normative Instruction no.60 from the Ministry of Agriculture, Livestock and Supply which establish identity and quality standards for production of canola seeds.
The summary of analysis of variance for vigor tests (Table 2) showed interaction (P< 0.05) between seed lot and period for CO2 concentration and percentage of
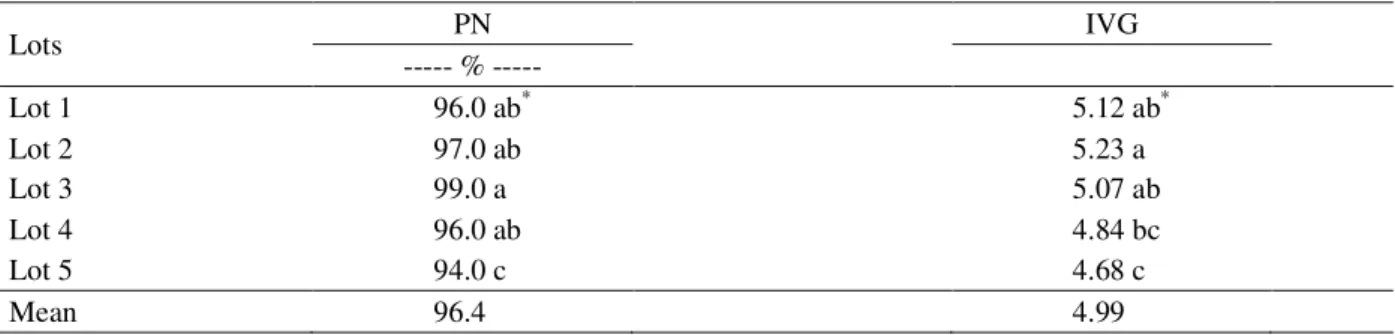
normal seedlings. Seed lot 3 had the greatest (99.0%) percentage of normal seedlings 21 days after sowing, similar to lots 1, 2 and 4 (Table 3), while the smallest percentage was computed with seeds from lot 5 which showed a reduction of 3.1% in relation to the mean value of the other treatments.
Germination rate index indicated that lots 1, 2 and 3 showed a greater germination rate (Table 3), which represents greater uniformity of the germination process. Lower mean values were calculated for lots 4 and 5, which showed a reduction of 7.3% in relation to the mean value of the other treatments. Based on the tests performed, the possibility of classifying seeds from the five lots in at least two vigor classes is noted. The greater vigor class corresponded to lots 1, 2 and 3 with the lesser vigor corresponding to lots 4 and 5.
After carrying out the test for equality of regressions parameters in relation to time (days after sowing) within the lots for percentage of normal seedlings, it was possible to substitute the five equations by the Gompertz sigmoidal mathematical model with four parameters (P< 0.05). The highest percentage of normal seedlings (95.9%) was tallied on the tenth day after sowing (Figure 2).
In relation to carbon dioxide concentration, it was found that the method was effective in classifying B. napus seeds of different vigor classes with at least one
Table 1 – Germination percentage (PG), moisture content (GU) and thousand seed weight (MM) of Brassica napus
according to lot.
*Standard deviation of the mean.
Parameters SV GF MS P value C.V. (%)
CO2
Block 3 44014.84 <0.01
5.1
Period (P) 4 14310530.00 <0.01
Lot (L) 4 88192.85 <0.01
P x L 16 34145.27 <0.01
Error 72 4858.07
PN
Block 3 119.8095 <0.01
4.4
Period (P) 20 228.1333 <0.01
Lot (L) 4 25636.44 <0.01
P x L 80 61.13333 <0.01
Error 312 11.80952
IVG
Block 3 0.054 0.42
4.6
Lot 4 0.200 0.03
Error 12 0.053
Lots PG GU MM
--- % --- --- % --- --- g-1 ---
Lot 1 91.8 ± 5.9* 8.05 ± 0.09* 3.39 ± 0.08*
Lot 2 89.0 ± 11.5 7.98 ± 0.11 3.36 ± 0.08
Lot 3 88.0 ± 10.7 7.88 ± 0.16 3.39 ± 0.07 Lot 4 92.0 ± 6.2 8.11 ± 0.09 3.30 ± 0.06 Lot 5 87.5 ± 11.8 8.42 ± 0.04 3.11 ± 0.05
Table 3 – Percentage of normal seedlings (PN) and germination rate index (IVG) of Brassica napus according to lot.
Y = -0.0371 + 95.8842 * Exp{ -Exp [ - (X - 4.0949) / 0.5497}} R2 = 0.99 P< 0.0001
Days after sowing
1 2 3 4 5 6 7 8 9 10 11 12 13 14 15 16 17 18 19 20 21
P
er
ce
nt
ag
e
of
n
or
m
al
s
ee
dl
in
gs
(
%
)
0 20 40 60 80 100
Lot 1 Lot 2 Lot 3 Lot 4 Lot 5
Figure 2 – Percentage of normal seedlings obtained from Brassica napus seeds as a function of lot and germination time.
*The mean values within each column followed by the same letter do not differ among themselves by the Duncan test at 5% probability. hour of incubation and up to three hours (Table 4)
because in the first thirty minutes and after six hours of incubation differences among the treatments were not observed (P> 0.05). The period of three hours of incubation allowed the greatest segregation among the seed lots resulting in four classes. Lots 3, 2 and 1displayed the lowest mean values of carbon dioxide concentration. Upon comparing these results with the results of the vigor tests (Table 3), it is notable that the same lots presented the greatest mean values for percentage of normal seedlings and for the germination rate index.
The lack of statistical difference in CO2 concentration observed in the first thirty minutes of incubation (Table 4) may be related to the lack of organization of inner mitochondrial membranes as a result of seed water status. According to Marcos-Filho (2005), the mitochondria of orthodox seeds at the beginning of the imbibition process do not display an organized system of membranes and reorganization occurs as the hydration process proceeds. Therefore, performance of the seed lots analyzed may be observed as a consequence of the time necessary for the inner mitochondrial membranes to become more efficient and organized.
Lots PN IVG
--- % ---
Lot 1 96.0 ab* 5.12 ab*
Lot 2 97.0 ab 5.23 a
Lot 3 99.0 a 5.07 ab
Lot 4 96.0 ab 4.84 bc
Lot 5 94.0 c 4.68 c
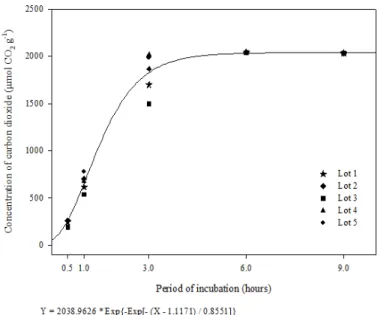
Figure 3 – Concentration of CO2 released by the respiration process of Brassica napus seeds according to lot and
incubation period.
Table 4 – Concentration of CO2 released by the respiration process of Brassica napus seeds as a function of lot and
incubation period.
* The mean values within each column followed by the same letter do not differ among themselves by the Duncan test at 5%
probability.
Performance of the test for equality of the regression parameters as a function of period of incubation within seed lots for carbon dioxide concentration allowed the substitution of the models adjusted for each lot by the Gompertz sigmoidal mathematical model with three parameters (P< 0.05). The highest level of carbon dioxide concentration was observed with 7:15 hours of incubation, corresponding to 2038.96 µmol CO2 per gram of seed (Figure 3).
It is probable that oxygen consumption was inversely proportional to CO2 emission in Brassica napus
seeds, as reported by Buckley & Huang (2011) and Millar
et al. (2011) indicating that seeds with greatest vigor resulted in less oxygen consumption and in less CO2 emission. Therefore, the lack of differences observed with 7:15 hours of incubation (Figure 3) may indicated that total oxygen consumption present in the vial was capable of maintaining the aerobic respiratory activity of the seeds. The highest level of oxygen consumption was shown by Bradford et al. (2012) by means of the equipment ASTEC Q2® and indicated that the time for obtaining 50% oxygen
depletion was positively correlated with vigor parameters of 17 planted species.
Lots Incubation time (hours)
0.5 1.0 3.0 6.0 9.0
--- µmol CO2 g-1 ---
Lot 1 244.25 a* 616.59 c* 1698.26 c* 2042.59 a* 2033.76 a*
Lot 2 262.53 a 704.54 bc 1866.22 b 2043.30 a 2033. 94 a
Lot 3 189.29 a 538.59 c 1496. 50 d 2040.50 a 2035.77 a
Lot 4 263.62 a 679.88 ab 2016.10 a 2044.21 a 2036.30 a
Lot 5 254.52 a 778.83 a 1987.43 a 2047.06 a 2039.85 a
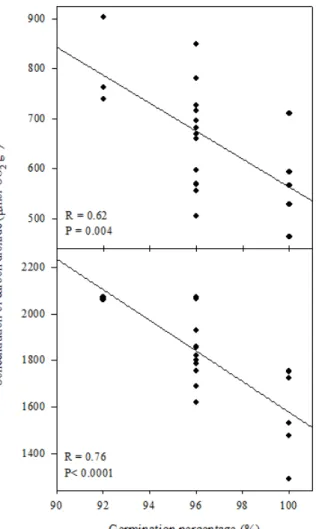
Figure 4 – Correlation between germination percentage and concentration of carbon dioxide released by respiration of Brassica napus seeds after one hour (A)
and after three hours (B) of incubation.
Linear correlation showed that the carbon dioxide concentration was inversely proportional to the percentage of normal seedlings for the periods of 1 and 3 hours of incubation (Figure 4). For the other periods, there was no difference (P> 0.05). The period of one hour displayed lower correlation (R= 0.62; P= 0.004) when compared to the period of three hours (R= 0.76; P<0.001) indicating that, in this period, there is greater correspondence between the results quantified in the laboratory with those from the field test. Pearson correlation coefficients (Figure 4) showed values of moderate intensity between percentage of normal plantlets and CO2 concentration. The intensity of a linear relationship between two random variables can be measure by Pearson correlation coefficient according to Ferreira (2009).
Seed performance in the field is a complex characteristic related to the environmental, physiological and genetic aspects of seeds which cannot be measured in a single location or with few replications (MARCOS-FILHO, 2005; KODDE et al., 2012).
The association between seed vigor and carbon dioxide emission may be positively or negatively correlated by the method of determination. Mendes et al. (2009) and Aumonde et al. (2012) reported a positive relationship between the germination percentage and the vigor parameters with the carbon dioxide concentration in Glicine max (L.) Merr. and Vigna unguiculata (L.) Walp seeds,
respectively, using the Pettenkofer equipment.
On the other hand, Crispin et al. (1994), Buckley and Huang (2011) and Kodde et al. (2012) reported the opposite trend in seeds of G. max,B. napus and Brassica oleracea L.
respectively with the use of titration or by gas chromatography. The difference in results may result from incubation temperature. Pettenkofer method uses 25o C while other methods use 40o C.
Therefore, seeds with reduced respiration under high temperature are capable of showing less deterioration damage by maintaining higher proportion of reserve compounds. Additionally, higher seed vigor is positively associated to higher production of ATP and cofactors which benefits germination at a temperature of 25o C.
The results displayed suggested the need for more investigation regarding adjustment of the method in regard to the size of the sample and of the container, the temperature, and the time period of incubation necessary for precisely separating the vigor levels of different seed lots. Nevertheless, quantification of the carbon dioxide concentration released by the respiratory process under extreme conditions with the use of a gas exchange analyzer proved to be a rapid and efficient method in categorization of B. napus seeds from different vigor classes.
CONCLUSION
The peak CO2 concentration after three hours of incubation at 40 oC may be used to evaluate lots of B.
napus seeds with different vigor levels.
ACKNOWLEDGMENTS
We express of our appreciation to CAPES for granting fellowships to the first two authors and to the CNPq for financial support for the project.
REFERENCES
AUMONDE, T. Z et a. Classificação do vigor de sementes de feijão-miúdo pela atividade respiratória. Interciência, Caracas, v.37, n.1, p. 55-58, 2012.
ÁVILA, M. R. et al. Testes de laboratório em sementes de canola e a correlação com a emergência das plântulas em campo. Revista Brasileira de Sementes, Londrina, v.27, n.1, p.62-70, 2005.
BEWLEY, J. D.; BLACK, M. Seeds: physiology of development and germination. 2. Ed. New York: Plenum
Press, 1994, 445p.
BRADFORD, K. J. et al. Oxygen measurements in seed testing. Zürich: ISTA, p. 01-29, 2012.
BRADFORD, K. J. et al. Quantifying the sensitivity of barley seed germination to oxygen, abscisic acid, and gibberellin using a population-based threshold model. Journal of Experimental Botany, London, v.59, n.2, p. 335-347, 2008.
BRASIL. Ministério da Agricultura, Pecuária e Abastecimento. Regras para análise de sementes.
Ministério da Agricultura, Pecuária e Abastecimento. Secretaria de Defesa Agropecuária. Brasília: MAPA/ ACS, 2009. 395p.
BRASIL. Ministério da Agricultura, Pecuária e Abastecimento. Instrução Normativa n. 60, de 10 de dezembro de 2009. Diário Oficial da República Federativa do Brasil, Brasília, p.16-25, 11 dez, 2009.
BUCKLEY, W. T.; HUANG, J. An ethanol-based seed vigour assay for canola. Seed Science and Technology, Zürich, v.39, n.2, p.510-526, 2011.
CRISPIN, J. E. et al Determinação da taxa de respiração em sementes de soja pelo método da titulação. Pesquisa
Agropecuária Brasileira, Brasília, v.29, n.10,
p.1517-1521, 1994.
DELOUCHE, J. C.; STILL, T. W.; RASPET, M.; LIENHARD, M. O teste de tetrazólio para viabilidade de sementes. Brasília, DF: AGIPLAN, 1976, 103p.
FERREIRA, D. F. Estatística básica. 2. ed. Lavras: UFLA, 2009, 664p.
KODDE, J. et al. A fast ethanol assay to detect seed deterioration. Seed Science Research, Wallingford, v.22, n.1, p.55-62, 2012.
MAGUIRE, J. D. Speed of germination aid in selection and evaluation for seedling emergence and vigor. Crop Science, Madison, v.2, n.2, p.176-177, 1962.
MARCOS-FILHO, J. Fisiologia de sementes de plantas cultivadas. Piracicaba: FEALQ, 2005. 495p.
MENDES, C. R. et al. Respiratory activity for the differentiation of vigor on soybean seeds lots. Revista Brasileira de Sementes, Londrina, v.31, n.2, p.171-176, 2009.
MILLAR, A. H. et al. Organization and regulation of mitochondrial respiration in plants. Annual Review of Plant Biology, Palo Alto, v.62, p.79-104, 2011.
TAIZ, L.; ZEIGER, E. Fisiologia vegetal. 4. ed. Porto Alegre: Artmed, 2009. 819p.