Carlos Pestana Barros & Nicolas Peypoch
A Comparative Analysis of Productivity Change in Italian and
Portuguese Airports
WP 006/2007/DE
_________________________________________________________
Roberto Fontana, Alessandro Nuvolari, Hiroshi Shimizu, Andrea
Vezzulli
Reassessing patent propensity: evidence from a
data-set of R&D awards 1977-2004,
WP 09/2013/DE/UECE
_________________________________________________________
De pa rtme nt o f Ec o no mic s
W
ORKINGP
APERSISSN Nº 0874-4548
1
R
EASSESSING
P
ATENT
P
ROPENSITY
:
E
VIDENCE FROM A
D
ATA
-S
ET OF
R&D
A
WARDS
,
1977-2004.
Roberto Fontana
♦, Alessandro Nuvolari
♥, Hiroshi Shimizu
♠, Andrea Vezzulli
♣Abstract
It is well known that not all innovations are patented, but the exact volume of innovative activities undertaken outside the coverage of patent protection and, relatedly, the actual propensity to patent an innovation in different contexts remain, to a major degree, a matter of speculation. This paper presents an exploratory study comparing systematically patented and unpatented innovations over the period 1977-2004 across industrial sectors. The main data source is the ‘R&D 100 Awards’ competition organized by the journal Research and Development. Since 1963, the magazine has been awarding this prize to the 100 most technologically significant new products available for sale or licensing in the year preceding the judgments. We match the products winners of the R&D 100 awards competition with USPTO patents and we examine the variation of patent propensity across different contexts (industries, geographical areas and organizations). Finally we compare our findings with previous assessments of patent propensity based on several sources of data.
Acknowledgements
Comments from participants to the conference “Technical change: History, Economics and Policy” (SPRU, University of Sussex, 29-30 March 2010) are gratefully acknowledged. We are also particularly grateful to Fred Block, Maria Savona, Jonathan Sapsed and three anonymous referees for very helpful suggestions on subsequent drafts. Finally, we would like to thank Nick von Tunzelmann who, throughout the years, has been a constant source of inspiration and
encouragement.
♦Department of Economics,University of Pavia, Via Ferrata 1, 27100, Pavia & KITeS – Bocconi University, Via Sarfatti 25,
20139, Milano, Italy. [email protected]
♥ LEM – Sant’Anna School of Advanced Studies, Piazza Martiri della Liberta’ 33, 56172, Pisa, Italy.
♠ Institute of Innovation Research – Hitotsubashi University, Tokyo, Japan. [email protected]
2
1. Introduction
Within the Economics of Technical change and Innovation Studies (ETIS) literature it is today widely acknowledged that many innovations are not patented. In principle, there may be three types of explanation accounting for the inventor’s decision of not taking a patent (Basberg, 1987). The first explanation is that the innovation is simply not patentable. In this case, the inventor believes that the innovation in question does not represent suitable patent matter (e.g. the patentability of ‘pure’ software programs was still a matter of contention in many jurisdictions not so long ago). Alternatively, the innovation is in principle patentable but the inventor may anticipate that the inventive step embodied in her innovation is not ‘high’ enough to be deemed worthy of patent protection by patent examiners. In both these two examples the decision of not patenting is determined by the fact that this is not actually possible (or believed possible). The third possibility is that the inventor, even when conceiving taking a patent as a fully feasible course of action, decides not to patent the innovation because she actually prefers to do so. In this case, even though the innovation is patentable and worth patenting, the inventor prefers industrial secrecy or other alternative strategies to extract some economic returns from her innovation. This third case is the most interesting one from the viewpoint of innovation scholars.
The existence of ‘appropriability strategies’ that are alternative to patenting was initially documented by early economists of innovation (Kuznets, 1962; Schmookler, 1966; Taylor and Silberston, 1973). Later on, the survey studies by Mansfield (1986) and Levin et al. (1987) during the 1980s highlighted that, in most industries, patent protection was not the typical tool adopted by firms for the extraction of economic returns from innovations, a finding further corroborated by subsequent research both in US (Cohen et al., 2000) and Europe (Arundel and Kabla, 1998). All these research results are frequently cited and surely represent important pieces of evidence discussed in the innovation literature. However, as aptly noted by De Rasenfosse (2010), on closer inspection, it is difficult to avoid the impression that the major implication of these findings (i.e. that a sizeable share of innovations is never patented) has gone completely neglected. To be sure, many empirical investigations acknowledge the limitations of patents as innovation indicators. However, once these limitations are gauged against their advantages (i.e. availability and richness of information they provide) the final choice is to rely on patents if anything because of the sheer difficulty of constructing suitable indicators using alternative sources.1
This state of affairs is deeply unsatisfactory as we incur the risk that even the most carefully designed empirical studies will provide us with a partial, and sometimes even distorted, representation of innovative activities. Furthermore, since our understanding of patent propensity in different contexts is still rudimentary, in many cases, it is also difficult to formulate a sound assessment of the margin of error and of the biases involved in the adoption of patents as innovation indicators. Consider, for instance, the concept of ‘propensity to patent’ usually defined in the literature as the ratio between patents and R&D expenditures (Scherer, 1983; Hall and Ziedonis, 2001). Though surely legitimate, we should note that this definition of patent propensity is simply describing the overall relationship between patents and innovative efforts and it is only indirectly linked to the actual decision to patent or not a specific innovation (see De Rasenfosse, 2010 for a more extensive discussion).
Interestingly enough, economic historians and historians of technology have instead adopted a more ‘straightforward’ definition of patent propensity, namely the share of patented innovations in the total number of innovations occurring in a given time period (Sullivan, 1989; Moser, 2005;
3
2010).2 This conceptualization of patent propensity, although intuitively appealing, is not of
immediate empirical operationalization because it requires some form of direct assessment of the total amount of innovations occurring in a given time period. Still, historians have displayed considerable ingenuity both in the identification of sources (alternative to patents) that could be used for formulating quantitative assessments of overall innovative output in different contexts and periods, and in connecting these sources with the patent evidence for constructing estimates of patent propensity. In this respect, the recent contributions of Moser (2005; 2010) can be regarded as among one of the most successful examples of this approach.
This paper argues that these historical investigations suggest a framework of inquiry that can, and should, be fruitfully extended within the field of ETIS. In the paper we present an application of this method using a database of ‘important’ industrial innovations occurred between 1977 and 2004. Our source of data is the ‘R&D 100 Awards’ competition organized by the journal Research and Development. Since 1963, this journal (which at that time was called Industrial Research) has been awarding a prize to 100 most technologically significant new products available for sale or licensing in the year preceding the judgment. The potential of this source was already reckoned by Carpenter et al. (1981) and Scherer (1989). This source has also been more recently used by Block and Keller (2009) to document the increasing role of public institutions and public funding in the generation of innovations in the US economy in the period 1971-2006.
Though recent and therefore not ‘historical’ in a strict sense, the database covers 30 years of innovations, several manufacturing industries, and different types of economic actors, both corporations and Universities and Public Research Organizations (PROs). These data seem particularly appropriate for studying the propensity to patent for the following reasons: i) the data consider innovations that have been recognized by a jury of experts as significant and they should be commercially feasible at the time of the awards; ii) most of the awards have been granted to large corporations accounting for a sizeable amount of total R&D investments; iii) the data cover a relatively long time period allowing us to take into account changes in the determinants of the propensity to patent over time. Using these data we are able to assess systematically the relative influence of sector, organization, and inventor specific characteristics on the actual decision of taking or not a patent.
Our study is based on a sample of about 3000 innovations that have received an award. For each innovation in our dataset we have retrieved information concerning: years of the award, description of the innovation, type and name of applicant organization(s), application domain of the innovation, country, and name of inventor(s). The first step of our analysis is to match awarded innovations with patents using the search engine of the USPTO website. Then, on the basis of the invention description contained in the journal, we classify all the awarded innovations in thirty different sectors of activity. In this way, the data allow a thorough comparison between patented and not patented innovations across different industrial sectors, countries, types of organization and types of innovation. Our results highlight the following patterns. First, a large share of innovations is not protected by means of patents. Second, we are able to point out the existence of systematic significant differences in patenting propensity across sectors, geographical areas, types of organization and types of innovation.
The structure of the paper is as follows. Section 2 reviews the empirical literature on the effectiveness of patents as appropriability tools. Section 3 describes in detail our data source, our matching procedure and the limitations of the dataset. Section 4 presents our analysis of patent propensity across different dimensions. Section 5 compares our findings with those of previous assessments of patent propensity carried out using different types of data. Section 6 concludes and
4
draws some methodological implications with particular reference to the possibility of extending the framework of inquiry adopted by economic historians and historians of technology to contemporary studies of patent propensity.
2. Patents as indicators of innovation and their limitations
Scholars within the ETIS tradition have relied intensively on patents to investigate the sources, nature, and the effects of innovative activities. Innovative activities are inherently elusive phenomena which almost by definition are bound to defy systematic attempts of (quantitative) measurement. It is not surprising then that the existence of patent records has been regarded for a long time, mostly by economists, but also by other scholars of innovation with different disciplinary backgrounds, as an almost unique source of insights into the nature of inventive activities. The main merits of patent records as a source for measuring innovation are easy to summarize: i) they are by definition related to innovative activities;3 ii) they are readily available
(allowing to economize efforts of data collection);4 iii) they are available for relatively long periods
of time; iv) they contain a significant depth of information (inventors’ names and addresses, ownership of the innovation, description of the innovation and its relation with previous ones, as represented by patent citations). These factors have made patents the most adopted indicator for scholars interested especially in measuring the output of innovation activities.
Although much progress has been achieved in this way, it is well known that indicators of innovation based on patents suffer from several limitations. These limitations can be summarized citing again from Griliches (1990: 1169): “Not all inventions are patentable. Not all inventions are patented and the inventions that are patented differ greatly in their ‘quality’, in the magnitude of inventive output associated with them”.
The first limitation is clearly the most obvious one and probably the easiest to tackle. Some domains of inventive activity do not constitute patentable subject matter. The solution is to resort to alternative indicators for assessing inventive output in these areas. The second limitation is that not all patentable innovations are actually patented. This means that in contexts characterized by low patent propensity, i.e. in environments in which firms prefer to adopt alternative appropriability strategies, the use of patents as innovation indicator may result in a biased assessment of the volume of innovative activities.5 The existence of a different propensity to patent
across industries has indeed been the most important finding of studies based on surveys of the attitudes of R&D personnel toward the use of patents. Mansfield (1986) examined how many patentable innovations were actually patented in a random sample of large US firms in different industries. His results highlighted that in sectors where patents are not regarded as particularly effective ’appropriability’ mechanisms (i.e. primary metals, electrical equipment, instruments, office equipment, motor vehicles, rubber and textiles) around 34% of potentially patentable inventions were not patented. This percentage is around 16% in those sectors where patents are considered to be more important (i.e. pharmaceuticals, chemicals, petroleum, machinery, and
3 In the words of Griliches (1990: 1169): “[A] patent represents a minimal quantum of invention that has passed both the scrutiny of the patent office as to its novelty and the test of the investment of effort and resources by the inventor and his organization into the development of this product or idea, indicating thereby the presence of a non-negligible
expectation as to its ultimate utility and marketability”
4 The ‘accessibility’ of patent as a source has greatly increased over the last 20 years or so thanks to the creation of on line search engine such as ESPACENET and the efforts of construction of data-bases containing information gathered by patent records such as the NBER-US patent set (Hall, Jaffe and Trajtenberg, 2001) and the OECD-PATSTAT data-set.
5
fabricated metal products). Results from subsequent surveys corroborate these early findings. In some industries, secrecy and lead times seem to be more important than patenting for appropriating the returns from innovation (Levin et al., 1987). Moreover, patent propensity varies depending on the type of innovation, with firms more likely to apply for a patent for product innovation than for process innovation (Cohen et al., 2000).6 Arundel and Kabla (1998) also find
that the (sales weighted) propensity to patent differs across innovation type with relatively lower rates for process innovation (24.8%) than for product innovations (35.9%).
Among the available alternatives, secrecy seems to play an important role in protecting innovation. Looking at a sample of European innovative firms, Arundel (2001) finds that secrecy is generally rated as more valuable than patenting. This is particularly true in the case of product innovation, though the probability of being considered more valuable declines with firm size. Hussinger (2007) carries out a similar analysis using sales figures to assess the importance of alternative means of appropriation rather than individual evaluations. Her findings suggest that secrecy is relatively more important for innovations that are not commercialized.
The third limitation is that patents and innovations differ greatly in their technological and economic significance.7 In particular, several studies have shown that the ‘size’ distribution of
innovations is sharply skewed with the majority of innovations of little or limited technical and economic significance and a restricted number of highly significant innovations (Silverberg and Verspagen, 2007). Innovation scholars have attempted to deal with this problem by weighting patents using citations or other information such as claims, and family size (Trajtenberg, 1990). Still, it is acknowledged that these methods represent only imperfect proxies of the quality of the innovation underlying the patent in question. In fact, the most sensible use of these proxies of patent value is to use them as ‘probabilistic markers’ of the underlying economic value of the patents and employ them for the identification of groups of potentially valuable patents (van Zeebroeck, 2011). Clearly not taking properly into account these variations in the underlying value of patents may again lead to biased assessments of inventive output.
Economic historians seem to have been more sensitive to the limitations of patents as innovation indicators and have explored the potentialities of alternative sources. Moser (2005; 2010) has constructed a data-set of innovations on the basis of the catalogues of nineteenth century industrial exhibitions (in her case she has used the Crystal Palace exhibition of 1851 and the Centennial exhibition in Philadelphia in 1876). According to Moser (2002: 1-2), this type of data covers “economically useful innovations” (i.e. the commercial introduction of new products or processes), rather than “inventions” (i.e. the additions to the stock of technological knowledge). Furthermore, exhibition data measure innovations regardless of whether they are patented or not. Moser's findings have produced novel insights on the sources of innovation across countries and sectors during the second half of the nineteenth century. Her findings show that in 1851, 89% of British innovations on display at the Crystal palace exhibition were not patented. Even among prize winning innovations, 84% were not patented. Moreover, she finds that patent propensity is affected by the characteristics of the sectors where the innovation occurs, the location of the invention (urban vs. rural), and the quality of the invention (incremental vs. radical).
Brunt et al. (2008) have instead relied upon information on prizes and awards. Using a dataset of awards for inventions promoted by the Royal Agricultural Society of England from 1839 to 1939,
6 The survey questionnaire of Levin et al. (1987) did not contain a specific question asking what percentage of innovation a firm typically patented, but simply contained a question asking to assess the relative effectiveness of different
appropriability strategies. The survey questionnaire of Cohen et al. (2000) instead contained a specific question asking respondents what percentage of their innovations was patented.
6
they have studied, among other aspects, whether and how prizes affect innovation and patenting. Their findings point to the presence of a positive relationship between prizes and patenting. In particular, the propensity to patent in the technology category targeted by the award increased by 42% for those inventions awarded a gold medal. Moreover, patents are more likely to be renewed when they were taken out of awarded inventions thus suggesting a positive relationship between awards and the quality of the patent.
These recent contributions by historians clearly illustrate the potentialities of assessments of innovative output using data sources that are alternative to patents.8 In particular, we would like
to suggest that innovation scholars should consider with particular interest prize and exhibition data, because some of their intrinsic characteristics are likely to render them less prone to the pitfalls that typically affect patent data. First, both prize and exhibition data refer to valuable, or to use Moser’s words “economically useful”, innovations. In the case of prizes this is almost a tautology given that they have been recognized by experts in the field as superior to alternative available solutions and probably also to existing practices. For the case of innovations displayed at industrial exhibitions, their economic and technological significance will depend on the exact criteria that an artifact must satisfy for being included in the exhibition. Second, and most importantly, both types of data typically comprise innovations with and without patents (Moser, 2010). In other words, using this type of data allows an assessment of the share of innovations occurring outside of the patent system as well as the construction of a more ‘direct’ indicator of propensity to patent. This is a crucial advantage with respect to other sources of data.
3. The ‘R&D 100 Award’ database
This paper presents an extension of the method recently employed by historians to the field of ETIS. Using a source of data that so far has received little attention we provide new estimates of patent propensity across industries and over time. Our source of data is the ‘R&D 100 Award’ competition organized by the magazine Research and Development (previously called Industrial Research). The magazine was founded in 1959 and it represents probably one of the most
authoritative regular publications for R&D practitioners. Currently it has an estimated monthly readership of over 80,000. It is estimated that about 75% of the readers works in high-tech industries, whereas the remaining 25% works for government laboratories, universities, and similar organizations. Over 60% of the readers have managerial or executive type of jobs. The ‘R&D 100 Award’ competition has been running since 1963. Each year the magazine awards with a prize the 100 most technologically significant products available for sale or licensing in the year preceding the judgment. Throughout the years, key breakthroughs inventions such as Polacolor film (1963), the flashcube (1965), the automated teller machine (1973), the halogen lamp (1974), the fax machine (1975), the liquid crystal display (1980), the printer (1986), the Kodak Photo CD (1991), the Nicoderm antismoking patch (1992), Taxol anticancer drug (1993), lab on a chip (1996), and HDTV (1998) have received the prize. In order to apply for the prize inventors, or their employees, must fill an application form providing a detailed description of the product in question. The prize consists of a plaque which is presented in a special ceremony. There is no sum of money involved. The prize is awarded by a jury composed of university professors, industrial researchers and consultants with a certified level of competence in the specific areas they are called to assess. The members of the jury are selected by the editor of the magazine. The main criteria for assessment are two: i) technological significance (i.e., whether the product can be considered a major breakthrough from a technical point of view); ii) competitive significance (i.e., how the
performance of the product compares to rival solutions available on the market). R&D 100 awards are accolades comparable to the Oscars for the motion picture industry as “they carry considerable prestige within the community of R&D professionals” (Block and Keller, 2009: 464).
8 Interestingly, Schmookler, one of the pioneer of the use of patent statistic in the field of ETIS, was also one of the early scholars to argue in favour of cross-checking the assessments of inventive output based on patent with data on
7
The technological significance requirement is to be understood in fairly broad terms:9
“[…] products and processes that can change people's lives for the better, improve the standard of living for large numbers of people, save lives, promote good health, clean up the environment, etc. […] A cure for cancer or AIDS. An engine that runs on water. A safe, cheap method for cleaning up toxic waste. A vehicle that can fly 800 passengers from New York to Tokyo in two hours. A device that would cut automotive accidents or one that would reduce workplace injuries. A pollution-free herbicide that would increase crop production in Third World countries”.
Accordingly products with a wide potential of application are preferred to those catering to very specific sets of user needs:
“Products or processes that solve very specialized or circumscribed problems could be judged less significant than those that meet larger, more broad-based needs. For example, a new scientific instrument that only benefits a few scientists in a narrow field of interest would have difficulty competing against a device with much broader application. It would depend on how significant the two fields of interest were and how much the technical improvements contributed to the success of each device.”
Furthermore, for attaining the prize there should be a proven link between the effect of the innovation and an improvement in technology:
“[…] these improvements must be attributed to significant breakthroughs in technology. In general, this means your product should exhibit multiple levels of improvement - 53 times faster, 103 greater throughput, 503 times more accurate - or, preferably, orders of magnitude improvement over existing technology. Again, we're looking for ‘leapfrog’ gains in performance, not expected, incremental improvements.”
Additionally the product should also represent a major improvement in comparison with alternative solutions already existing on the market. For this reason, the applicant is requested to provide a ‘competitive matrix’ illustrating how the product compares with rival solutions already available on the market:
“The competitive matrix should show how your product compares to existing products in terms of the crucial factors involved in the technology. This is your opportunity to give the judges a quick overview of how your product beats the competition. […] Include only factors crucial to the technology. Don't waste space (and the judges' time) throwing in every conceivable factor, just to pad your entry. However, you must list all factors that are indeed crucial to the technology, even if you don't ‘win’ that particular point. For example, if you fail to include ‘hardness’ in an entry involving a new alloy, your entry may be looked upon with suspicion by the judges. Some typical factors you might want to include: signal-to-noise ratio, weight, speed, reliability, resolution, cost, accuracy, life expectancy, mean time between failures, sensitivity, reproducibility, strength, power consumption, production yield, environmental operating , intensity, efficiency, size, output rate, bandwidth, number of materials tested, stability”.
The product must exist in marketable form, i.e. it “must have been first available for sale or licensing during the calendar year preceding the judging”. Applicants are not restricted to firms, but also governmental laboratories, universities, public research centres are allowed to compete. In case of products resulting from research collaborations, the application form requires to include all the organizations that have provided a “significant contribution to [the] creation of the product” and to provide a description of their precise role in the project. Hence, the rules of the competition
8
make sure that all the parties that have participated to the innovation are properly acknowledged.10
Finally an organization may submit as many products as it wishes at each yearly competition.
There are a number of characteristics of the R&D 100 awards competition that, at least prima facie, appear particularly promising for using this data source to measure innovative output. First, the R&D 100 awards competition seems to represent a good opportunity for companies, government laboratories, etc. to showcase the outcome of their innovative activities. Thus, we can expect that the awards will provide us with a fairly reliable sample of innovations attained by R&D performers. Second, R&D 100 awards are granted to innovations that, at least in principle, should embody a significant improvement over the existing state-of-the-art that is clearly documented. In other words awarded innovations should represent, at least in principle, a technological breakthrough. Third, the selection of the awards is made by what appears a competent, authoritative jury of experts. Fourth, R&D awards may be assigned both to patented and not-patented innovations. Finally, there seems to be limited space for strategic behaviour and attempts to conditioning the jury, because the nature of the prize is simply honorific. Alongside these advantages, some biases exist which prevent us from considering these awarded innovations as a fully representative sample of innovative activities. For example, Scherer was struck by the fact that awards covered a very limited number of new weapon systems and a relatively few pharmaceutical products, both sectors notoriously characterized by high R&D investments. Nevertheless, he still regarded the source as capable of providing useful insights on the nature of innovative processes (Scherer, 1999: 67-68).
Retrieving the information from different issues of the magazine, we have constructed a data set of all the R&D 100 awards granted in the period 1977-2004. Our data-set contains 2802 inventions. The total is not equal to 2800, because the requirement of awarding 100 inventions was apparently interpreted with some degree of flexibility. Thus, the amount of awards given in each year in the period we are considering ranges from 97 to 109. A major limitation of the data set is that we do not have information on applying innovations that were not awarded the prize. For this reason, we cannot control whether specific factors, besides the specific technical and economic merits of the innovation, affected the selection of the awards.
3.1. Matching awards with patent data
In order to assess the propensity to patent for the awarded innovations included in our sample, we had to look for a possible match between each awarded innovations and one or more USPTO
patents.11 We do not expect to find an exact match between each awarded innovation and one
patent. As noted above, awarded innovations represents ‘products’ available for
commercialization or license, so it is possible that, in certain areas, individual components of a specific product may be protected by different patents. We regarded the awarded innovation as ‘patented’ also in cases in which one or more components of the innovation in question were actually patented. To carry out the matching exercise we relied upon the following information contained in the R&D 100 database: i) name of award winning organization(s), ii) the name of the innovation, iii) the year of award, iv) the name of developer(s) and v) the description of the innovation. We have searched USPTO patents granted in a time interval ranging from 3 years before to 3 years after the award. The criteria for ascertaining a ‘positive’ match were the name of the inventors, the name of the organization and the consistency between the description of the ‘R&D 100’ innovation and the title and abstract of the patent (also taking into account the
10 In this respect it is also important to note that the rules of the competition state explicitly that: “existing technologies purchased by third parties who then conduct sales, [marketing and other commercialization] efforts” are considered eligible for the award only if the original developer is included in the application.
9
possibility that one or more components of the awarded innovation could have been patented as a separate item). In particular, the patent search procedure entailed the following steps. First, the name of developer as Inventor and the name of organization as Assignee were used to search patents in the USPTO online database. If any patents were found, the patent title and abstract were checked by looking at the information provided by the R&D 100 to see if the patent was
corresponding to the award winning invention. Second, if the name of developer was not
available, abstract key word search with the name of organization was carried out. The key words were selected from the technological information of the innovations contained in the R&D 100 list. If a match was found at this stage, a further check was carried out to see whether the patent was related with the award winning innovation by cross-checking the information of the patent and the R&D 100 innovation.
We should note that the matching process may be subjected to errors. More specifically, there may be two limitations in the patent searching procedures we have adopted. The first is the time span of the searching. The search considers as relevant to the innovation a patent obtained in plus/minus 3 years from the year of the award. It means that this procedure can overlook the relevant patent(s) that were awarded more than 3 years before or after the year of the award. Second, the product name and description contained in the R&D 100 database may not always provide enough information for the identification of one or more possible underlying patents. These limitations notwithstanding, we are confident that our matching procedure provided reliable results in most of the cases. Nevertheless, in uncertain cases, the ‘benefit of the doubt’ was given to a positive match in the sense that we considered the awarded invention as covered by a patent.12 For this reason, if anything, the adopted matching procedure does not contain any
in-built bias leading to a systematic underestimation of patent propensity.
3.2. The ‘quality’ of R&D 100 awards
As highlighted by Moser (2010), one of the chief advantages of employing data on awards and prizes as indicators of innovative output is that, with respect to patents, this type of data should in principle contain only relatively ‘important’ innovations, namely those inventions deemed worthy of receiving the prize or of being put on display. Accordingly, the first exercise we carried out was an attempt of checking whether our R&D 100 dataset contains inventions that are above a certain quality threshold. This is done by replicating an exercise originally performed by Carpenter et al.
(1981). Carpenter et al. (1981) used the 1969 and 1970 R&D awards list and matched these inventions with the corresponding US patents. In this way, they obtained a set of 100 patents whose technological significance had been ‘certified’ by the granting of the award. They then compared the citations received by this group of patents with the citations received by a random sample of patents distributed within the same time cohort. Their results showed that the patents covering the R&D 100 awards received a significantly higher number of citations than the control group. This obviously suggests that R&D 100 innovations are on average of better quality than the ‘average’ patent.
Our results for the period 1977-2004 confirm the early findings of Carpenter et al. (1981). For each R&D 100 innovation with one or more USPTO patents we constructed a ‘matched random’ sample of ten granted patents of the same granted year and of the same International Patent Classification (IPC) class and then compared the number of citations received by patents in this random sample with the citations received by the patents covering an invention within the R&D100 award.13 The
results of this exercise are reported in Table 1.14
12 In this respect our matching procedure was also robust to changes in the ‘time range’ before and after the award was received.
10
[Insert Table 1 about here]
The non parametric Mann-Whitney test confirms that the median number of citations of patents associated with a R&D 100 invention is significantly not lower than the median of the random matched sample. Overall, this exercise confirms that the innovations which received a R&D 100 award are more significant from a technological or economic viewpoint than the ’average’ patent in their technological class.
4. R&D 100 awards and patent propensity
This section presents our estimates of patent propensity defined as the share of patented innovations in the total number of inventions that have received an R&D 100 award. We compute our estimates across different dimensions of innovative activities (industry, geographical area, organization and type of invention).
4.1. Most awarded innovations are not patented
Table 2 reports the number of awarded innovations and the percentage of not patented ones.
[Insert Table 2 about here]
As highlighted above, the awarded innovations contained in the R&D 100 list refer to products that are available on the market or for licence when the application is submitted. Hence, it is possible that the data will contain a bias against organizations such as universities and PROs that lack ’downstream’ assets for the commercialization of a product. However, it is interesting to note that results in Table 2 are consistent with the results of Block and Keller (2009) showing that a significant share of awarded innovations (more than 30%) are generated by non corporate type of organizations. So it would seem that, the presence of bias notwithstanding, our data cover also a significant segment of the population of non corporate organization involved in R&D activities.15
Overall, we found that 269 awarded innovations (slightly less than 10%) were patented according to our matching criteria suggesting that the great majority of innovations were not patented. This percentage is slightly higher (12.56%) when we consider only innovations that have been made by firms.
This estimated patent propensity is in line with the findings of Moser who reports total patenting rates between 11% and 14% for the inventions displayed at the Crystal Palace exhibition of 1851 (Moser, 2005: 1221). Of course, this finding should be interpreted keeping in mind the inherent limitations the data set discussed in Section 3. However, even if we consider possible errors that may have led us to underestimate patenting rates, the result that such a sizeable share of major innovations is not patented is remarkable. In particular, if we consider that ‘The R&D 100 Award’ is a competition aimed at acknowledging the output of formalized R&D efforts, which is notoriously one of the contexts with the highest propensity to patent and that, we are in principle dealing with
would have been more rigorous to compare the sample of patented awarded innovations with patent applications. However, these data are not fully available for US, thus the need to rely upon granted patents.
14 The random matched sample includes 5331 patents and not 5350 because for some specific years in some technology classes it was not possible to collect enough patents to create the match.
11
breakthrough innovations, our findings reveal that patent protection, even in this context, is actually a much less used appropriability strategy than it is generally believed. In this respect, our findings are actually a powerful corroboration of the findings of Moser (2005). Additionally, they are not inconsistent with the results of both the Yale (Levin et al., 1987) and the Carnegie Mellon survey (Cohen et al., 2000) indicating that only in a very restricted number of contexts patents are considered as effective tools for protecting innovation. The obvious policy implication is that the recent developments toward the strengthening of IPR regimes may actually represent a step going in the wrong direction, as it would appear considering the predominant share of innovative activities which is actually carried out without resorting to patent protection.16
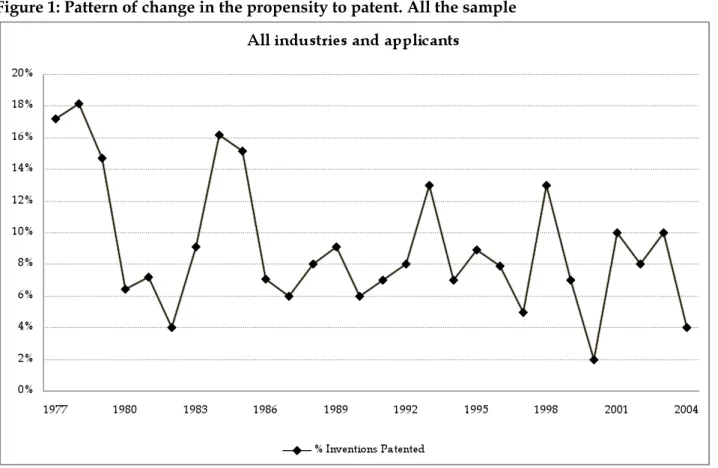
Figure 1 displays the evolution over time of the propensity to patent for all our sample of innovations.
[Insert Figure 1 about here]
Our estimated propensity to patent is never higher than 20%. Moreover, contrary to what has been suggested by other studies (Kortum and Lerner, 1999; Hall and Ziedonis, 2001), our evidence does not seem to indicate the existence of significant structural breaks in the time period considered.17
In our case, it is suggested that the propensity to patent has been remarkably stable and possibly characterized by a fluctuating behaviour around what seems to be a constant level of 10%.
Figure 2 shows the evolution of the propensity to patent broken down by type of inventors, distinguishing between corporate (i.e. firms) and non-corporate (i.e. PRO and universities) organizations.
[Insert Figure 2 about here]
As expected Figure 2 suggests that the propensity to patent is higher for firms than for PROs and universities. In several years the propensity to patent of PROs and universities is equal to zero indicating that no innovation has been patented. From early 1990s onwards the propensity to patent of universities seems to increase. It would be tempting to interpret this evidence as a consequence of the strengthening of IPRs following the introduction of the Bayh-Dole Act in US (Mowery and Ziedonis, 2002; Mowery et al., 2001) though an analysis of the mechanisms underlying this trend falls beyond the scope of the present paper.18
4.2. Patenting rates vary across sectors
Awarded innovations are classified by the magazine in several categories on the basis of their technological content. The classification is not consistent over time and in some cases the innovations were not even assigned to a specific category. Thus, in order to examine the distribution of awarded innovations across different technological fields, we have proceeded as follows. First we reclassified each awarded innovation according to a technology-oriented classification of 30 different sectors based on the co-occurrence of the IPC codes proposed by the
16 For a more elaborate discussion of this point see Boldrin and Levine (2008).
17 Hall (2005) finds several structural breaks in patent application series at USPTO during the 1967-1997 time period. In our case, both the Phillips-Perron (PP) and the Augmented Dickey-Fuller (ADF) tests for unit root reject the null hypothesis that our patent propensity series contains a unit root at the 1% significance level, both after including a time trend and lagged terms (up to the 4th order) in the associated regression. The Andrews (1983) test for structural breaks at unknown points (sup. F=8.6538, T=28) does not reject the null hypothesis of ’no structural change‘ at the 5% significance level.
12
Observatoire des Sciences et des Techniques (OST).19 In a few doubtful cases, we have relied both upon
the classification in product categories of the R&D100 awards and on the innovation description. It is important to note that we have assigned each awarded innovation to only one of the 30 OST sectors. These sectors have been further aggregated into 5 ‘macro’ technological classes (called ‘OST5’ henceforth) defined according to the ISI-INIPI-OST patent classification based on the EPO IPC technological classes.
Table 3 displays the shares of awarded innovations that have been patented (patenting rates) classified by both 5 and 30 OST sectors.
[Insert Table 3 about here]
The share of patented innovation varies considerably across sectors. In terms of macro-sectors, the sector with the highest propensity to patent is chemical/pharmaceuticals, a result which is also in line with the results of the Yale and Carnegie Mellon surveys on the effectiveness of patents for protecting innovations in these fields. Finally, the macro-sector with the lowest patenting rate is instruments.20 In this case we should remember that many organizations active in this sector are
non-corporate institutions such as universities and public research centers which traditionally display a very low patenting attitude.
4.3. Patenting rates vary across geographical areas
Table 4 compares patent propensities across different world regions.
[Insert Table 4 about here]
The awarded innovations with at least one applicant from US show a lower patent propensity with respect to the average level of the whole sample (-1.38%,statistically significant at 10% significance level), whereas applicants from Asia tend to patent more their innovations than the average level (+15.53%, statistically significant at 1% significance level). We should note that the large bulk of Asian innovations are awarded to Japanese companies. Hence our results pointing to a significantly higher propensity to patent of Asian (and especially Japanese) firms are consistent with previous research on the aggressive patterns of foreign patenting of Japanese firms in a comparative international perspective (Granstrand, 1999: 134-175).
It may be argued that this finding is the consequence of differences in the institutional mix of US and Asian prize winners. In order to understand whether this is the case with our data we have compared the propensities across subsets of similar organizations. Table 5 confirms that these overall differences in patent propensity rates across countries are not driven by different institutional mix of US prize-winners with respect to other geographical areas. In fact the higher propensity to patent of Asian prize-winners is confirmed even when considering awarded innovations with at least one corporate applicant (columns 3-4) or only corporate applicants (columns 5-6).
[Insert Table 5 about here]
4.4. Multivariate regression analysis
19 See Hinze, Reiss, and Schmoch (1997).
13
Though interesting, the previous results only account for the effect of a single characteristic at a time (i.e. technological sector, country of origin, applicant type) on the propensity to patent. In order to study the joint effect of all these variables in an unified framework we perform a probit multivariate regression analysis using the probability to patent a given innovation Pr(PAT=1) as dependent variable and a set of applicant and innovation specific characteristics as independent and control variables respectively. The list of additional variables includes: dummies for the technological sector (both at OST 5 and OST 30 aggregation level), dummies for the geographical macro areas (i.e. USA, EUROPE, ASIA), and for the time period decades (1976-1985, 1986-1995, 1996-2005) to capture the year of award. Another set of regressors includes: a dummy (PRO) to account for innovations with at least one public research organization applicant (i.e. either an academic or a governmental organization), a dummy (MAPPL) for collaborative innovations to indicate the presence of more than one applicant, and a count variable (NINV) that reports the number of applicants. All the variables used in the regressions analysis are summarised in Table 6. Table 7 provides instead their main descriptive statistics.
[Insert Tables 6 and 7 about here]
Results from the multivariate probit regression are reported in Table 8 below.
[Insert Table 8 about here]
Column (1) reports the estimated coefficients for the most parsimonious model which does not include sector and time-period dummies. Column (2) includes both time-period and OST 5 macro-sector dummies. Columns (3-4) report the estimated coefficients and average marginal effects (AMEs) for the full model with both time-period and OST 30 macro-sector dummies (not reported for the sake of clarity).
In terms of geographical and sectoral effect, our regression analysis confirms the previous findings from the univariate analysis. Ceteris paribus, awarded innovations with all applicants from Asia show a larger probability to be patented with respect to the excluded category (which includes non-US, non-European and non-Asian countries), followed by awarded innovations with at least one US applicant. No significant difference in the average patent propensity is detected between the OST5 macro sectors represented by the four dummy variables included in the multivariate regression and the excluded one (Mechanical Engineering).
In terms of differences in the propensity across applicants and/ or between collaborative and non collaborative innovations, we find that innovations with at least one PRO as applicant show a lower patent propensity with respect to the excluded category (only corporate applicants). Finally patent propensity increases with the number of inventors (NINV) whereas having multiple applicants (MAPPL) does not seem to exert a significant effect on the propensity to patent an awarded innovation.
14
significant effect of collaborations on the propensity to patent a given innovation. Moreover, our result can be understood on the basis of the two effects suggested by Peeters and Van Pottelsberghe de la Potterie (2006) to explain the patenting of collaborative innovations. On the one hand there is a ‘need effect’ which refers to “[…] a higher need for patent protection resulting from the mutual access to the partners’ knowledge bases” (Peeters and Van Pottelsberghe de la Potterie, 2006: 127). On the other hand, there is a ‘novelty effect’ which refers to a “[…] potentially more fundamental and breakthrough knowledge generated by R&D collaborations compared to in-house R&D alone, which would result in more patents” (Peeters and Van Pottelsberghe de la Potterie, 2006: 127). In our case the ‘novelty effect’ is probably better proxied by the number of inventors (NINV), which has a positive and statistically significant coefficient, and dominates the ‘need effect’ which instead is better proxied by the dummy variable MAPPL.
5. Reassessing patent propensity: a reappraisal of the empirical evidence
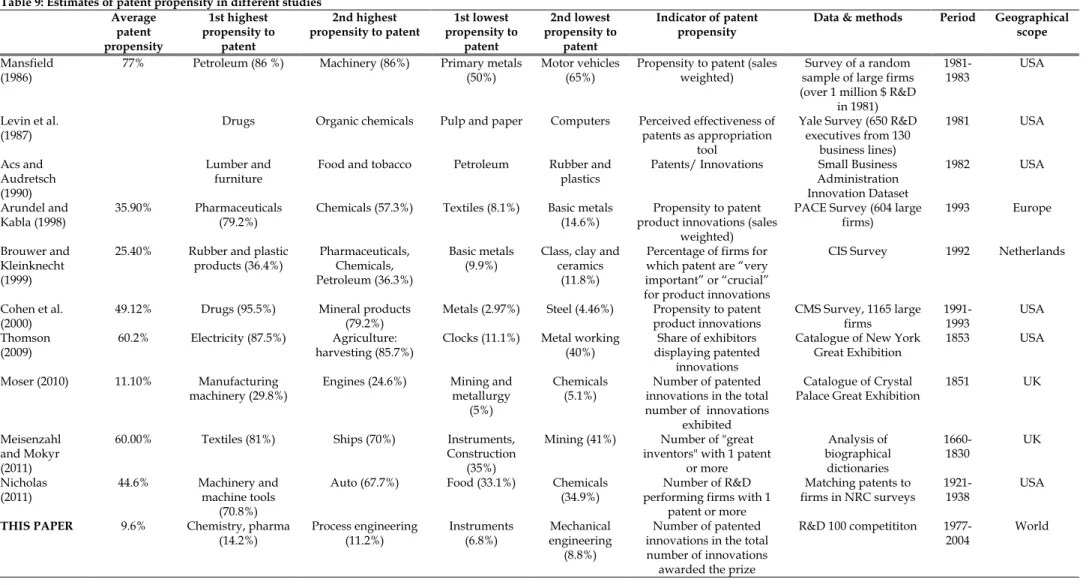
At this point, it is instructive to compare our findings with prior estimates of patent propensity. This is done in Table 9.
[Insert Table 9 about here]
Table 9 is based on an extensive recognition of the existing literature and summarizes the findings of all the studies we have been able to identify, that formulates direct or indirect empirical estimates of the importance of patent protection for product innovations in different industries using different types of methods. The last row of the table reports the findings of this paper. It has to be stressed that this exercise has important limitations, because the approach used to assess patent propensity is not consistent across studies. For instance, in some cases the estimation of patent propensity was not the main goal of the research (this is, in particular, the case for Acs and Audretsch (1990)). In other cases (Mansfield, 1986), the survey asked how many patentable
innovations were actually patented which is different from our focus on the ratio between the number of patented innovations and the total number of innovations. Levin et al. (1987) asked respondents to assess the relative effectiveness of patents in comparison to other alternative appropriability strategies. Cohen et al. (2000) asked firms to report the share of innovations for which they have applied for a patent which, again, is somewhat different from the variable we have constructed in this paper. These limitations notwithstanding, we believe that it is useful to compare our results with the main findings concerning patent propensity emerging from the literature.
It is immediately interesting to note that, consistently with what we have highlighted in the introduction, four of the studies listed in the table (Thomson, 2009; Moser, 2010; Meisenzahl and Mokyr, 2010; Nicholas, 2011) are contributions of economic historians or historians of technology.
In terms of research strategies, we can draw a distinction between studies using a survey approach (Mansfield, 1986; Levin et al., 1987; Arundel and Kabla, 1998; Brouwer and Kleinknecht, 1999; Cohen et al., 2000) and other contributions that instead estimate patent propensity using indicators of overall innovative output not based on patents. Although providing very detailed snapshots on innovative activities, it is well known that also the data collected by means of innovation surveys suffer from several shortcomings. The main one is that this type of data, unavoidably, reflects the personal judgment of actors that are required to monitor and self-assess their own innovative activities and performance (Mairesse and Mohnen, 2010).
15
may seem somewhat perplexing, because ‘petroleum’ and ‘rubber’, sectors that in innovation surveys usually appear characterized by a relative high propensity to patent, exhibit a very low propensity. In this respect, two considerations are in order. First, the Acs and Audretsch (1990) study is focused on small firms. Second, the indicator of patent propensity is constructed by comparing innovations with patents at industry level, but these quantities do not refer to the same groups of firms.
The studies by Moser (2005; 2010) estimate patent propensity as the share of patented inventions in the total number of inventions presented at the great nineteenth century world fairs.21 The most
important result emerging from these studies is the relatively low levels of patent propensity. In this respect, as we have already noted, the findings of our paper are intriguingly in line with this type of evidence. The study of Thomson (2009) is an application of the research strategy of Moser (2005; 2010) to the case of the New York exhibition of 1853. Interestingly enough, Thomson finds levels of patent propensity that are much higher than those estimated by Moser (2010).
Meisenzahl and Mokyr (2011) is a study based on the ’prosopographical’ analysis of a sample of 759 British inventors, engineers, mechanics and skilled craftsmen active in the period 1660-1830 constructed using biographical dictionaries, an approach originally pioneered by Khan and Sokoloff (1993). In this case the propensity to patent was defined as the share of inventors that have been granted at least one patent in the total number of inventors. The study of Nicholas (2011) adopts a similar approach, but in this case the actors are not individuals, but firms. Here propensity to patent is defined as the share of firms with at least 1 patent in the total number of firms with R&D establishment that were included in the surveys of the National Research Council in the US in the period 1921-1938.
Overall, the main result emerging from Table 9, holding in different periods and locations, is that a sizeable share of inventive activities is not covered by patents. Hence, the obvious recommendation is that it is crucial, whenever possible, to assess inventive output combining evidence from patents with evidence from other sources. However, the wide range of the estimated levels of patent propensity (even in studies such as Moser (2010) and Thomson (2009) that adopt similar research designs), also suggest that we are still very far from a robust understanding of patent propensity in different contexts and that more research on this theme is needed.
6. Concluding remarks
This paper has reassessed the propensity to patent using a novel data source on R&D awards that so far had received little attention. Our analysis has provided two types of evidence. First, a relative low number of important innovations are patented. Second, patent propensity tends to vary across industrial sectors and types of organizations. While these results mirror, to a certain extent, some of the earlier findings in the literature, an important difference exists concerning the method. In particular, inspired by the recent works of economic historians (Moser, 2005; 2010), we have adopted a straightforward definition of patent propensity in terms of the share of innovations patented over the total innovative output, a choice that marks an important departure with respect to investigations carried out in the field of ETIS which typically assess innovative output using indicators based on patents or innovation surveys.
In this respect, we believe that recent contributions in the field of economic history and history of technology have probably some important methodological lessons to teach to the ETIS field. In our judgment, the main lesson is that much more effort ought to be devoted to the exploration of the
16
potentialities of new sources of data for constructing indicators of innovative output. More specifically, the contributions of economic historians suggest that, with some ingenuity the literature produced by technologists and engineering practitioners (e.g. technical journals and magazines, exhibition and fair catalogues, engineering prizes and awards) can be successfully employed for constructing indicators of innovative output that can usefully integrate the patent evidence.
We would like to argue that this is precisely one of the methodological lessons emerging from some of the early contributions of Nick von Tunzelmann. Although still not fully appreciated, important insights of his famous analysis of the development and impact of steam power technology in the British economy were based on the evidence gathered from a contemporary engineering journal published in Cornwall called Lean’s Engine Reporter.22 Exploiting the
information contained in the journal, von Tunzelmann was able to provide new estimates for the rates of technical progress as well as for the rate of diffusion of new technical practices in the field of steam power technology (von Tunzelmann, 1970; 1978: 252-264). It would be wrong to think that similar endeavours pertain exclusively in the domain of historical research. One of the aims of this paper was precisely to show that similar sources are probably available also for modern studies of innovation and technical change. At the same time, our plea for the use of new sources should not be read as invoking the complete abandonment of patents as indicator of inventive output. Rather, we believe that real progress can be only attained by systematically combining different types of innovation indicators constructed using different types of sources and measurement techniques.
17
References
Acs, Z. J. and Audretsh, D. B. (1990), Innovation and Small Firms, Mit Press, Cambridge.
Arundel, A. (2001), ‘The relative effectiveness of patents and secrecy for appropriation’, Research Policy, 30, 611-624.
Arundel, A. and Kabla, I. (1998), ‘What percentage of innovations are patented ? Empirical estimates for European firms’, Research Policy, 27, 127-141.
Basberg, B.L. (1987), ‘Patents and the measurement of technological change: a survey of the literature’, Research Policy, 16, 131–141.
Block, F. and Keller, M. R. (2009), ‘Where do innovations come from ? Transformations in the US economy, 1970-2006’, Socio-Economic Review, 7, 459-483.
Boldrin, M. And Levine, D. (2008), Against Intellectual Monopoly, Cambridge University Press, Cambridge.
Brouwer, E. and Kleinknecht, A. (1999), ‘Innovative output and a firm’s propensity to patent. An exploration of CIS micro data’, Research Policy, 28, 615-624.
Brunt, L., Lerner, J. and Nicholas, T. (2008), ‘Inducement prizes and innovation’, CEPR discussion paper n. 6917.
Carpenter, M. P, Narin, F. and Woolf, P. (1981), “Citation rates to technologically important patents”, World Patent Information, vol. 3, pp. 160-163.
Cohen, W. M., Nelson, R.R. and Walsh, J. P. (2000), ‘Protecting their intellectual assets: appropriability conditions and why US manufacturing firms patent (or not)’, NBER Working Paper n. 7552.
De Rasenfosse (2010), ‘How much do we know about firms’ propensity to patent and should we worry about it ?’ paper presented at the 2010 Druid Summer Conference.
Granstrand, O. (1999), The Economics and Management of Intellectual Property. Towards Intellectual Capitalism, Edward Elgar, Aldershot.
Griliches, Z. (1990), ‘Patents statistics as economic indicators. A survey’, Journal of Economic Literature, 28, 1661-1707.
Hall, B.H., Jaffe, A. and Trajtenberg, M. (2001), ‘The NBER-Citations datafile: lessons, insights and methodological tools’, NBER Working paper n. 8498.
Hall, B. H. and Ziedonis, R. (2001), ‘The patent paradox revisited. An empirical study of patenting in the US semiconductor industry, 1979-1995’, Rand Journal of Economics, 32, 101-128.
Hinze, S. Reiss, T. and Schmoch, U. (1997), ‘Statistical Analysis on the Distance between Fields of Technology’, Report for the European Commission, TSER project.
18
Khan, B.Z. and Sokoloff, K.L.(1993), ‘ “Schemes of Practical Utility”: entrepreneurship and innovation among ‘Great Inventors’ in the United States, 1790–1865’, Journal of
Economic History, 53, 289–307.
Kleinknecht, A. and van der Panne, G. (2010), ‘The propensity to patent an innovation: comparing entrepreneurial to routinized innovators’, mimeo.
Kortum, S. and Lerner, J. (1999), ‘What is behind the recent surge in patenting?’, Research Policy, 28, 1-22.
Kuznets, S. (1962), ‘Inventive activity: problems of definition and measurement’ in NBER, The Rate and Direction of Inventive Activity, Princeton University Press, Princeton.
Levin, R. C, Klevorick, A. K., Nelson and R.R., Winter, S. G. (1987), ‘Appropriating the returns from industrial research and development’, Brookings Papers on Economic Activity, 3, 783-831.
Mairesse, J. and Mohnen, P. (2010), ‘Using innovation surveys for econometric analysis’, in Hall, B. H. and Rosenberg, N. (eds.), Handbook of Economics of Innovation, vol. II, Elsevier: Amsterdam.
Mäkinen, I. (2007), ‘To Patent or not to patent? An innovation-level investigation of the propensity to patent‘, VTT Publication Series No. 646.
Mansfield, E. (1986), ‘Patents and innovation: an empirical study’, Management Science, 32, 173-181.
Meisenzahl, R. and Mokyr, J. (2010), ‘The rate and direction of invention in the British Industrial Revolution. Incentives and institutions’, NBER Working paper, n. 16993.
Moser, P. (2002), The Determinants of Innovation. New Evidence from Nineteenth Century World Fairs,
PhD Thesis, University of California-Berkeley.
Moser, P. (2005), ‘How do patent laws influence innovation ? Evidence from nineteenth century world’s fairs’, American Economic Review, 95, 1214-1236.
Moser, P. (2010), ‘Innovation without patents. Evidence from world fairs’, Stanford University, mimeo.
Mowery, D. C. and Ziedonis, A.A. (2002), ‘Academic patent quality and quantity before and after the Bayh-Dole act in the United States’, Research Policy, 31, 399-418.
Mowery D., Nelson R., Sampat B. and Ziedonis A. (2001), ‘The growth of patenting and licensing by U.S. universities: an assessment of the effects of the Bayh-Dole Act of 1980’, Research Policy, 30, pp. 99-119.
Nicholas, T. (2011), ‘Did R&D firms used to patent ? Evidence from the first innovation surveys’,
Journal of Economic History, 71, 1032-1059.
Nuvolari, A. and Verspagen, B. (2007), ‘Lean’s Engine Reporter and the development of the Cornish engine. A reappraisal’, Transactions of the Newcomen Society, 77, 167-189.
Nuvolari, A. and Verspagen, B. (2009), ‘Technical choice, innovation and British steam engineering, 1800-1850’, Economic History Review, 62, 685-710.
19
behavior of firms‘, Journal of Evolutionary Economics, 16, 109–135.
Scherer, F. M. (1983), ‘The propensity to patent’, International Journal of Industrial Organization, 1, 107-128.
Scherer, F. M. (1989), ‘Comments on Z. Griliches,”Patents: Recent Trends and Puzzles”’, Brookings Papers on Economic Activity, vol. 9,pp. 291-330.
Scherer, F. M. (1999), New Perspectives on Economic Growth and Technological Innovation, Brookings Institution, New York.
Schmookler, J. (1966), Invention and Economic Growth, Harvard University Press, Cambridge (MA).
Silverberg, G. and Verspagen, B. (2007), ‘The size distribution of inventions revisited: an application of extreme value statistics to citation and value measure of patent significance’, Journal of Econometrics, 139, 318–339.
Sullivan, R. J. (1989), ‘England’s “age of invention”: the acceleration of patents and patentable invention during the Industrial Revolution’, Explorations in Economic History, 26, 429-443.
Taylor, C. T. and Silberston, Z. A. (1973), The Economic Impact of the Patent System. A Study of the British Experience, Cambridge University Press, Cambridge.
Thomson, R. (2009), Structures of Change in the Mechanical Age. Technological Innovation in the United States, 1790-1865, John Hopkins University Press, Baltimore.
Trajtenberg, M., (1990), ‘A penny for your quotes: patent citations and the value of innovations’
Rand Journal of Economics 21, 172–187.
Van Zeebroeck, N., (2011), ‘The puzzle of patent value indicators’, Economics of Innovation and New Technology, forthcoming.
Von Tunzelmann, G. N. (1970), ‘Technological diffusion during the Industrial Revolution. The case of the Cornish pumping engine’ in Hartwell, R. (ed.), The Industrial Revolution, Basil Blackwell, Abingdon.
20
LIST OF TABLES
Table 1: Patent citations received by awarded innovations and by a random sample of patents (matched by granted year and technology class)
Number Mean Median Standard
deviation
Min Max
R&D 100 patents
535 12.88037 7 16.17822 0 137
Random Sample
5331 8.483024 4 14.11133 0 329
21
Table 2: Total awarded innovations and patents
Awarded innovations Patented innovations Share not patented
All the sample (1977-2004) 2802 255 90.9%
Non corporate 886 25 97.16%
22
Table 3: Patenting Rates of ‘R&D 100’ innovations
All applicants Only corporate
OST5 OST30
No. of Innovations Share Patented No. of Innovations Share Patented 1
Electrical engineering &
devices 274 0.1350 177 0.1751
2 Audiovisual technology 19 0.1053 12 0.1667
3 Telecommunications 32 0.1563 20 0.25
4 Information Technologies 255 0.0824 157 0.1210
5 Semiconductors 148 0.1149 90 0.1333
Electrical engineering
728 0.1126 728 0.1513
6 Optics 198 0.1111 123 0.1545
7 Control technology 629 0.0493 384 0.0729
8 Medical technology 125 0.1120 91 0.1209
27 Nuclear engineering 75 0.0400 41 0.0732
Instruments
1027 0.0682 639 0.0954
9 Organic chemistry 0 - 0 -
10 Polymers 47 0.1489 41 0.1463
11 Pharmaceutics 0 - 0 -
12 Biotechnology 87 0.0690 51 0.0588
14 Food chemistry 0 - 0 -
15 Basic materials chemistry 42 0.2857 31 0.3870
Chemistry, Pharma
176 0.1420 123 0.1703
13 Materials metallurgy 240 0.1458 167 0. 2036
16 Chemical engineering 220 0.1091 118 0. 1525
17 Surface technology 0 - 0 -
18 Materials processing 8 0 0 -
20 Environmental technology 154 0.0714 81 0. 1235
24 Handling & printing 0 - 0 -
25 Food processing 0 - 0 -
Process engineering
622 0.1125 366 0.1694
19 Thermal processes 34 0.0882 23 0.1304
21 Machine tools 77 0.1169 47 0.1702
22 Engines 0 - 0 -
23 Mechanical elements 43 0.0465 30 0.0333
26 Transport 27 0.0370 0 -
28 Space technology 9 0.1111 0 -
29 Consumer goods 59 0.1017 44 0.1364
30 Civil engineering 0 - 0 -
Mechanical engineering
249 0.0884 144 0.125