THIS MOVIE THEATER SMELLS DIFFERENT: THE EFFECT OF AMBIENT SCENT ON MOVIEGOER EVALUATIONS AND BEHAVIORS
José Manuel Cristóvão Veríssimoa*
Rui Luis Alves Pereirab
a
Assistant Professor of Marketing, ISEG – Lisboa School of Economics & Management, Universidade de Lisboa
6 Rua do Quelhas, 1200-781 Lisbon, Portugal
E-mail: [email protected], Tel: +351 213925950 *Corresponding author
b
Board Member Assistant, Zon Lusomundo Cinemas 9 Rua Ator António Silva, 1600-404 Lisbon, Portugal E-mail: [email protected], Tel: +351 217824400
Word Count: 6,025
Acknowledgments
ABSTRACT
This article discusses the effects of ambient scent on moviegoer evaluations and behaviors. We conducted a “natural experiment” wherein an ambient scent was introduced to movie theaters. After a preliminary study to select the scent for use in the experiment, 407 moviegoers completed a questionnaire at the end of movie screenings, 204 of whom were spectators subject to the aromatic stimulus. The introduction of scent produced significant differences in general evaluations of the theater, its environment, the sales of concession products, and moviegoers’ intention to return. These results are in line with those from existing literature, except for those on the impact of ambient scent on product evaluations. The study’s findings are of practical interest to retailers, since they provide suggestions on enhancing the quality of consumer experiences and on the differentiation of spaces.
THIS MOVIE THEATER SMELLS DIFFERENT: THE EFFECT OF AMBIENT SCENT ON MOVIEGOER EVALUATIONS AND BEHAVIORS
1. Introduction
It is becoming increasingly difficult and unsatisfactory to differentiate stores by price, products, location, or communication. Since it is impossible to disregard the sense of smell, which provokes immediate emotions (Bradford & Desrochers, 2009), retail managers are looking towards “sensory marketing” (Krishna, 2012) as a source of competitive advantage that may determine success or failure. Service environments have been researched in terms of many variables, including music (e.g., Smith & Curnow, 1966; Milliman, 1982, 1986; Yalch & Spangenberg, 1990; Donovan, Rossiter, Marcoolyn, & Nesdale, 1994; Dubé, Chebat, & Morin, 1995; McDonnell, 2007), point-of-purchase color and display (e.g., Cox, 1964, 1970; Patton, 1981; Bellizzi, Crowley, & Hasty, 1983; Crowley, 1993; Spies, Hesse, & Loesch, 1997; Baker, Parasuraman, Grewal, & Voss, 2002), lighting (e.g., Baker, Levy, & Grewal, 1992; Areni & Kim, 1994;), crowding (e.g., Hui & Bateson, 1991; Machleit, Kellaris, & Eroglu, 1994; Machleit, Eroglu, & Mantel, 2000), and ambient scent (e.g., Bone & Jantrania, 1992; Hirsch, 1995; Mitchell, Kahn, & Knasko, 1995; Spangenberg, Crowley, & Henderson, 1996; Chebat & Michon, 2003; Davis, Kooijman, & Ward, 2003; Spangenberg, Grohmann, & Sprott, 2005; Guéguen & Petr, 2006; Parsons, 2009; Lwin & Morrin, 2012). While music, color, light, and in-store consumer density have been treated as atmospheric stimuli (cf. Turley & Milliman, 2000 for a review of environmental stimuli), scents are often associated with brands or products (e.g., Parsons, 2009).
Bone & Ellen, 1999; Mattila & Wirtz, 2001; Bosmans, 2006; Ward, Davies, & Kooijman, 2007), especially in actual retail contexts (Turley & Milliman, 2000; Morrison, Gan, Dubelaar, & Oppewal, 2011). Faced with ambiguous results often obtained through
laboratory experiments on college students (Teller & Dennis, 2012), in this study, we seek to answer the following question: What are consumers’ reactions to an olfactory stimulus in a retail environment?
Movie theaters are “boxes” wherein sensory stimuli are diffused and there is less chance of distraction by phones or electronic media (Philips & Noble, 2007). They are also real environments where millions of people experience the emotions evoked by movies on a daily basis. Thus, the specific objectives of this research are to test empirically the effects of ambient scents on (1) the overall perception of the movie theater; (2) its environment; (3) the concession products available; (4) spending on these products; and (5) spectator behavior.
2. Theoretical Framework
2.1. Store environment and the consumer
The environment transmits tangible and intangible clues that help consumers,
employees, partners, and opinion makers to understand the concept and character of a service. Ambient factors (e.g., temperature, lighting, music, scents, and color) condition atmospheres, which affect consumer feelings and reactions; their cognitive and affective impacts are manifested rationally, emotionally, behaviorally, and physiologically (Mudie & Pirrie, 2006). Kotler (1973) argues that the atmosphere influences buying behavior by highlighting,
informing, and provoking consumer emotions. Mehrabian and Russell (1974) summarize the effects of environmental variables on consumers in the stimulus-organism-response
(S→O→R) paradigm, whereby the environment stimulates (S) individuals with information
approach (e.g., the desire to stay longer) or avoidance (e.g., not exploring the service or product). Similarly, Bitner (1992) explores the effect of the physical environment on consumer and employee behavior. Consumer perception is thus influenced by environment, spatial layout, functionality, symbols, and artifacts. Since individuals tend to perceive these dimensions as a whole, the key to effective design is understanding the way in which each individual dimension fits in with the rest.
2.2. Scents and consumer responses
The physical environment of a store is a form of “oral” communication (Kooijman, 2003) that includes words, attitudes, gestures, smells, tastes, and nonverbal messages (Ward, Davis, & Kooijman, 2003). Ambient scents are present in ambient environments and are relevant to the evaluation of products and environments (Gueguen & Petr, 2006). The principal dimensions of scents are presence (or absence), sympathy, and congruency to the object with which they are combined (Bone & Ellen, 1999). Ambient scents can positively stimulate consumer behavior by creating a pleasant atmosphere and conveying a sense of pleasure and well-being. Scents also promote nostalgic memories of emotions (Davies, Kooijman, & Ward, 2003; Orth & Bourrain, 2008; Lwin, Morrin, & Krishna, 2010; Krishna, Lwin, & Morrin, 2010).
(Bone & Jantrania, 1992); therefore, management should ensure compatibility between atmosphere, identity, and image (Ward, Davis & Kooijman, 2003, 2007). Desire or distaste for a scent is a factor in approach/avoidance responses, which makes it appropriate to study olfactory stimuli in consumer reactions to store environments.
3. Research hypotheses
A movie theater is an entertainment space, in which strong emotions are aroused and where the senses are put to the test. The air in theatres during continuous screenings can often become heavy and unbearable; thus, treating the air with pleasantly scented purifiers may bring about beneficial results. In this study, we evaluate the introduction of a harmonious aromatic stimulus according to the following five factors: the movie theater, its environment, the available concession products, spending on products sold at the theater, and intention to return to the theater.
3.1. Overall and environmental evaluation of the movie theater
The physical environment influences behavior, creates a positive image, and shapes consumer purchasing patterns and perceptions of store environments (McGoldrick & Pieros, 1998); this generates emotional, cognitive, and behavioral responses (Gardner & Siomkos, 1986; Michon, Chebat & Turley, 2005). Atmospheric perception and performed behaviors are consequences of these emotional states (Mehrabian & Russell, 1974) and cause human
H1: The presence of an aromatic stimulus generates a more positive overall evaluation of the movie theater than does the same environment in the absence of an aromatic stimulus.
H2: The presence of an aromatic stimulus generates a more positive evaluation of the movie
theater’s environment than does the absence of a stimulus.
3.2. Evaluation of products and services
A product’s quality corresponds to judgments of its superiority or excellence
(Zeithaml, 1988). Since scent significantly influences perception of a store’s environment and the quality of its merchandise (Bitner, 1992; Baker, Grewal & Parasuraman, 1994; Chebat & Michon, 2003), it may modulate evaluations of both these features. Spangenberg, Crowley, and Henderson (1996) and Parsons (2009) show that significant improvements in the evaluations of environments and products occur in scented stores. However, for a scent to produce the desired effect, it must be consistent with and appropriate to the product or store in which it is smelled (Bone & Jantrania, 1992; Bone & Ellen, 1999; Bosmans, 2006). Since products are an integral component of stores, scents should influence perceptions of their products.
H3: The presence of an aromatic stimulus generates a more positive evaluation of a movie
theater’s concession products than does the absence of a stimulus.
3.3. Spending on concession products at movie theaters
Pleasant retail environments contribute significantly to increased levels of unplanned purchases (Donovan, Rossiter, Marcoolyn, & Nesdale, 1994), improve evaluations of
positive impacts on respondent attitudes to the displayed product, purchase intent, and price. Similarly, Hirsch (1995) notes that casino players exposed to appropriate scents spend more money than those who are not subjected to them. Consumers appear more willing to buy when the environment “smells good” and is harmonious with products, since scents allow them to retrieve memories and emotions attached to the store and its goods, thus encouraging purchases (Mitchell, Kahn & Knasko, 1995).
H4: The presence of an aromatic stimulus generates more spending on concession products available at the theater than does the absence of a stimulus.
3.4. Intention to return to the theater
Pleasant environments are capable of producing approach behaviors and greater return intentions (e.g., Chebat & Michon, 2003; McDonnell, 2007). The affective qualities of scent seem positively correlated with increased intention to return.
H5: The presence of an aromatic stimulus generates greater intent to return to a movie theater than does the absence of a stimulus.
4. Pre-test
4.1 Stimulus, procedure, and participants
according to 10 pairs of bipolar semantic differential scales, as suggested by Spangenberg, Crowley, and Henderson (1996). The items used consist of the following 7-point scales: negative/positive, unattractive/attractive, tense/relaxing, uncomfortable/comfortable, bad/good, boring/stimulating, unlively/lively, dull/bright, demotivating/motivating, and uninteresting/interesting; Cronbach’s α = .98. The congruence of the scent with the movie theater was evaluated using a four-item Likert-type scale adapted from Spangenberg, Grohmann, and Sprott (2005), which is anchored between strongly disagree and strongly agree. The items used consist of “This scent reminds me of my trips to the movies,” “When I smell this scent, I think of the movies,” “This scent makes me feel as if I am at the movies,”
and “This scent captures the spirit of the movies”; Cronbach’s α = .98. A 7-point scale
(anchored between very weak and very strong) was used to measure the perceived intensity of the scent.
4.2 Results
significant). There were no differences in terms of scent intensity (p > .25), with ratings ranging from 4.8 to 5.4 (less than 1.5 standard deviations); Duncan multiple range tests showed no significant differences in perceived strength between scents. Therefore, the Cola-Lemon scent was chosen for the present study.
5. Effects of scent in the movie theater
5.1 Procedure
The experiment took place in a Zon Lusomundo 10-theater complex at the Colombo Shopping Center in Lisbon, Portugal. The 10 theaters have an average capacity of 250 people, show recent films from diverse genres, use 100%-digital presentation media, and are open from 12:00 PM until 2:00 AM daily. The scent test took place in theaters 1 (64’ long × 51’ wide × 25’ high) and 4 (88’ long × 50’ wide × 25’ high), with capacities of 237 and 364 seats, respectively. The type of movie viewed was counterbalanced between theatres, since films rotate among theaters each week (i.e., none is screened in the same theater for longer than 1 week). This cycling ensures the absence of any relationship between scent exposure and moviegoer characteristics due to preferences for different types of movies. The ambient scent selected from the pretest was mechanically added to the theaters during the
experimental period. Calibration of scent intensity was performed according to the instructions provided by the fragrance supplier. A pilot test was conducted in two movie theaters to fine tune scent intensity. Scent dispersion was accomplished using automatic diffusion apparatuses regulated to inject and disperse 10 mL of product every 30 minutes via the air-conditioning units of the chosen theaters.
the movie theater lobby. Two analysis groups were created: one subject to the aromatic stimulus and the other as a control (i.e., subject to no aromatic stimulus).
5.2. Measurements
The measurement instrument used to evaluate the effects of scent in the movie theater was based on that of Spangenberg, Crowley, and Henderson (1996) but adjusted to the environment of movie theaters. The questionnaire was refined in multiple iterations with spectators and was approved by the company. To simplify the understanding of the survey, all of the semantic differential scales used seven points.
5.2.1. Overall evaluation of the movie theater.
Five semantic differential scales were used. The first four offer a global assessment of the movie theater’s image: unfavorable/favorable, bad/good, negative/positive, and
outdated/modern image. The fifth scale, dislike/like,measures whether participants liked the theater.
5.2.2. Evaluation of the movie theater environment.
Fourteen semantic differential scales comprised by bipolar adjectives were used to measure the movie theater’s environment; these include demotivating/motivating,
boring/interesting, and unpleasant/pleasant (cf. Table 2 for full list).
5.2.3. Evaluation of concession products.
The products available for consumption in the movie theater were assessed using four semantic differential scales: inadequate/adequate product variety, low/high prices, low/high product quality,and outdated/up-to-date products.
Sales of concession products (colas, juices, popcorn, and snacks) by a mobile vending cart between movie screenings were calculated for each of the theaters. Subsequently, the SPP variable (sales per person per session, which corresponds to the ratio of concession product sales to theater spectators) was calculated.
5.2.5. Intention to return to the theater.
The respondents were asked, “Do you plan to return to this movie theater?” A semantic differential scale of seven points was used, with anchors of unlikely/likely.
5.3 Data collection and characterization of participants
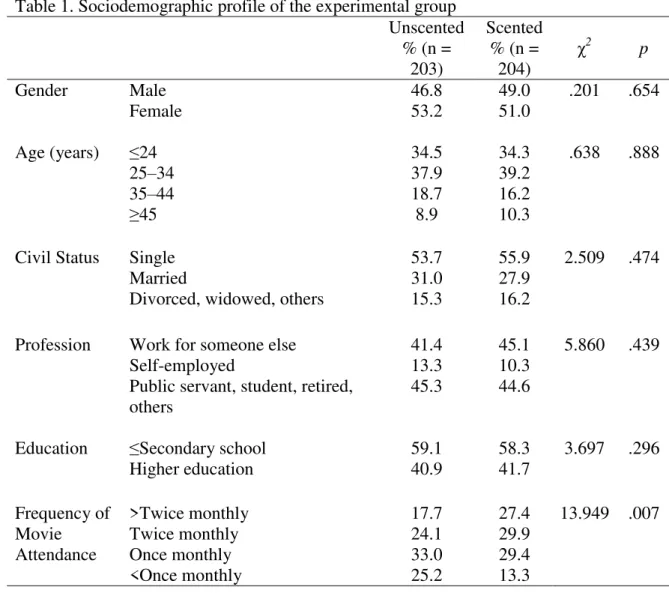
The convenience sample consisted of 407 participants who completed questionnaires between May 17 and June 12, 2012. Thirteen questionnaires were eliminated because they were not fully answered. Of the total sample, 204 questionnaires were gathered from spectators who watched movies in rooms with olfactory stimulation. Participants ranged in age from 14 to 81 years (M = 30 years; S.D. = 10.99) and were approximately equally distributed across genders (52.1% female). Chi-square tests did not show significant
sociodemographic differences between the two groups except in terms of frequency of theater visits. The sample characterization is presented in Table 1.
[Insert Table 1 about here]
5.4 Results analysis
variables in order to control for Type I error. Subsequently, one-way univariate ANOVAs were performed on the between-group comparisons for each variable. The results are shown in Table 2.
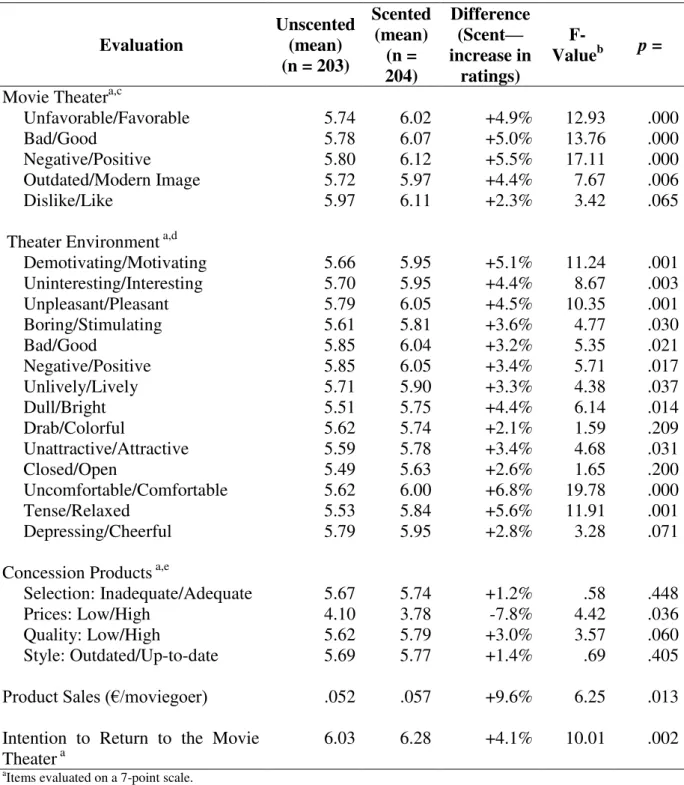
[Insert Table 2 about here]
5.4.1. H1: Impact of scent or its absence on the overall evaluation of the movie theater.
The MANOVA for the overall evaluation of the movie theater yielded significant results (F(5,401) = 4.26, p < .001) for the relevant five variables; this allowed univariate comparisons without fear of Type I errors for H1. The results of the one-way ANOVAs show that the presence of scent increased positive evaluations of scented vs. unscented movie theaters by 2.3% for dislike/like and by 5.5% for negative/positive. Scented movie theaters were evaluated more positively for all variables (p < .05) except dislike/like (p = .065). The univariate tests show that the presence of scent increased the overall positive evaluations of the movie theater, supporting H1.
5.4.2. H2: Impact of presence vs. absence of scent on evaluation of movie theater environment.
The overall MANOVA result for evaluation of the movie theater’s environment was significant (F(14,392) = 2.05, p < .05) for the 14 environmental variables. Scented movie theater environments were rated more positively in terms of 11 of these variables (p < .05), with rating increases from +2.1% for gray/colorful to +6.8% for uncomfortable/comfortable
5.4.3. H3: Impact of presence vs. absence of scent on evaluations of theater concession products.
The overall MANOVA result for the four product variables was not statistically significant (F(4,402) = 1.72, p > .10). Although product evaluations were more positive in scented theaters (more-adequate, lower-priced, higher-quality, and more–up-to-date), those assessments did not differ significantly from those of unscented theaters (p > .05), with the exception of the evaluation of price, which was significantly lower—7.8%—in scented theaters (p < .04). Although the results trended in the expected direction, the results involving concession evaluations do not support H3.
5.4.4. H4: Impact of presence vs. absence of scent on concession spending. On average, spectators in a scented theater spent 9.6% more on concession products from vending carts at the theaters during intermissions than did spectators in unscented theaters. The results of the one-way ANOVA for spending on mobile concession products were significant (p < .02), supporting H4.
5.4.5. H5: Impact of presence vs. absence of scent on intention to return to movie theater.
Moviegoers in the scented condition showed greater intent to return to the theater. The results of the one-way ANOVA on return to the movie theater were statistically significant (p
< .01), supporting H5.
6. Discussion and Conclusion
6.1 Academic Implications
theater, and intention to return. In contrast to other studies (e.g., Baker, Grewal & Parasuraman, 1994), no significant differences were found in evaluations of concession products sold in the theater, possibly due to positive prior appraisals of the variety, quality, and style of concession products (Spangenberg, Crowley & Henderson, 1996); that would mitigate the influence of ambient scent. Another explanation may be the inherent high quality of most products (Walsh, Shiu, Hassan, Michaelidou, & Beatty, 2011): they may generate negative assessments only when their quality is relatively low, since consumers generally expect high quality. It is noteworthy that spectators in scented theaters considered product prices to be significantly cheaper than did spectators in unscented theaters. Contrary to the view of Sirohi, McLaughlin, and Wittink (1998), price is evaluated more positively in scented theaters, even in the presence of other information. Overall, these results obtained in a real context support previous laboratory and practical studies. The presence of ambient scent positively influenced consumers.
6.2 Implications for management
This study’s findings are particularly interesting for both movie theater operators and
retailers in general. The introduction of a scent improved consumer evaluations, increased revenue per person, and raised return intentions. Given these results, managers should
consider three aspects. First, although the perception and interpretation of scents is a complex phenomenon, it is clear that odors significantly affect emotional reactions to products and atmospheres. Knowing ambient scents’ impacts on consumers, managers can alter the former to create enjoyable experiences and positively influence consumer responses. Second,
available, management should assess the costs and benefits of creating stable, controlled atmospheres, as that may result in considerable and unsustainable costs. The decision to scent a space, which involves both human and material resources, must be economically viable.
6.3 Limitations and future research
The experiment took place in movie theaters. To improve the external validity of the results, it is necessary to extend the research to other types of retail settings (e.g., hotels, restaurants, banks, food retail, and medical clinics) and other product categories (e.g., durable goods and pure services). This study’s findings rely on moviegoers’ self-evaluations, which may be influenced by the desire to go to the movies (Ward, Snodgrass, Chew, & Russell, 1988) or by previously formed expectations (Wirtz, Mattila, & Tan, 2007). Familiarity with cinema, which was not controlled in this study, may precondition evaluations and overlap with environmentally induced effects. Moreover, the results do not distinguish among segments of consumers: it is possible that behavioral characteristics (e.g., frequency of moviegoing) or demographics (e.g., age, gender) moderate or mediate consumer
emotions/behaviors; this possibility deserves further analysis. The Cola-Lemon scent was used for the first time in this experiment; therefore, the findings relevant to it are not fully comparable with those of other studies. Other, more-congruent scents might produce different results and should therefore be investigated. Finally, we only examined the influence of scent on consumer responses; we did not explore complex configurations of stimuli (e.g.,
combinations of scents, music, lighting, and color). Such complex configurations should be investigated, as consumers tend to have holistic views of their environs.
References
Areni, C. S., & Kim, D. (1994). The influence of in-store lighting on consumers’ examination of merchandise in a wine store. International Journal of Research in Marketing, 11(2), 117–125.
Baker, J., Levy, M., & Grewal, D. (1992). An experimental approach to making retail store environment decisions. Journal of Retailing, 68(4), 445–460.
Baker, J., Grewal, D., & Parasuraman, A. (1994). The influence of store environment on quality inferences and store image. Journal of the Academy of Marketing Science, 22(4), 328–339.
Baker, J., Parasuraman, A., Grewal, D., & Voss, G. B. (2002). The influence of multiple store environment cues on perceived merchandise value and patronage intentions. Journal of Marketing, 66(2), 120–141.
Bellizzi, J. A., Crowley, A. E., & Hasty, R. W. (1983). The effects of color in store design.
Journal of Retailing, 59, 21–45.
Bitner, M. J. (1992). Servicescapes: The impact of physical surroundings on customers and employees. Journal of Marketing, 56(4), 57–71.
Bone, P. F., Ellen, P. S. (1999). Scents in the marketplace: explaining a fraction of olfaction.
Journal of Retailing, 75(2), 243–262.
Bone, P. F., & Jantrania, S. (1992). Olfaction as a cue for product quality. Marketing Letters, 3(3), 289–296.
Bosmans, A. (2006). Scents and sensibility: When do (in)congruent ambient scents influence product evaluations? Journal of Marketing, 70(3), 32–43.
Bradford, K. D., & Desrochers D. M. (2009). The use of scents to influence consumers: The sense of using scents to make cents. Journal of Business Ethics, 90(2), 141–153. Chebat J. C., & Michon R. (2003). Impact of ambient odors on mall shoppers’ emotions,
cognition, and spending: a test of competitive causal theories. Journal of Business Research, 56(7), 529–539.
Cox, K. (1964). The responsiveness of food sales to shelf space changes in supermarkets.
Journal of Marketing Research, 1, 63–67.
Cox, K. (1970). The effect of shelf space upon sales of branded products. Journal of Marketing Research, 7, 55–58.
Davies, B. J., Kooijman, D., & Ward, P. (2003). The sweet smell of success: Olfaction in retailing. Journal of Marketing Management, 19(5–6), 611–627.
Donovan, R. J., Rossiter, J. R., Marcoolyn, G., & Nesdale, A. (1994). Store atmosphere and purchasing behavior. Journal of Retailing, 70(3), 283–294.
Dubé, L., Chebat, J. C., & Morin, S. (1995). The effects of background music on consumer’s desire to affiliate in buyer-seller interactions. Psychology and Marketing, 12, 305– 319.
Fiore, A. M., Yah, X., & Yoh, E. (2000). Effects of a product display and environmental fragrancing on approach responses and pleasurable experiences. Psychology & Marketing, 17(1), 27–54.
Gardner, M. P., & Siomkos, G. J. (1986). Toward a methodology for assessing effects of in-store atmospherics. Advances in Consumer Research, 13(1), 27–31.
Guéguen, N., & Petr, C. (2006). Odors and consumer behavior in a restaurant. International Journal of Hospitality Management, 25(2), 335–339.
Gulas, C. S., & Bloch, P. H. (1995). Right under our noses: Ambient scent and consumer responses. Journal of Business and Psychology, 10(1), 87–98.
Hirsch, A. R. (1995). Effects of ambient odors on slot-machine usage in a Las Vegas casino.
Psychology & Marketing, 12(10), 585–594.
Hui, M. K, & Bateson, J. E. G. (1991). Perceived control and the effects of crowding and consumer choice on the service experience. Journal of Consumer Research, 18(2), 174–184.
Kooijman, D. (2003). Shop-image and interaction: The use of senses in consumption space. In D. McDonagh, D. Gyi, P. Hekkert, & van Erp, J. (Eds.), Design and emotion. London: Taylor & Francis.
Kotler, P. (1973). Atmospherics as a marketing tool. Journal of Retailing, 49(4), 48–64. Krishna, A., Lwin, M. O., & Morrin, M. (2010). Product scent and memory. Journal of
Consumer Research, 37, 57–67.
Krishna, A. (2012). An integrative review of sensory marketing: Engaging the senses to affect perception, judgment and behavior. Journal of Consumer Psychology, 22, 332– 351.
Lwin, M. O., Morrin, M., & Krishna, A. (2010). Exploring the super additive effects of scent and pictures on verbal recall: An extension of dual coding theory. Journal of
Lwin, M. O., & Morrin, M. (2012). Scenting movie theatre commercials: The impact of scent and pictures on brand evaluations and ad recall. Journal of Consumer Behaviour, 11(3), 264–272.
Machleit, K. A., Kellaris, J. J., & Eroglu, S. A. (1994). Human versus spatial dimensions of crowding perceptions in retail environments: A note on their measurement and effect on shopper satisfaction. Marketing Letters, 5(2), 183–194.
Machleit, K. A., Eroglu, S. A., & Mantel, S. P. (2000). Perceived retail crowding and shopping satisfaction: What modifies this relationship? Journal of Consumer Psychology, 9(1), 29–42.
MacInnis, D. J., & Park, C. W. (1991). The differential role of characteristics of music on high- and low-involvement consumers’ processing of ads. Journal of Consumer Research, 18(2), 161–173.
Mattila, A. S., & Wirtz, J. (2001). Congruency of scent and music as a driver of in-store evaluations and behavior. Journal of Retailing, 77, 273–289.
McDonnell, J. (2007). Music, scent and time preferences for waiting lines. International Journal of Bank Marketing, 25(4), 223–237.
McGoldrick, P. J., & Pieros, C. P. (1998). Atmospherics, pleasure and arousal: The influence of response moderators. Journal of Marketing Management, 14(1–3), 173–197. Mehrabian, A., & Russel, J. A. (1974). An approach to environmental psychology.
Cambridge: MIT Press.
Michon, R., Chebat, J. C., & Turley, L. W. (2005). Mall atmospherics: The interaction effects of the mall environment on shopping behavior. Journal of Business Research, 58(5), 576–583.
Milliman, R. E. (1982). Using background music to affect the behavior of supermarket shoppers. Journal of Marketing, 46(2), 86–91.
Milliman, R. E. (1986). The influence of background music on the behavior of restaurant patrons. Journal of Consumer Research, 13, 286–289.
Mitchell, D. J., Kahn, B. E., & Knasko, S. C. (1995). There’s something in the air: Effects of congruent or incongruent ambient odor on consumer decision making. Journal of Consumer Research, 22(2), 229–238.
Morrison, M., Gan, S., Dubelaar, C., & Oppewal, H. (2011). In-store music and aroma influences on shopper behavior and satisfaction. Journal of Business Research, 64, 558–564.
Orth, U. R., & Bourrain, A. (2008). The influence of nostalgic memories on consumer exploratory tendencies: Echoes from scents past. Journal of Retailing and Consumer Services, 15, 277–287.
Parsons, A. G. (2009). Use of scent in a naturally odourless store. International Journal of Retail & Distribution Management 37(5), 440–452.
Patton W. E. (1981). Quantity of information and information display type as a predictor of consumer choice of product brands. Journal of Consumer Affairs, 15, 92–105. Philips, J., & Noble, S. M. (2007). Simply captivating: Understanding consumers’ attitudes
toward the cinema as an advertising medium. Journal of Advertising, 36(1), 81–94. Schifferstein, H. N. J., & Blok, S. T. (2002). The signal function of thematically
(in)congruent ambient scents in a retail environment. Chemical Senses, 27(6), 539– 549.
Sirohi, N., McLaughlin, E. W., & Wittink, D. R. (1998). A model of consumer perceptions and store loyalty intentions for a supermarket retailer. Journal of Retailing, 74(2), 223–245.
Smith, P. C., & Curnow, R. (1966). “Arousal hypothesis” and the effect of music on purchasing behavior. Journal of Applied Psychology, 50:255–256.
Spangenberg, E. R., Crowley, A. E., & Henderson, P. W. (1996). Improving the store environment: Do olfactory cues affect evaluations and behaviours? Journal of Marketing, 60(2), 67–80.
Spangenberg, E. R., Grohmann, B., & Sprott, D. E. (2005). It’s beginning to smell (and sound) a lot like Christmas: The interactive effects of ambient scent and music in a retail setting. Journal of Business Research, 58(11), 1583–1589.
Spangenberg, E. R., Sprott D. E., Grohmann, B., & Tracy, D. L. (2006). Gender-congruent ambient scent influences on approach and avoidance behaviors in a retail store.
Journal of Business Research 59(12), 1281–1287.
Spies, K., Hesse, F., & Loesch, K. (1997). Store atmosphere, mood and purchasing behavior. International Journal of Research in Marketing, 14(1), 1–17.
Teller, C., & Dennis C. (2012). The effect of ambient scent on consumer’s perception, emotions, and behaviour: A critical review. Journal of Marketing Management, 28(1– 2), 14–36.
Walsh, G., Shiu, E., Hassan, L. M., Michaelidou, N., & Beatty S. E. (2011). Emotions, store-environmental cues, store-choice criteria, and marketing outcomes. Journal of Business Research, 64, 737–744.
Ward, L. M., Snodgrass, J., Chew, B., & Russell, J. A. (1988). The role of plans in cognitive and affective responses to places. Journal of Environmental Psychology, 8(1), 1–8. Ward, P., Davis, B. J., & Kooijman D. (2003). Ambient smell and the retail environment:
Relating olfaction research to consumer behavior. Journal of Business and Management, 9(3), 289–302.
Ward, P., Davis, B. J., & Kooijman, D. (2007). Olfaction and the retail environment: Examining the influence of ambient scent. Service Business, 1(4), 295–316. Wirtz, J., Mattila, A. S., & Tan, R. L. P. (2007). The role of arousal congruency in
influencing consumers’ satisfaction evaluations and in-store behaviors. International Journal of Service Industry Management, 18(1), 6–24.
Yalch, R., & Spangenberg, E. (1990). Effects of store music on shopping behavior. Journal on Consumer Marketing, 7, 55–63.
Table 1. Sociodemographic profile of the experimental group Unscented
% (n = 203)
Scented % (n =
204)
χ2
p
Gender Male 46.8 49.0 .201 .654
Female 53.2 51.0
Age (years) ≤24 34.5 34.3 .638 .888
25–34 37.9 39.2
35–44 18.7 16.2
≥45 8.9 10.3
Civil Status Single 53.7 55.9 2.509 .474
Married 31.0 27.9
Divorced, widowed, others 15.3 16.2
Profession Work for someone else 41.4 45.1 5.860 .439
Self-employed 13.3 10.3
Public servant, student, retired, others
45.3 44.6
Education ≤Secondary school 59.1 58.3 3.697 .296
Higher education 40.9 41.7
Frequency of Movie Attendance
>Twice monthly 17.7 27.4 13.949 .007
Twice monthly 24.1 29.9
Once monthly 33.0 29.4
Table 2. Mean Reactions to the Presence or Absence of Scent
Evaluation
Unscented (mean) (n = 203)
Scented (mean) (n = 204) Difference (Scent— increase in ratings)
F-Valueb p = Movie Theatera,c
Unfavorable/Favorable 5.74 6.02 +4.9% 12.93 .000
Bad/Good 5.78 6.07 +5.0% 13.76 .000
Negative/Positive 5.80 6.12 +5.5% 17.11 .000
Outdated/Modern Image 5.72 5.97 +4.4% 7.67 .006
Dislike/Like 5.97 6.11 +2.3% 3.42 .065
Theater Environment a,d
Demotivating/Motivating 5.66 5.95 +5.1% 11.24 .001
Uninteresting/Interesting 5.70 5.95 +4.4% 8.67 .003
Unpleasant/Pleasant 5.79 6.05 +4.5% 10.35 .001
Boring/Stimulating 5.61 5.81 +3.6% 4.77 .030
Bad/Good 5.85 6.04 +3.2% 5.35 .021
Negative/Positive 5.85 6.05 +3.4% 5.71 .017
Unlively/Lively 5.71 5.90 +3.3% 4.38 .037
Dull/Bright 5.51 5.75 +4.4% 6.14 .014
Drab/Colorful 5.62 5.74 +2.1% 1.59 .209
Unattractive/Attractive 5.59 5.78 +3.4% 4.68 .031
Closed/Open 5.49 5.63 +2.6% 1.65 .200
Uncomfortable/Comfortable 5.62 6.00 +6.8% 19.78 .000
Tense/Relaxed 5.53 5.84 +5.6% 11.91 .001
Depressing/Cheerful 5.79 5.95 +2.8% 3.28 .071
Concession Products a,e
Selection: Inadequate/Adequate 5.67 5.74 +1.2% .58 .448
Prices: Low/High 4.10 3.78 -7.8% 4.42 .036
Quality: Low/High 5.62 5.79 +3.0% 3.57 .060
Style: Outdated/Up-to-date 5.69 5.77 +1.4% .69 .405
Product Sales (€/moviegoer) .052 .057 +9.6% 6.25 .013
Intention to Return to the Movie Theater a
6.03 6.28 +4.1% 10.01 .002 a
Items evaluated on a 7-point scale.
b
Univariate F-tests with (1,405) d.f.
c
Global MANOVA of the 5 movie theater evaluations. F(5,401) = 4.26, p < .001.
dGlobal MANOVA of the 14 evaluations of the movie theater’s environment.
F(14,392) = 2.05, p < .05.
e