Lateral interactions in visual perception of temporal signals:
cortical and subcortical components
Claudio E. C. Teixeira
1,2, Luiz Carlos L. Silveira
1,2and Jan Kremers
2,31 - Universidade Federal do Pará, Belém, PA, Brazil
2 - University of Erlangen - Nürnberg, Erlangen, BY, Germany
3 - University of Bradford, Bradford, WYK, UK
Abstract
The aim of this work was to isolate and investigate subcortical and cortical lateral interactions involved in licker perception. We quantiied the perceived licker strength (PFS) in the center of a test stimulus which was simultaneously modulated with a surround stimulus (50% Michelson contrast in both stimuli). Subjects were requested to adjust the modulation depth of a separate matching stimulus that was physically identical to the center of the test stimulus but without the surround. Using LCD goggles, synchronized to the frame rate of a CRT screen, the center and surround could be presented monoptically or dichoptically. In the monoptic condition, center-surround interactions can have both subcortical and cortical origins. In the dichoptic condition, center-surround interactions cannot occur in the retina and the LGN, therefore isolating a cortical mechanism. Results revealed both a strong monoptic (subcortical plus cortical) lateral interaction and a weaker dichoptic (cortical) lateral interaction. Subtraction of the dichoptic from the monoptic data revealed a subcortical mechanism of the lateral interaction. While the modulation of the cortical PFS component showed a low-pass temporal-frequency tuning, the modulation of the subcortical PFS component was maximal at 6 Hz. These indings are consistent with two separate temporal channels inluencing the monoptic PFS, each with distinct lateral interactions strength and frequency tuning characteristics. We conclude that both subcortical and cortical lateral interactions modulate licker perception. Keywords: temporal processing, monoptic lateral interactions, dichoptic lateral interactions, cortical interactions, subcortical interactions, licker perception.
Received 21 December 2011; received in revised form 4 March 2011; accepted 5 March 2011. Available on line 15 June 2011
Claudio E. C. Teixeira, Biological Sciences Institute,
Tropical Medicine Nucleus, Federal University of Pará, Belém,
Pará, Brazil, Dept. of Ophthalmology, University Hospital Erlangen, University of Erlangen-Nürnberg, Germany. Luiz Carlos L. Silveira, Biological Sciences Institute, Tropical
Medicine Nucleus, Federal University of Pará, Belém, Pará,
Brazil. Jan Kremers, Dept. of Ophthalmology, University Hospital Erlangen, University of Erlangen-Nürnberg, Germany, School of Life Sciences, University of Bradford, Bradford, UK. Correspondence regarding this article should be directed to: Dr. Jan Kremers, Dept of Ophthalmology,
University of Erlangen-Nürnberg, Schwabachanlage 6, 91054 Erlangen, Germany. E-mail: [email protected]
Introduction
In the primate lateral geniculate nucleus (LGN), the response amplitudes of M and P cells are inluenced by the interactions between their receptive ield (RF) centers
and surrounds. With the center and surround stimuli matching the cells’ classical RFs’ centers and surrounds, the strength of these interactions depend on the relative
modulation phase between the two stimuli (Kilavik, Silveira, & Kremers, 2003; Kremers, Kozyrev, Silveira,
& Kilavik, 2004; Kozyrev, Silveira, & Kremers, 2007). Psychophysically, the perceived licker strength (PFS) in a central ield simultaneously modulated with a surround
depends not only on the physical modulation contrasts
in the central and surrounding ields, but also on their
relative modulation phase. The PFS is strong when center and surround stimuli modulate in counter-phase and
weak when the two modulate in-phase (Kremers et al., 2004; Kozyrev et al., 2007; Kremers & Rimmele, 2007).
However, the similarities between cell responses and psychophysical PFS in a central stimulus go beyond these
supericial analogies. First, owing to small differences in
the response latencies of LGN RFs center and surround, the antagonism between the two changes with temporal
frequency. Temporal frequency has a similar inluence upon the PFS in the central stimulus (Kremers et al., 2004). More recently, a model linking the responses of
an array of LGN cells with different RFs locations to
perception was described (Kozyrev et al., 2007), what led
to the proposal that the physiological basis of PFS can be found already in subcortical structures.
Although the similarities between subcortical
proof that the two are related is lacking. Recently, additional evidence of the importance of subcortical structures was obtained by comparing the interactions between center and
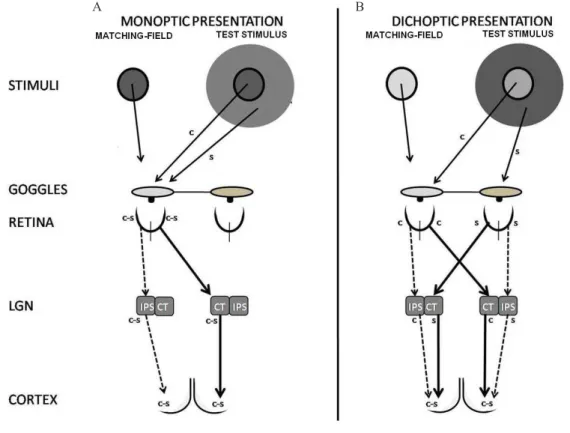
surround stimuli under two conditions (D’Antona, Kremers, & Shevell, 2008). In the irst condition, the two stimuli were
presented monoptically. In this case, the interaction can
take place at the subcortical and the cortical levels (Figure 1A). In the second condition, the two stimuli are presented
dichoptically and the interaction can only have a cortical origin since the signals from the two eyes merge at a cortical
level (Figure 1B). The difference between monoptic and
dichoptic data extracts the subcortical component in lateral
interactions. In both conditions, subjects matched the PFS in the center test stimulus by adjusting the modulation depth
in a matching stimulus that was physically identical to this center stimulus but without the surround. It was found that the PFS depends more strongly upon the relative phase between center and surround stimuli when the two are presented monoptically than when presented dichoptically
(D’Antona et al., 2008). The interpretation of the data by
these authors is that cortical interactions are stronger than
subcortical interactions and play a major role in the monoptic PFS (D’Antona, Kremers, & Shevell, 2011 – in submission).
However, the psychophysical approach used
by D’Antona et al. (2011) possibly inluenced their
data. In their work, the PFS was measured by using a
test stimulus of which the center and surround were
always presented to one eye (either to the same eye in
monoptic or to different eyes in dichoptic conditions)
but the matching stimulus was presented to the two eyes. Owing to inter-ocular interaction, the contrast in
the matching ield might be inluenced by this type of
presentation. As a result, the dynamic range of matching stimuli decreases and might make the results of PFS measurements less accurate. In the present study, we decided to quantify the PFS measurements by using a
monocularly presented matching ield (Figure 1). Our results conirm the data of D’antona et al. (2011), i.e. the PFS depends more strongly upon the
relative phase between center and surround stimuli when the two are presented monoptically, indicating the presence of cortical and subcortical mechanisms of
lateral interactions. However, we ind larger subcortical
components than they do.
Parts of the results were previously presented in an
abstract form (Teixeira & Kremers, 2009).
Methods
Participants
Three healthy subjects participated as observers in the present study, two of the authors (CT and JK,
Figure 1. Test stimulus and matching-ield presentations in monoptic (A) and dichoptic (B) conditions and and the putative respective
sites of possible lateral interactions in the visual pathway. c, center; s, surround; c-s, center-surround interactions; IPS, ipsilateral; CT, contralateral. The center and surround test stimuli have 1° and 3° outer diameter, respectively. The matching ield has 1° outer diameter.
ages 32 and 50, respectively) plus one naïve subject (GP, age 32). All subjects had normal color vision and
underwent an extensive ophthalmological examination. There were no signs of retinal disorders. All the psychophysical measurements were performed under dark-adapted conditions using natural pupils and full optical correction. All experimental procedures adhered to the Helsinki Declaration.
Apparatus
The stimuli were presented on an EIZO L360 monitor controlled by a Matrox Millenium G550
graphic card using commercially available software
(VisionWorksTM 4.0 for Windows). Two different stimuli
(a test stimulus and a matching stimulus) were displayed simultaneously (Figure 1).
The test stimulus consisted of a spatially homogenous circular center and a spatially homogenous annular surround. The outer diameters of the center stimulus and of the surround were 1° and 3°, respectively.
There was a small annular gap (0.1°) between the center
and the surround. This annular gap was included to enable a perceptual separation of the center circle from its surround at all conditions. In addition, to reduce
residual licker in the center circle produced by
high-frequency temporal modulation at the edge between
center and surround stimuli (Kremers et al., 2004). The
distance between the outer diameters of the surround
test stimulus and the matching stimulus was 5°. While the center and surround stimuli had equal
mean luminances (45 cd/m2) and chromaticities (10, 30, and 5 cd/m2 mean luminance of the red, green, and blue
phosphors, respectively, resulting in a white with CIE 1964 coordinates: X = 0.3330, Y = 0.3263), the background had slightly higher mean luminance (50 cd/m2) but with the same chromaticity (11.11, 33.33, and 5.55 cd/m2
mean luminance of the red, green, and blue phosphors,
respectively, resulting in a white; CIE 1964 coordinates were X = 0.3330, Y = 0.3263). Stray light would result in
an increased sensitive to in-phase modulation of center and surround stimuli and a decreased sensitivity to counter-phase modulation. However, the results are reversed strongly suggesting that stray light has a minor effect on the
mechanisms under investigation in this work (see below).
The stimuli were viewed through goggles with LCD
shutters (NuVision 60GX, NuVision Technologies Inc.).
An infrared emitter synchronized the LCD shutters to the monitor’s refresh rate. When the shutters were opened,
they transmitted 20% of the light. As a result, we can
estimate that the center and surround stimuli had mean
luminance of 9 cd/m2 (2, 6, and 1 cd/m2 mean luminance of the red, green, and blue phosphors, respectively; the
shutters did not alter the stimulus’ chromaticity because
the LCD shutters were spectrally neutral).
The luminance of the center and surround stimuli
was sinusoidally modulated in time with 50% Michelson
contrast. This relatively high contrast was chosen to get reliable psychophysical data at all stimulus conditions. As the contrast of the test stimulus was constant at all conditions, contrast dependent saturation does not
inluence the results. The measurements were performed at three temporal frequencies (3, 6, and 12 Hz). The
center and surround stimuli had identical temporal frequencies, time averaged luminances, and time averaged chromaticities.
The matching stimulus consisted of single stimulus with the same shape, size, temporal frequency, time averaged luminance, and time averaged chromaticity as the central circle of the test stimulus. The contrast of the matching stimulus was variable and set by the observer until the PFSs in the matching stimulus and in the center of the test stimulus were matched.
The matching stimulus and the center of the test stimulus were presented to the left eye. The measurements were performed in two conditions: one in which the surround of the test stimulus was presented also to the
left eye (monoptic condition) and one in which it was presented to the right eye (dichoptic condition) (Figure 1).
While the surround stimulus was presented selectively to the left or right eye, an unmodulated light of equal time averaged luminance was presented to the other eye.
Procedure
The PFS measurements were done randomly at 13
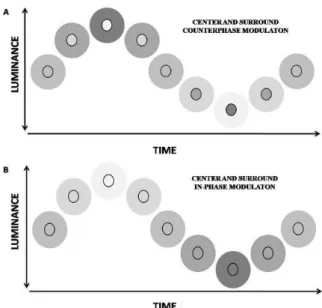
relative center-surround test stimulus phases: -180°, -150°, -120°, -90°, -60°, -30°, 0°, 30°, 60°, 90°, 120°, 150° and 180° (Figure 2). A two-alternative
forced-choice method was used to match the PFS in the matching stimulus to the one in the center of the test stimulus in both the monoptic and dichoptic presentation
conditions. Subjects were requested to indicate, by pressing a button, whether the perceived licker in the
test stimulus was stronger or weaker than the perceived
licker in the center of the matching stimulus. In each PFS measurement run, subjects viewed the matching
stimulus and the center test stimulus, free to make eye and small head movements, for as long as necessary to
make a perceived-licker judgment.
In each PFS measurement, the contrast in the matching stimulus was varied and the test stimulus was not
altered. Each time the subject indicated that the perceived licker in the matching stimulus was stronger than in the
center test stimulus, the matching stimulus contrast was
decreased. It was increased each time subject indicated that the perceived licker of the matching stimulus was
weaker than in the center test stimulus.
Two staircases, one starting at 0% and the other at 100% contrast, were used. The contrasts in the matching stimulus were initially changed in 10% steps. After a irst change in response (from a weaker to a stronger PFS in
the test stimulus or vice versa), the direction of contrast
to 5%. Subsequent changes in response led to a change in step direction and further decreasing step sizes (3%, 2%, and 1% respectively). Once a 1% contrast step was
reached two additional changes in response resulted only in a direction reversal without a change in step size. After six changes in response, it was assumed that the PFSs in the matching stimulus and in the center test stimulus matched for that staircase. Thus, in each PFS measurement run two independent estimates of the PFS
in the center test stimulus were obtained (one from each staircase). A PFS measurement run was always completed
within one session. Each run was repeated three times. The means and standard deviations of the six matching PFS estimates from these three runs using two staircases
were calculated. The standard deviation of the results
shows that PFS’s could be estimated with 10% reliability.
However, the reliability was much better in most cases.
Results
Perceived licker strength
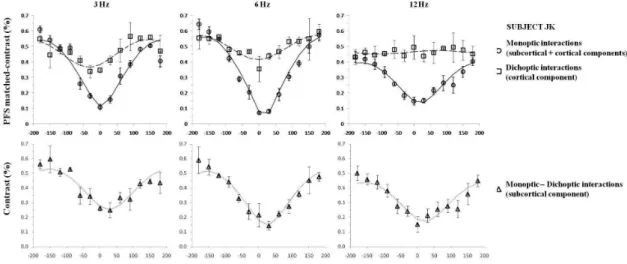
Figures 3-5 (top panels) display the mean PFS
as a function of the phase difference between center
and surround for the three subjects, at three different temporal frequencies (3, 6 and 12 Hz) for the monoptic
and dichoptic conditions. The PFS depends strongly on relative center-surround phase. There was a range
of relative phase differences (between -30° and 30°) in which almost no licker was perceived in the center
stimulus in the monoptic test condition. In the dichoptic
condition, licker was perceived at all phase differences. The modulation of the PFS (i.e. the change of PFS as a function of relative phase) quantiies the strength of
the lateral interaction. The modulation of the PFS was larger in the monoptic stimulus presentations at all temporal frequencies. The modulation of the dichoptic PFS decreases between 3 and 12 Hz.
As mentioned above, the PFS modulation in the dichoptic condition probably has a cortical origin. The PFS modulation in the monoptic condition can have cortical and
subcortical origins. Thus, for each subject, we estimated the
subcortical component contribution to the phase dependent PFS by subtracting the dichoptic PFS from the monoptic PFS data. We implicitly assume that the two components do not interact and are completely independent. The estimated subcortical PFSs are shown in the lower panels
of Figures. 3-5. The modulation of the dichoptic (cortical)
PFS component is similar or smaller than the modulation of the estimated subcortical PFS component at 6 Hz. Figure 2. Schematic diagram showing one modulation cycle
of the center and surround stimuli for counterphase (A) and in-phase (B) modulation.
Figure 3. Top: The PFS (mean of six measurements ± SD) in the center test stimulus plotted as a function of the phase
Figure 4. The same data as in Figure 3 for subject JK.
Figure 5. The same data as in Figure 4 for subject GP.
Linear vector addition model
In prior work, it was found that the responses of LGN neurons are adequately modeled by a linear vector addition of the responses to the center and to the surround stimuli. Assuming that the linear addition is
also applicable to describe the perceived licker strength, the psychophysical data were itted by Equation 1 (Kremers et al., 2004; Kozyrev et al., 2007):
,where RC and RS are the selective psychophysical responses to the center and surround stimuli, respectively. As the amplitude modulation of the PFS in the center test
ield depends on the response to the surround ield, which in turn depends on its spatial extent (Kremers & Rimmele, 2007; Teixeira & Kremers, 2009), RS quantiies the PFS
modulation and thus the strength of lateral interactions.
S is the phase of the surround stimulus relative to the
phase of the center stimulus, and P is the relative phase of the response to center and surround stimuli at a minimal
PFS. The curves in Figures 3-5 are its of this model to the data. Equation 1 was itted to the data using the Solver routine of the Microsoft©Excel 2007 program. The itting routine changed the free parameters R
C, RS
(both expressed in Michelson contrast) and P (expressed
in degrees) to minimize the sum of squared distance between model it and experimental data at each relative stimulus phase. From the its of the model, we obtained
estimates of the three free parameters, R
C, RSand P. Here,
these parameters do not symbolize the psychophysical instead of physiological responses. Thus, as we describe the perception data in terms of equivalent contrasts, R
C
and R
Sare expressed not in spikes per second but in
Michelson contrast.
The psychophysical data were described satisfactorily by this model. However, the phases were not well constrained
small. Therefore, we disregarded the phase estimates from
those its in which the difference between the maximal and
minimal values of the PFS equivalent contrast was less than 3 times the average of the standard deviations at all
data points. All phase estimates from the its to the data
could be used, except for JK’s dichoptic PFS at 12 Hz and
for CT’s subcortical PFS at 3Hz (Figure 6). Table 1 gives all estimates obtained from the its of Equation 1.
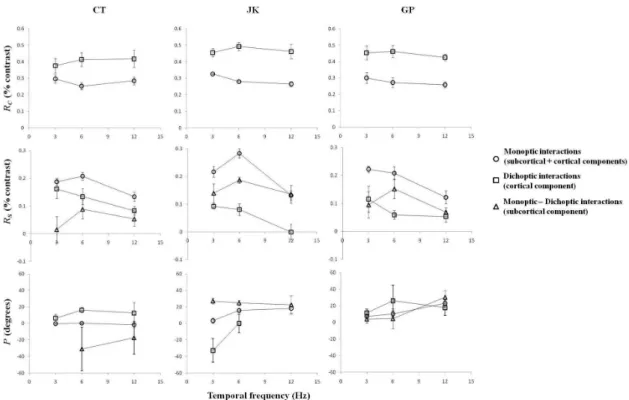
Figure 6 (top panels) displays the estimates of free
parameters as a function of temporal frequency. The upper panels show the estimated RC values. These were always larger in the dichoptic than in the monoptic stimulus conditions as a function of temporal frequency. The RC values for the subcortical mechanisms do not bear
information because they are inluenced by the subtraction
of the two sets of experimental data. Therefore they are
Table 1. Averaged parameters RC, RS (in % contrast) and P (in degrees) estimated from the its of Equation 1 to the psychophysical
data at three temporal frequencies and for three subjects.
Monoptic R
C CT JK GP Monoptic RS CT JK GP Monoptic P CT JK GP
3 Hz 0.30 0.33 0.30 3 Hz 0.19 0.22 0.22 3 Hz 0 3 7
6 Hz 0.25 0.28 0.27 6 Hz 0.21 0.28 0.21 6 Hz 0 16 10
12 Hz 0.28 0.26 0.26 12 Hz 0.13 0.13 0.12 12 Hz -2 18 23
Dichoptic R
C CT JK GP Dichoptic RS CT JK GP Dichoptic P CT JK GP
3 Hz 0.38 0.46 0.45 3 Hz 0.16 0.09 0.12 3 Hz 6 33 11
6 Hz 0.41 0.49 0.46 6 Hz 0.13 0.08 0.06 6 Hz 16 0 26
12 Hz 0.42 0.46 0.43 12 Hz 0.08 0.00 0.05 12 Hz 13 - 18
Monoptic-Dichoptic R C
CT JK GP
Monoptic-Dichoptic R S
CT JK GP
Monoptic-Dichoptic P CT JK GP
3 Hz - - - 3 Hz 0.02 0.14 0.10 3 Hz - 27 4
6 Hz - - - 6 Hz 0.09 0.19 0.15 6 Hz -31 25 4
12 Hz - - - 12 Hz 0.05 0.14 0.07 12 Hz -17 22 30
Figure 6. Estimates of RC (top), RS (middle), and P (bottom) as a function of temporal frequency for three subjects at all test conditions
not shown. The RC values in the monoptic and dichoptic
data were similar for all subjects (see also Table 1).
The estimates of RS (as a quantiication of the
lateral interactions) are also displayed as a function of temporal frequency (Figure 6, middle panels). For all subjects, the RS components were larger in the monoptic than in the dichoptic conditions. In addition, the estimated subcortical RS component was generally larger or of a same magnitude as the cortical
(dichoptic) RS component. These data suggest that there is substantial subcortical contribution to the monoptic PFS modulation. In addition, the temporal frequency
seems to have different inluences on the cortical and
subcortical RS components. While the magnitude of the cortical RS components decreases from 3 to 12 Hz, the subcortical mechanisms seem to have a maximal RS
component at about 6 Hz. Further, there is considerable inter-individual variability in the RS values.
Figure 6 (bottom panels) shows the estimates of the
relative phase P for a minimal PFS displayed as a function of temporal frequency. As mentioned above, the P values were disregarded when the difference between the maximal and minimal values of the PFS equivalent contrast was less than 3 times the average of the standard deviations at all data points. Generally, the phase at minimal PFS was positive, suggesting a phase lag of the mechanisms that
respond to the surround stimulus (see Table 1).
Discussion
Our data are qualitatively similar to those of D’Antona
et al. (2011). We both ind that there are indications of cortical and subcortical lateral interaction mechanisms inluencing the perception of licker in a center ield simultaneously modulated with a surround. Furthermore, we both ind that
the cortical component is relatively stronger at low temporal frequencies In preliminary experiments, Kozyrev et al.
(2007) mentioned that they could see a lateral interaction
when the test stimulus was presented monoptically but not when presented dichoptically, suggesting the presence of only subcortical mechanisms. Our data and those of
D’Antona et al. (2011) are only partially in agreement with
these anecdotic observations.
The suggestion of a subcortical and a cortical mechanism with different temporal dependencies is in qualitative agreement with other studies that show that temporal vision is determined by two channels: one with cortical origin at low temporal frequencies and a subcortical mechanism at higher temporal
frequencies (Cass & Alais, 2006).
As mentioned in the introduction, we used a matching stimulus that was presented to one eye whereas
D’Antona et al. (2011) presented the matching stimulus
to the two eyes. This might explain why our PFS values are larger than theirs, indicating that there is inter-ocular integration of contrast in the matching stimulus.
Another difference is that D’Antona et al. (2011) ind
that the subcortical component is generally smaller than the cortical component except at 12 Hz. Furthermore,
they ind that the strength of the subcortical component
does not depend on temporal frequency, whereas the strength of the cortical component decreases
with temporal frequency. We conirm the low-pass characteristics of the cortical mechanism but ind that
the subcortical component is particularly strong at 6 Hz, suggesting a band-pass characteristic.
To study whether the monoptic or dichoptic
presentation of the matching stimulus indeed inluenced
the data, we performed a pilot study. In this pilot study, the center and surround test stimuli modulated at 6 Hz
in-phase or in counterphase. Two subjects (CT and GP)
participated. The same procedures as described above were adopted, but the matching stimuli were presented
either monocularly and binocularly. Figure 7 (top and middle panels) shows the results of these measurements.
It can be seen that abinocular matching task indeed led to a reduction of the equivalent contrast in the matching stimulus of about a factor of 2.
We further estimated RS component with the monocular and binocular matching tasks. These results
are shown in the lower panels of Figure 7. On the basis of these preliminary data, it is not possible to draw deinite
conclusions. However, the data of GP suggest that the subcortical component might indeed be relatively smaller in comparison with cortical component when the matching
stimulus is presented binocularly. More data would be necessary to show whether there is indeed an inluence of
matching stimulus presentation. Other stimulus conditions
also differ. Whereas D’Antona et al. (2011) use a surround with a 5° outer diameter and a 27 cd/m² mean luminance,
we used a 3° surround and a mean luminance of 9 cd/ m². On the basis of previous data (Kremers et al., 2004; Teixeira & Kremers, 2009) it is, however, unlikely that these difference inluence the results.
In agreement with the data of D’Antona et al. (2011),
we found that the strength of the cortical component decreases with increasing temporal frequencies.
D’Antona et al. (2011) argue that object segmentation
mechanisms may be an explanation for the cortical lateral interactions. An alternative explanation may be
brightness induction (Ejima & Takahashi, 1985), i.e. the
change of the perceived intensity of a static region by the luminance of surrounding regions. This mechanism indeed has a low pass characteristic with a temporal
cut-off frequency of about 2-5 Hz and small temporal phase lag (DeValois, Webster, DeValois, & Lingelbach, 1986; Rossi & Paradiso, 1996, 1999; Rossi, Rittenhouse, & Paradiso, 1996; Blakeslee & MacCourt, 2008). But, on the basis of our data, we ind that it is not possible to
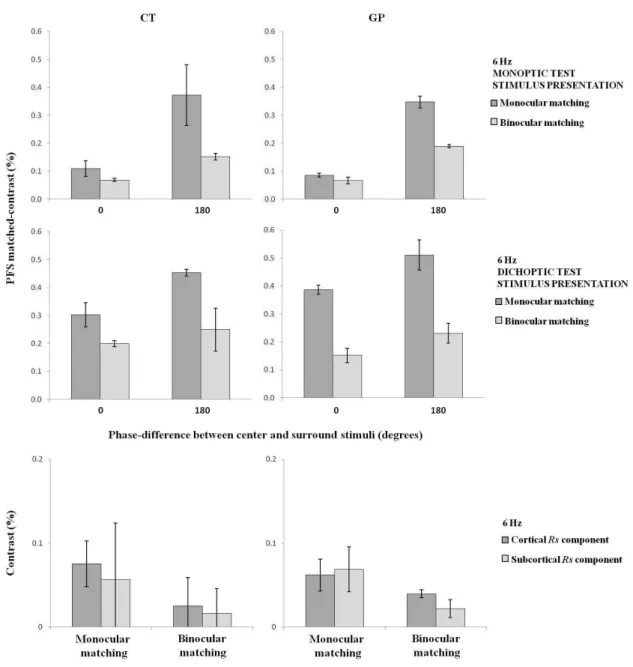
Figure 7. The PFS (mean ± SD) in the center test stimulus plotted as a function of the phase difference between center and
surround stimuli at 6 Hz for two subjects. The data are presented in monoptic (top) and dichoptic (middle) test conditions, and when the contrast in the matching stimulus was adjusted monocularly (dark bars) and binocularly (light bars). Bottom: The estimates of cortical and subcortical RS components when the contrast in the matching stimulus was adjusted monocularly (dark
bars) and binocularly (light bars) In this case, RS = (PFS180° - PFS0°) / 2, where PFS180° and PFS0° are the matched-contrasts in the matching stimulus when the center-surround test stimulus is modulated in counterphase and in-phase, respectively.
Acknowledgement
The authors would like to thank the support by German
Research Council (DFG) grant KR 1317/9-1, CAPES-DAAD PROBRAL #182/2007 grant, CAPES-BMBF BRA09/010, and CNPq #550671/2007-2. JK is Fellow in
the Excellence Program of the Hertie Foundation.
References
Blakeslee, B., & MacCourt, M.E. (2008). Nearly instantaneous brightness induction.Journal of Vision, 8(2), 1–8.
Cass, J., & Alais, D. (2006). Evidence for two interacting temporal channels in human visual processing. Vision Research, 46, 2859-2868. D’Antona, A.D., Kremers, J., & Shevell, S.K. (2008). Acortical and a sub-cortical origin of lateral interactions in perceived temporal
variation. Journal of Vision, 8 (6), abstract 358.
D’Antona, A.D., Kremers, J., & Shevell, S.K. (2011). Contextual Inluences on Perceived Temporal Variation Result from Two Separate Neural Mechanisms at Different Stages of the Visual System.Vision Research, (in submission).
DeValois, R.L., Webster, M.A., DeValois, K.K., & Lingelbach, B. (1986). Temporal properties of brightness and color induction.
Vision Research,26, 887-897.
Ejima, Y., & Takahashi, S. (1985). Apparent contrast of a sinusoidal grating in the simultaneous presence of peripheral gratings.Vision Research25, 1223-1232.
Kilavik, B.E., Silveira, L.C., & Kremers, J. (2003). Centre and surround responses of marmoset lateral geniculate neurons at different temporal frequencies. Journal of Physiology, 546(Pt 3), 903-19. Kozyrev, V., Silveira, L.C.L., & Kremers, J. (2007). Linking lateral
interactions in licker perception to lateral geniculate nucleus cell responses.Journal of Physiology, 581, 1083-1100.
lateral geniculatenucleus. Journal of Vision, 4, 643-63.
Kremers, J., & Rimmele, U. (2007). The spatial extent of lateral interactions in licker perception. Vision Research, 47(1), 16-21. Rossi, A.F., & Paradiso, M.A. (1996). Temporal limits of brightness
induction and mechanisms of brightness perception. Vision Research, 36, 1391-1398.
Rossi, A.F., Rittenhouse, C.D., & Paradiso, M.A. (1996). The representation of brightness in primary visual cortex. Science, 273,
1104-1107.
Rossi, A.F., & Paradiso M.A. (1999). Neural correlates of perceived brightness in the retina, lateral geniculate nucleus, and striate cortex. Journal of Neuroscience, 19, 6145-6156.
Teixeira, C., & Kremers, J. Cortical and subcortical origins of lateral interactions in licker perception(2009). 20th Symposium of the