Comparative neurophysiology of spatial luminance contrast
sensitivity
Givago da Silva Souza, Bruno Duarte Gomes and Luiz Carlos L. Silveira
Universidade Federal do Pará, Belém, PA, Brazil
Abstract
The luminance contrast sensitivity function has been investigated using behavioral and electrophysiological methods in many vertebrate species. Some features are conserved across species as a shape of the function, but other features, such as the contrast sensitivity peak value, spatial frequency contrast sensitivity peak, and visual acuity have changed. Here, we review contrast sensitivity across different classes of vertebrates, with an emphasis on the frequency contrast sensitivity peak and visual acuity. We also correlate the data obtained from the literature to test the power of the association between visual acuity and the spatial frequency of the contrast sensitivity function peak. Keywords: contrast sensitivity, visual acuity, object vision, animal behavior, psychophysics, visually evoked potentials.
Received 25 May 2011; received in revised form 17 June 2011; accepted 29 June 2011. Available on line 30 June 2011
Givago da Silva Souza and Luiz Carlos L. Silveira, Universidade Federal do Pará, Núcleo de Medicina Tropical and Instituto de Ciências Biológicas, Belém, Brasil. Bruno Duarte Gomes, Universidade Federal do Pará, Instituto de Ciências Biológicas, Belém, Brasil. Correspondence regarding this article should be directed to: Dr. Givago da Silva Souza, Universidade Federal do Pará, Núcleo de Medicina Tropical, Av. Generalíssimo Deodoro, no 92 (Umarizal), 66055-240 Belém, Pará, Brazil. Phone: 32016819. Fax: +5591-32410032. E-mail: [email protected]
Spatial vision and contrast sensitivity
The ecological role of vision is mainly related to object
localization and identiication in a given environment.
Vision helps animals search for food, look for sexual partners, avoid predators, and care for their offspring (Ghim & Hodos, 2006). A variety of eye optics designs, photoreceptor matrices, and post-receptoral retinal, tectal, and cortical mechanisms allows for environmental mapping and the neural representation of the visual information available to the animal. A popular hypothesis for visual system evolution relies on the selective pressure
to disclose natural camoulage to other living beings (Regan, 2000). According to Regan (2000), ive object
attributes make it especially visible against its surrounding environment: luminance, texture, movement, color, and binocular disparity. If an object and its surroundings
display the same values for these ive parameters, then the
visual system cannot distinguish one object from another, and the object is perfectly embedded in the environment.
Spatial vision encompasses both the perception of the spatial distribution of light and the perception of object
localization in the environment (De Valois & De Valois,
1980). The present review emphasizes indings regarding
the visual system processing of spatial luminance distribution at very low contrast levels. Spatial luminance contrast is the relative difference between the brightness of adjacent regions of space (Campbell & Maffei, 1974; Owsley, 2003). Spatial luminance contrast or simultaneous luminance contrast stands in the domain of space, as opposed to temporal luminance contrast or successive luminance contrast, which stands in the domain of time.
Two measurements of luminance contrast are frequently used in spatial vision: contrast threshold and contrast sensitivity. Contrast threshold is a probabilistic measurement that represents the highest
contrast for object identiication that is equal to
chance. Contrast sensitivity is the inverse of contrast threshold. Measuring both contrast threshold and contrast sensitivity is possible using both periodic and non-periodic stimuli, with the former a measurement performed in the spatial frequency domain and the latter a measurement performed in the space domain. Results obtained using spatial and spatial frequency measurements can be converted to each other using a Fourier transformation, provided the system is linear in the range of the conditions studied.
Contrast transfer functions in natural and
manmade optical systems
of the range of spatial frequencies that the visual system sees (i.e., contrast sensitivity function [CSF]; Campbell, 1983). This function allows a quick understanding of the animal’s visual system performance both under normal and dysfunctional conditions, displaying both peak contrast sensitivity (i.e., the contrast sensitivity in the range where the visual system is more sensitive) and visual acuity (i.e., the highest spatial frequency that the visual system detects at very high contrast). The CSF peak is a good indicator of the spatial frequencies that are more biologically relevant to the animal, whereas visual acuity represents the spatial resolution of the animal’s visual system and the highest spatial frequency that is able to evoke a visual response from the animal. The CSF has a bell shape and can be regarded as dividing the spatial frequency world into two halves. Below the curve are all combinations of spatial frequencies and contrast that are seen by the animal. Above the curve resides the unseen world.
The CSF is the visual psychophysics counterpart of a very well known optical measurement, the Modulation Transfer Function (MTF), which together with the Phase Transfer Function (PTF) results in the more general case, the Optical Transfer Function (OTF; Goodman, 2005). The capacity of any optical system—ranging from a simple lens to a composite optical system made from several lens elements to a very complex photonic system made from many different optical elements
combined with image recording devices, such as ilms,
photographic paper, and electronic displays—to transfer information from the object space to the image space or to an image recording device can be described by how much the system attenuates spatial contrast (i.e., modulation transfer) and how much it introduces a phase shift (i.e., phase transfer) for each spatial frequency. This is evaluated by careful measurements of the contrast and phase of a periodic object and its image, followed by quantitative comparisons between the two datasets, thus resulting in the aforementioned MTF and PTF, respectively. Sine wave objects are preferable for this type of experiment because linear optical systems only introduce contrast attenuation with no phase shift for all spatial frequencies. The OTF of an optical system can then be expressed either as the MTF plus PTF as separate real functions of a real variable or as a single complex function of a real variable, with the real variable spatial frequency in both cases. With vision, measuring spatial phase shifts is not very common (Westheimer, 1978), and the CSF that physiologically corresponds to the MTF very often remains as the single measured visual system characteristic (Röhler, 1962; Westheimer, 1963).
Another way to characterize an optical system is to measure its Point Spread Function (PSF; Goodman, 2005; Gubisch, 1967). This is performed by using punctiform objects and recording the amount of blur in the image. A similar measurement can be made using very narrow-line objects. In this case, the resulting function is called
a Line Spread Function (LSF), which can then be used to estimate the PSF (Flamant, 1955; Krauskopf, 1962; Westheimer & Campbell, 1962; Campbell & Gubisch, 1966). Both the PSF and LSF are measurements performed in the domain of space, as opposed to the spatial frequency domain where the OTF, MTF, and PTF are measured. A Fourier transformation can then be used to transform the results from one domain to the other. The Fourier theorem establishes that measurements in one domain yield results equal to measurements performed in the related domain followed by Fourier transformation to
the irst domain, provided the system is linear.
Both spatial frequency and spatial measurements have been used to study visual system contrast transfer. Because the visual system has two very different subsystems, one represented by eye optics and another represented by neural elements (e.g., retinal, subcortical, and cortical), having separate measurements for these two subsystems and measurements for the entire system is desirable. Contrast transfer through the eye optical system has been studied by recording its LSF (Flamant, 1955; Krauskopf, 1962; Westheimer & Campbell, 1962; Campbell & Gubisch, 1966) and MTF (Röhler, 1962; Westheimer, 1963). The eye optical system behaves, in many regards, similarly to manmade optical systems, and the measurement of its LSF or MTF is performed in similar ways and provides equivalent results. The results can then be interpreted using the same rationale. However, an additional practical problem exists when dealing with the eyes of living animals compared with experiments with
manmade lenses and optical systems, speciically how
to access the image formed by the eye optics. The more common way is called the double-pass method, in which
an object is irst placed in front of the eye, and its image
As stated above, the CSF is the psychophysical counterpart of the optical MTF. The CSF has frequently been used to estimate contrast transfer through the entire visual system, comprising both optical and neural subsystems. It has been measured using sine wave gratings placed on a display in front of the subject and recording a behavioral response to determine the contrast threshold for each spatial frequency (Campbell & Green, 1965a; Campbell & Robson, 1968; Robson, 1966; Schade, 1956; Patel, 1966; Van Nes & Bouman, 1967). Additionally, estimating the CSF of the neural part of the visual system is also possible by bypassing the eye optics. This is accomplished by generating a sine wave grating directly on the retina using laser interferometry (Arnulf & Dupuy, 1960; Campbell & Green, 1965a; Westheimer, 1960). The comparison of the eye optics MTF, neural CSF, and CSF of the entire visual system (i.e., optical plus neural parts) made under equivalent conditions from the same animal allows one to distinguish the contribution of each element (i.e., optical and neural) to animal vision. A series of studies by Fergus W. Campbell and colleagues reached the conclusion that the performance of neural elements limits the performance of human vision (Campbell & Green, 1965a; Campbell & Gubisch, 1966; Campbell & Robson, 1968). Experiments in other animals have generally provided similar conclusions (e.g., opossum: Cruz, Hokoç, & Sousa, 1979; Oswaldo-Cruz, Picanço-Diniz, & Silveira, 1982; Picanço-Diniz, Silveira, & Oswaldo-Cruz, 1983; Silveira, Picanço-Diniz, & Oswaldo-Cruz, 1982).
The shapes of the eye optics MTFs and visual system CSFs reveal some interesting properties. As expected, the eye optics MTF has a low-pass shape with progressive attenuation in the high spatial frequency range, reaching a cut-off frequency at approximately 60 cycles per degree (cpd; Campbell & Gubisch, 1966). The visual system CSF is band-pass, showing attenuation at high spatial frequencies, similar to the eye optics MTF, plus additional attenuation at low spatial frequencies (Campbell & Green, 1965a; Campbell & Robson, 1968). The attenuation of low spatial frequencies is attributable to visual system neural processing and considered to be related to the lateral inhibition and center-surround
organization of the receptive ields of visual system
neurons (Enroth-Cugell & Robson, 1966).
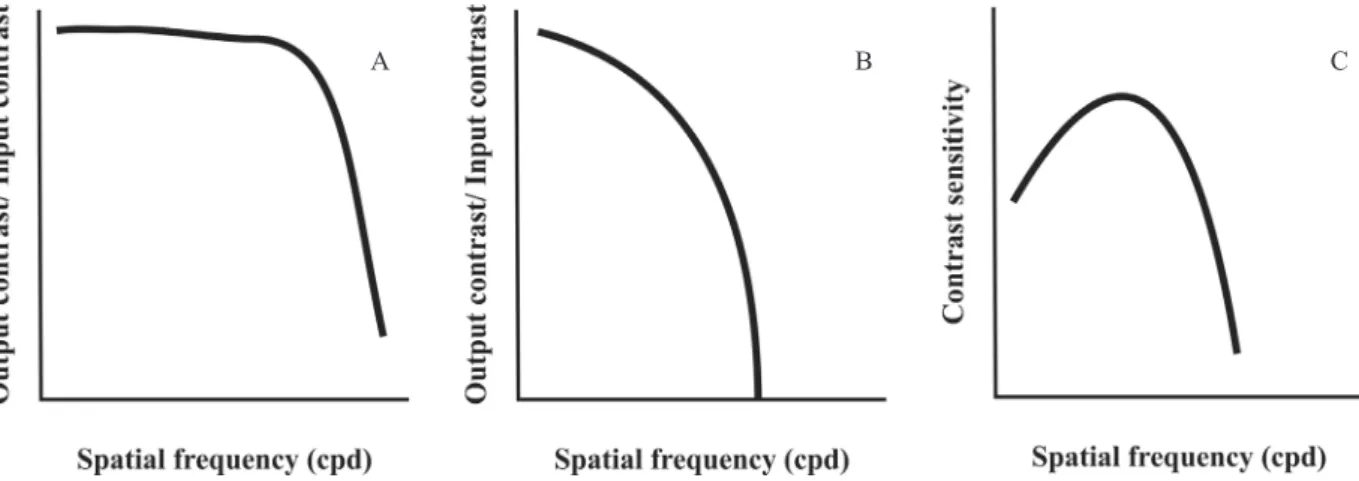
Figure 1 shows the several stages of contrast transfer from object generation on a display, such as a cathode ray tube (CRT) display (Figure 1A), modulation transfer through the eye optical elements (Figure 1B), and the end result of contrast transfer through the entire visual system measured behaviorally (Figure 1C). System analysis postulates that system performance depends on the element whose performance is more limited—in this case, the neural part of the visual system.
Vertebrate vision and environmental
adaptation
The subphylum Vertebrata (vertebrates) comprises
seven classes: Agnatha (jawless ish), Condrichthyes (cartilaginous ish), Osteichthyes (bony ish), Amphibia
Figure 1.A: The irst step in contrast vision is how it arises from the objective world. In this example, sine wave luminance
gratings were generated on the screen of a CRT monitor. This type of system is able to represent the luminance modulation of sine wave gratings across a wide range of spatial frequencies that encompass the human visible range. At high spatial frequencies, a progressive contrast loss occurs, which quickly sets the useful range for the modulation of representations on a CRT display. Different physical principles work with different display types, but generally the effect is the same: a low-pass MTF. At low spatial frequencies, the MTF is usually limited only by the display size. B: The MTF for the eye optical system taken as a single entity despite the fact that it is composed of several optical elements with different properties. The eye optics MTF is recorded at the eye fundus. It has a low-pass shape, similar to the CRT display MTF, but it transmits a shorter range of high spatial frequencies than it is possible to represent in different displays available to the experimenter.C: Contrast transfer of the entire visual system in a human subject obtained using psychophysical methods. The CSF is the result of contrast transfer through a series of elements organized in a cascade that comprise the generation of sine wave gratings on a CRT monitor, high spatial frequency attenuation by the eye optical elements, and both low and high spatial frequency contrast attenuation by neural circuits. As a consequence, the visual system CSF is band-pass.
(amphibians), Reptilia (reptiles), Aves (birds), and Mammalia (mammals). Many features of the vertebrate visual system have been optimized during evolution for appropriate performance in a given set of environmental conditions. Vertebrates occupy terrestrial (both surface and subterranean), aquatic, and aerial environments and interfaces between these compartments. This allows for the evolution of visual systems with different performance for luminance contrast information processing in the
spatial frequency domain. The spatial vision of ish,
amphibians, reptiles, birds, and mammals has been studied over the years to cover a range of different species to understand the ecological aspects of visual behavior.
Luminance spatial contrast sensitivity of
bony ish
The visual response of ish to contrast as a function
of spatial frequency has been investigated in several species, some of which are laboratory animals that have been studied for numerous reasons: bluegill
sunish (Lepomis macrochirus), zebraish (Danio rerio), medaka or Japanese killiish (Oryzias latipes),
and goldish (Carassius auratus; Bilotta & Powers, 1991; Haug, Biehlmaier, Mueller, & Neuhauss, 2010; Mueller & Neuhauss, 2010; Northmore & Dvorak, 1979; Northmore, Oh, & Celenza, 2007; Rinner, Rick, & Neuhauss, 2005; Figure 2D). Northmore and Dvorak (1979) and Bilotta and Powers (1991) used Pavlovian conditioning to suppress respiration upon the presentation of a sinusoidal grating. Both works showed
that the ish CSF had a band-pass shape for high mean
luminance and stationary stimuli. Bilotta and Powers (1991) showed that temporally modulated stimuli or stimuli with low mean luminance changed the CSF
shape from band-pass to low-pass. The ish CSF peaks
at 0.2-0.3 cpd and has a relatively high cut-off frequency that might provide behavioral visual acuity of 3.2 cpd at high photopic luminance levels (Bilotta & Powers, 1991). Northmore et al. (2007) estimated the contrast
sensitivity of ish based on preferential swimming in
response to grating stimuli. They found that the CSF had a band-pass shape, peaked at 0.3-0.4 cpd, and had a cut-off frequency of 5-7 cpd.
Rinner et al. (2005) and Haug et al. (2010) used the optokinetic nystagmus response to estimate the contrast
sensitivity of larval zebraish. These studies immobilized zebraish larvae and then stimulated the larvae with
gratings projected onto a cylindrical screen. Fish eye movements were recorded with a camera, and eye angle and velocity were evaluated in real-time. Rinner et al. (2005) found a band-pass CSF that peaked at 0.07-0.08 cpd, with visual acuity of 0.2-0.4 cpd. Haug et al.
(2010) found visual acuity of 0.16 cpd. Also using ish
optokinetic nystagmus, Mueller and Neuhauss (2010) studied eye velocity as a function of stimulus contrast
and spatial frequency in adult zebraish and medaka.
They found that eye velocity quickly changed with low to medium contrast and was saturated at medium to high contrast. Eye velocity as a function of spatial frequency was well described by a band-pass function that peaked
at 0.1-0.12 cpd, and zebraish had slightly higher visual
acuity than medaka (0.4 and 0.6 cpd, respectively).
Luminance spatial contrast sensitivity of
amphibians
Amphibians have been studied to solve a number of problems in cell biology and visual neuroscience. Some reference studies of vertebrate vision were performed in amphibians (e.g., Hartline, 1938, 1940a, b, c; Lettvin, Maturana, McCulloch, & Pitts, 1959). Despite several works on the single unit properties of neurons located at different sites along the visual pathways and many behavioral studies of amphibian vision, most of these studies have been performed in frogs. Very few studies have focused on contrast sensitivity and visual acuity in vertebrates (Aho, 1997; Manteuffel & Himstedt, 1978). No complete descriptions of the amphibian CSF have been provided. Himstead (1967) and Manteuffel and Himsted (1978) evaluated visual acuity in both aquatic and aerial environments in the smooth newt (Triturus vulgaris) by measuring optomotor responses and the single unit responses of neurons located in the optic tectum and thalamus. Aho (1997) estimated the visual acuity of frogs (Rana pipiens) using a forced-choice prey-dummy setup. Two dummies were placed
in the visual ield. Behind the dummies were gratings,
but only one of the stimuli drifted. This author found that at high luminance levels, visual acuity reached 2.8 cpd and dropped to approximately 0.7 cpd when the luminance was lowered. He also found, similar to other mammals, a good correlation between behavioral visual acuity and cut-off spatial frequency estimated from the sampling properties of the retinal ganglion cell mosaic. Monroy and Nishikawa (2011) studied the angular head movements of frogs during predatory behavior toward earthworms of different sizes. They found larger angular amplitudes for 2-3 cm prey and a smaller response for both larger-sized prey (low spatial frequencies) and especially smaller-sized prey (high spatial frequencies). This experiment, however informative, was too complex to provide a straightforward description of frog contrast sensitivity and visual acuity. The observed results are doubtless the holistic end product of all of the frog sensory and motor systems working cooperatively.
Luminance spatial contrast sensitivity of
reptiles
been limited to visual acuity measurements in some species of turtles and snakes (e.g., Pseudemys scripta elegans [freshwater turtle], Caretta caretta [loggerhead sea turtle], and Nerodia sipedon pleuralis [midland banded water snake]; Baker, Gawne, Loop, & Pullman, 2007; Bartol, Musick, & Ochs, 2002; Northmore & Granda, 1991). In turtles, experiments measured visually evoked responses recorded from the optic tectum (Northmore & Granda, 1991) and obtained non-invasive recordings directly from surface electrodes placed on the skin of the animal’s head (Bartol et al., 2002). The estimated visual acuity ranged from 4.4-9 cpd (Northmore & Granda, 1991) to 3.9-6.7 cpd (Bartol et al., 2002). Snake visual acuity was estimated to be 4.25 cpd (Baker et al., 2007).
Luminance spatial contrast sensitivity of
birds
Birds have very sophisticated vision in the spatial, temporal, and chromatic domains. Bird spatial vision has been extensively studied in several species (Blough
& Blough, 1989; Dabrowska, 1975; Fite &
Rosenield-Wessels, 1975; Fox, Lehmkuhle, & Westendorf, 1976; Gaffney & Hodos, 2003; Ghim & Hodos, 2006; Gover, Jarvis, Abeyesinghe, & Wathes, 2009; Harmening, Nikolay, Orlowski, & Wagner, 2009; Hirsch, 1982; Hodos, Miller, & Fite, 1991; Hodos, Ghim, Potocki, Fields, & Storm, 2002; Hodos, Potocki, Ghim, & Gaffney, 2003; Jarvis, Abeyesinghe, McMahon, & Wathes, 2009; Lee, Holden, & Djamgoz, 1997; Martin & Gordon, 1974; Nye, 1968; Over & Moore, 1981; Porciatti, Fontanesi, & Bagnoli, 1989; Reymond & Wolfe, 1981; Reymond, 1985, 1987; Schmid & Wildsoet, 1998; Yamamoto, Furuya, & Watanabe, 2001).
Pigeons (Columbia livia) have been widely used in operant conditioned behavior experiments, and their visual system has been the input system of choice in several such experiments mainly because of the high visual acuity of pigeons compared with other commonly studied laboratory vertebrates. Blough (1971) estimated pigeon visual acuity to be 7.5-30 cpd. Hodos et al. (1991) estimated pigeon visual acuity at different ages and found that the youngest individuals (2 years old) had mean visual acuity of 16 cpd, whereas the oldest individuals (10-20 years old) had visual acuity of 2-4 cpd. Blough (1971) and Hodos et al. (2002, 2003) investigated pigeon contrast sensitivity. Blough (1971) used a forced-choice procedure, in which the pigeon had
to decide between striped and blank ields to peck. The spatial frequency of the striped ield was increased to
estimate visual acuity, which ranged from 7.5 to 25.8 cpd. Hodos et al. (2002) used electroretinography and an operant conditioning procedure to estimate the pigeon CSF. They found band-pass functions, but the overall curve was 53% lower for all spatial frequencies when
pattern electroretinography was used. The CSF peak was located at a higher spatial frequency, and visual acuity was higher when they used behavioral methods compared with electroretinography (i.e., 0.81 vs. 0.68 cpd and 5.23 cpd vs. 3.31 cpd, respectively).
The visual system of chickens (Gallus gallus domesticus) became quite popular after the famous experiment of experimentally induced myopia in chicks that related this condition to the deprivation of spatial vision during development (Pickett-Seltner, Sivak, & Pasternak, 1988). Over and Moore (1981) found that the visual acuity of 25-day-old chicks was 1.5 cpd. Schmid and Wildsoet (1998) measured the optokinetic response and estimated the visual acuity of 2- to 8-day-old chicks as 6-8 cpd. Jarvis et al. (2009) used a forced-choice procedure, in which the avian response was to peck a correct key. They found that the CSF of adult chickens was higher (approximately 1 cpd), and visual acuity was 7 cpd. Similar results were found by Gover et al. (2009).
The spatial vision of quails (Coturnix coturnix japonica) was studied by Lee et al. (1997) using pattern electroretinography. They found that younger quails had higher contrast sensitivity than older quails, especially in the low spatial frequency range. However, visual acuity was similar in young and old quails (5-6 cpd).
The visual systems of other birds, together with commonly used laboratory birds (e.g., pigeons and
chickens), have rose scientiic interest because of their
conspicuous cleverness (e.g., crows), their notorious ability to distinguish their prey at a long distance (e.g., eagles, falcons, and hawks), and their sophisticated nocturnal vision (e.g., owls). Dabrowska (1975) estimated the visual acuity of three different species of crows (Corvus frugilegus, Garrulus glandarius, and Coloeus monedula) and found values near 30 cpd. Fite
and Rosenield-Wessels (1975) estimated the visual
acuity of a species of crow (Cyanocitta cristata) and found values that ranged from 15 to 19 cpd. Yamamoto et al. (2001) used behavioral methods and estimated the visual acuity of the Japanese jungle crow (Corvus macrorhyncos) to be 8.4 cpd.
Martin and Gordon (1974) and Fite (1973) estimated owl visual acuity of 7.5-15 cpd. Porciatti, Fontanesi, Raffaelli, & Bagnoli (1989) measured the visual acuity of a species of owl (Athene noctua) using pattern electroretinography and found it to be 6 cpd. Martin and Gordon (1974) and Harmening et al. (2009) used behavioral methods to study the contrast sensitivity of three species of owls (Tyto alba pranticola, Strix aluco, and Bubo virginianos). Harmening et al. (2009) found a contrast sensitivity peak of 1-2 cpd and visual acuity of 3-4 cpd.
Ghim and Hodos (2006) used pattern electroretinography to compare the CSF of several bird species, including falcons (Falco sparvarius), owls (Tyto alba), European starlings (Sturnus vulgaris), quails (Coturnix coturnix japonica), red-bellied woodpeckers (Melanerpes carolinus), and pigeons (Columbia livia). They found that these birds had a band-pass CSF that peaked at 3 cpd (falcon), 1-2 cpd (pigeon, starling, and owl), 0.8-1 cpd (quail), and 0.5-0.7 cpd (woodpecker).
Luminance spatial contrast sensitivity of
mammals
The measurements of mammalian contrast sensitivity are biologically and evolutionary important. The results in humans can be applied to various subjects, including medicine. Mammals represent a
largely diversiied and well studied group of vertebrates
with different visual system circuitry adapted to many circadian and ecological niches. These animals can process visual information in different ways to make spatially oriented decisions.
Marsupials are among the oldest infraclass mammalian. Their visual system can provide clues
about the visual systems of the irst mammals. The
marsupial CSF was estimated by Silveira et al. (1982) and Hemmi and Mark (1998) using visually evoked potential recordings. Hemmi and Mark (1998) also estimated visual acuity using psychophysical methods. Silveira et al. (1982) studied the vision of opossums (Didelphis marsupialis), and Hemmi and Mark (1998) studied the vision of tammar wallabies (Macropus eugenii). The mean CSF estimated by Silveira and
colleagues had a low-pass proile and visual acuity of
1.25 cpd. However, some animals studied by Silveira
and colleagues showed a signiicant attenuation of
contrast sensitivity at the lowest spatial frequencies tested (Silveira, 1980). Hemmi and Mark (1998) found a band-pass electrophysiological CSF that peaked at 0.15 cpd and visual acuity of 2.7 cpd. Tammar wallaby behavioral visual acuity ranged from 4 to 5 cpd.
Several studies measured the visual acuity of bats using behavioral methods. The visual acuity of the little brown bat (Myotis lucifugus) was 0.17 cpd, and the visual acuities of the lesser sac-winged bat (Saccopteryx leptura; Suthers, 1966), common vampire
bat (Desmodus rotundus; Manske & Schmidt, 1976), big brown bat (Eptesicus fuscus; Bell & Fenton, 1986), and northern bat (Eptesicus nilssonii; Rydell & Eklöf, 2003) were 1.43, 1.25, 1, and 1.25 cpd, respectively.
The nervous systems and especially visual systems of cats and small rodents, such as rats, mice, and hamsters, have been extensively investigated. From the 1950s to 1980s, results obtained from the cat visual system were considered easily transferred to the understanding of primate and human vision. This tenet is no longer accepted, but the large amount of data collected from the cat visual system is still very interesting from the point of view of comparative psychology, physiology, and anatomy. Small rodents, which were initially used as one of the more important models for operant behavior experiments, became progressively more used in different laboratories to study various diseases, drug effects, and the knockout of
speciic genes that govern neural function.
Sinex, Burdette, and Pearlman (1979) applied an optokinetic nystagmus method introduced by Wallman (1975) to study the spatial vision of the house mouse (Mus musculus). They investigated the motor response at very low spatial frequencies, such as 0.016 cpd. They found a CSF peak at 0.125 cpd and visual acuity of 0.5 cpd. Birch and Jacobs (1979) estimated the spatial luminance CSF of pigmented and albino rats (Rattus novergicus) using a two-forced-choice behavioral task
with a display with a homogeneous ield and another
display with a sinusoidal grating with a range of spatial frequencies and contrasts. For pigmented rats, they found a low-pass CSF peak at 0.12 cpd and visual acuity of 1.2 cpd. For albino rats, they found that the CSF retained
the low-pass proile, but contrast sensitivity was lower
compared with pigmented rats at all spatial frequencies tested, and visual acuity was less, ranging from 0.34 to 0.43 cpd. The CSFs of pigmented and albino rats showed no fall-off at spatial frequencies as low as 0.12 cpd. Several studies estimated rat behavioral visual acuity as 0.5-1 cpd (Cowey, Henken, & Perry, 1982; Dean, 1981; Lashley, 1938; Linden, Cowey, & Perry, 1983; Wiesenfeld & Branchek, 1976). Legg (1984) was
the irst to show the fall-off of the rat CSF at low spatial
frequencies. He used spatial frequencies lower than 0.12 cpd. Keller, Strasburger, Cerutti, and Sabel (2000) showed a prominent attenuation of contrast sensitivity at spatial frequencies below 0.1 cpd. They found that the CSF peak occurred at 0.1-0.2 cpd.
pigmented rat, and visual acuity was 0.48 cpd. Despite the methodological differences, a remarkable similarity was found between the results obtained by Birch and Jacobs (1979) and the results obtained by Silveira et al. (1987) and Tejada and Tedó (1998). Prusky, West, & Douglas (2000) compared the visual acuity of rats and mice and found that rats had two-fold higher visual acuity than mice.
The non-invasive visual investigation of cats (Felis domesticus) was irst conducted by Smith (1936) and later widely investigated in 1970-1980 (Berkley & Watkins, 1973; Bisti & Maffei, 1974; Blake, 1988; Blake, Cool, & Crawford, 1974; Campbell, Maffei, & Piccolino, 1973; Harris, 1978; Pasternak & Merigan, 1981).
Smith (1936) found behaviorally that cats could distinguish between horizontally and vertically oriented
luminance contrast stripes. This inding allowed
researchers, during the 1960s, to relate neural substrates
in the retina or visual cortex to psychophysical indings
in cats. Enroth-Cugell and Robson (1966) found that the visual acuity of retinal ganglion cells in cats was 5.5 cpd, whereas Campbell and colleagues (Campbell, Cooper, & Enroth-Cugell, 1969) performed the same investigation in thalamic and cortical cells and found visual acuity of 4 cpd.
Campbell et al. (1973) estimated the CSF in anaesthetized cats using visually evoked potential as the investigation method. The cat CSF peaked at 0.2 cpd, and visual acuity ranged from 15 to 20 cpd. Harris (1978) used visually evoked potentials to estimate the CSF of awake cats, which peaked at 0.4 cpd, and visual acuity was approximately 10 cpd. Bisti and Maffei (1974) and Blake et al. (1974) used behavioral methods, in which the cat had to push a pedal when it detected the gratings. Both studies found a CSF that peaked at 0.4 cpd, but visual acuity was approximately 5 cpd (Blake et al., 1974) and 10 cpd (Bisti & Maffei, 1974). Berkley and Watkins (1973) estimated visual acuity using visually evoked potentials, which ranged from 3 to 6 cpd. Pasternak and Merigan (1981) studied the effects of stimulus mean luminance on the cat CSF. The cats were trained under a two-forced-choice paradigm to discriminate vertical sinusoidal gratings
from homogeneous ields of equal mean luminance. They found that the CSF proile changed from
low-pass to band-low-pass as the mean luminance decreased. The CSFs peaked at 0.6 cpd and 0.15 cpd at high and low mean luminance, respectively. Visual acuity was approximately 4 cpd at high mean luminance and approximately 1 cpd at low mean luminance.
The spatial vision of other mammals has been investigated. Pak (1984) estimated the pigmented rabbit CSF, which peaked at 0.35 cpd, with visual acuity of 3 cpd. Vaney (1980) measured the visual acuity of wild European rabbits, which ranged from 1.6 to 2.5 cpd. The visual acuity of dogs that were subjected
to neuromuscular block was 11.6 cpd and 12.6 cpd, estimated by electroretinography and visually evoked potentials, respectively. Hanke, Scholtyseek, Hanke, and Dehnhardt (2011) studied the contrast sensitivity of harbor seals (Phoca vitulina). They found a CSF peak at 0.7 cpd and visual acuity of 2-3 cpd. Weiffen, Moller, Mauck, and Dehnhardt (2006) measured the underwater visual acuity of harbor seals at different levels of water turbidity. They found a linear loss of visual acuity as turbidity increased. Timney and Keil (1992) estimated the visual acuity of horses to be 23.3 cpd, and Rehkämper, Perrey, Werner, Opfermann-Rüngeler, and Görlach (2000) found that cattle visual acuity for vertical lines was 2.6 cpd and for horizontal lines was 1.6 cpd.
Jacobs, Blakeslee, McCourt, and Tootell (1980) estimated the CSF of ground squirrels, which peaked at 0.7-0.8 cpd, with visual acuity of 4 cpd. Jacobs, Birch, and Blakeslee (1982) compared the CSF of three different species of tree squirrels (western gray squirrel, Sciurus griseus; fox squirrel, Sciurus niger; eastern gray squirrel, Sciurus carolinensis). No difference in the CSF was found between these species. The squirrel CSF peaked at 0.5 cpd, and visual acuity was 1.8-3.8 cpd.
The study of spatial contrast sensitivity in primates
is a hot ield of spatial vision investigation. The large
amount of data obtained from primates has occurred because of their similarity to humans. Petry, Fox, and Casagrande (1984) estimated the CSF of prosimians tree shrew (Tupaia belangeri) using a forced-choice discrimination task. Two of the three specimens had a CSF peak at 0.7 cpd and visual acuity of approximately 2-2.4 cpd, whereas the third specimen had a CSF peak at 0.3 cpd and visual acuity of 1.25 cpd. Similar experiments were performed with galagos (Galago crassicaudatus; Langston, Casagrande, & Fox, 1986), southern pig-tailed macaques (Macaca nemestrina; De Valois, Morgan, & Snodderly, 1974; Merigan, Pasternak, & Zehl, 1981), crab-eating macaques (Macaca fascicularis; De Valois et al., 1974), owl monkeys (Aotus trivirgatus; Jacobs, 1977), and squirrel monkeys (Saimiri sciureus Merigan, 1976). The results obtained from Macaca and Saimiri were not different. Their CSFs peaked at 3-5 cpd, with visual acuity of 30-40 cpd (De Valois et al., 1974; Merigan, 1976). The owl monkey CSF peaked at 2-3 cpd, with visual acuity of 12-15 cpd (Jacobs, 1977). The galago CSF peaked at 0.7-0.9 cpd, with visual acuity of 3-4 cpd (Langston et al., 1986). Bonds, Casagrande, Norton, and DeBruyn (1987) also estimated the galago CSF using visually evoked potentials, and their results were slightly different from Langston et al. (1986). Bonds at al. (1987) found a CSF peak at 0.2-0.4 cpd and visual acuity of 1.6-3 cpd.
psychophysical and non-invasive electrophysiological methods (Atkinson & Campbell, 1974; Bain & Kulikowski, 1976; Blakemore & Campbell, 1969a, b; Blakemore, Carpenter, & Georgeson, 1970; Campbell & Gubisch, 1966; Campbell & Green, 1965a, b; Campbell & Gregory, 1960a, b; Campbell, Howell, & Robson, 1971; Campbell, Kulikowski, & Levinson, 1966; Campbell & Kulikowski, 1966; Campbell & Kulikowski, 1971; Campbell & Kulikowski, 1972; Campbell & Maffei, 1970; Campbell, Nachmias, & Jukes, 1970; Campbell & Robson, 1968; Campbell et al., 1969; Gubisch, 1967; King-Smith & Kulikowski,
1973a, b; King-Smith & Kulikowski, 1975; Kulikowski, 1978; Kulikowski, 1971a, b; Kulikowski, Abadi, & King-Smith, 1973; Kulikowski & Campbell, 1971; Kulikowski & King-Smith, 1973; Kulikowski & Tolhurst, 1973; Maffei & Campbell, 1970; Robson, 1966; Tolhurst, 1972a, b; Tolhurst, 1973; Tolhurst & Hart, 1972; Wood & Kulikowski, 1978). The legacy of these studies, in addition to those performed in animals using invasive and non-invasive methods, elicited a theory of visual processing by parallel channels that were responsible for detecting narrow bands of spatial frequencies that together represent the CSF. The human
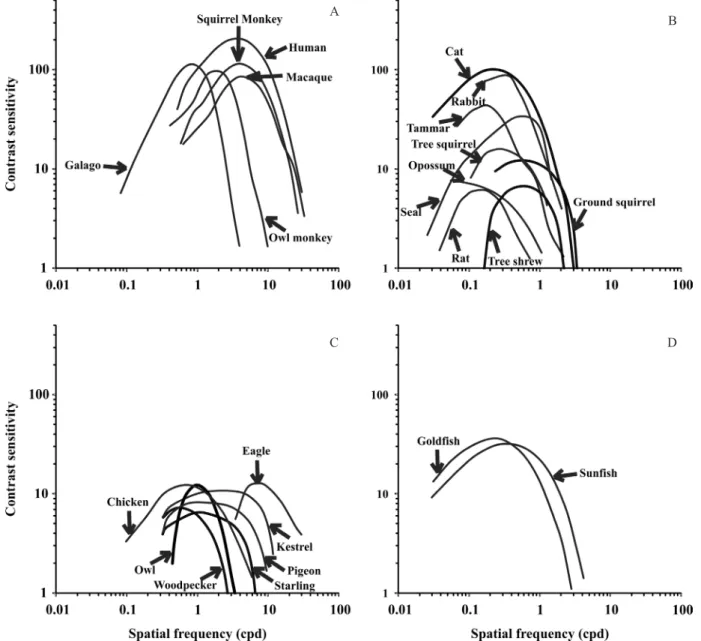
Figure 2. Comparison between contrast sensitivity functions (CSFs) obtained from several vertebrates using various behavioral and electrophysiological methods. A: Primates, including the CSFs from humans (Campbell & Robson, 1968), macaques (De Valois et al., 1974), owl monkeys (Jacobs, 1977), squirrel monkeys (Merigan, 1976), and galagos (Langston et al., 1986). B:
Other mammals, including the CSFs from cats (Blake et al., 1974), ground squirrels (Jacobs et al., 1980), opossums (Silveira et al., 1982), tree squirrels (Jacobs et al., 1982), rabbits (Pak, 1984), tree shrews (Petry et al., 1984), tammar wallabies (Hemmi & Mark, 1998), rats (Keller et al., 2000), and seals (Hanke et al., 2011). C: Birds, including the CSFs from eagles (Reymond & Wolfe, 1981), woodpeckers (Ghim & Hodos, 2006), starlings (Ghim & Hodos, 2006), kestrels (Ghim & Hodos, 2006), pigeons (Ghim & Hodos, 2006), owls (Harmening et al., 2009), and chickens (Jarvis et al., 2009). D: Fish, including the CSFs from
goldish (Northmore & Dvorak, 1979) and sunish (Northmore et al., 2007).
A
B
CSF in photopic conditions peaks at 2-6 cpd and falls off at low and high spatial frequencies. Visual acuity can reach 60 cpd using foveal vision.
Fundamental theory of the spatial luminance
contrast sensitivity function
Some features of spatial CSFs are shared by all species. The CSFs described above show a spatial frequency range with high contrast sensitivity that decreases at lower
and higher spatial frequencies. This band-pass proile of
the function can be altered by other parameters, such as mean luminance and temporal frequency. Non-linear
mechanisms involved in the receptive ield at different
levels of the visual system should be present in different species to generate similar CSF patterns.
Other features of the CSF are very different among species. They widely depend on the morphophysiological organization of the different visual systems. Some characteristics, such as eye optics, the photoreceptor mosaic, the density of retinal neurons, post-receptoral mechanisms, and the number of neurons at different stages of visual processing, have been selected in each species that together contribute to the generation of different contrast sensitivity peaks, spatial frequency peaks, and visual acuity (Hughes, 1977; Jacobs et al., 1982).
Figure 2 shows the CSFs of several species. We can observe the similar shapes and different positions of the contrast sensitivity and spatial frequency coordinates.
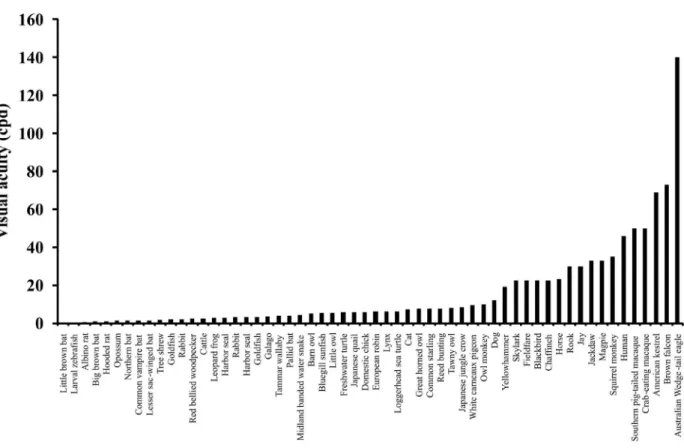
Figure 3 shows a crescent order of visual acuity in different species. The data presented in Figure 3 show the average of several studies for each species under similar experimental conditions. The species with the highest visual acuity are bird raptors and primates. Both groups are diurnal, and they have very large eyes. Higher visual acuity can be supported in large eyes by spreading the image over a large
number of receptors (Fite & Rosenield-Welles, 1975;
Hughes, 1977; Reymond, 1985; Ross, 2000; Schultz, 1940; Troilo, Howland, & Judge, 1993). In large eyes, the contrast of the image decreases, but this impairment is compensated for by the amount of light that enters the eyes of diurnal animals. Both groups also have high foveal neuronal densities (Andrade da Costa & Hokoç, 2000; Curcio, Sloan, Kalina, & Hendrikson, 1990; DeBruyn,
Wise, & Casagrande, 1980; Fite & Rosenield-Welles,
1975; Reymond, 1985; Troilo et al., 1993; Wikler, & Rakic, 1990; Yamada, Marshak, Silveira, & Casagrande, 1998; Yamada, Silveira, Perry, & Franco, 2001). This high visual acuity has been associated with the ability to locate prey or predators from long distances (Tisdale & Fernández-Juricic, 2009). Most primates have other adaptations, such as the absence of tapeta lucida, no vessels in the central
retina, and short-wavelength ilters that support high
visual acuity (Dartnall et al., 1965; Martin, 1990). The specialization of the primate visual nervous system to
detect small details is very signiicant. Even in nocturnal
Common name
Binomial nomenclature
Method Peak
Value (*)
Visual acuity (cpd)
Reference
Osteichthyes
Goldish Carassius auratus PsyPhy 40 (0.3) 2 Northmore & Dvorak, 1979
Goldish Carassius auratus PsyPhy 100 (0.2) 3.2 Billota & Powers, 1991
- Asprotilapia leptura
OKR - 2.6 Dobberfuhl,
Ullmann, & Shumway (2005)
- Xenotilapia
spilotera
OKR - 0.59 Dobberfuhl et al.
(2005)
- Xenotilapia
lavipinnis OKR - 0.59 Dobberfuhl et al. (2005)
Zebraish (larval) Danio rerio OKR (0.08) 0.3 Rinner et al., 2005
Table 1. Contrast sensitivity and visual acuity of different species studied by psychophysics, electrophysiology, and optokinetic responses. 10 cpd (Jacobs, 1977). Compared with other primates,
owl monkeys have poor vision, but compared with other large-eye mammals, Aotus has better visual acuity or visual acuity that is as good as horses, cats, and even some diurnal birds. Another primate example of nervous system specialization is Callithrix jacchus. Even with small eyes, it has an estimated visual acuity of 30 cpd, which is higher than other mammals with larger eyes (Troilo et al., 1993). The visual acuity of Callithrix has not been estimated using behavioral methods, but rather from the microanatomy of the retina, which is similar to other primates and matches the behavioral results (Curcio et al., 1990; Andrade da Costa & Hokoç, 2000; Yamada et al., 2001).
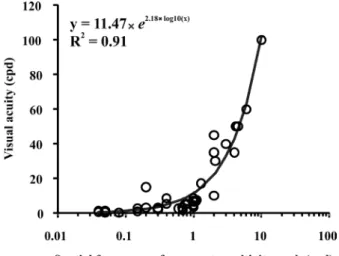
Natural selection acts in the visual system to not only increase visual acuity. Visual acuity is only the maximum spatial frequency of detection at high contrast (i.e., the last point of CSF). Visual acuity likely co-evolves with other factors that are more important to the survival of the species. Many studies have associated visual acuity with other visual features that emphasize how other features converge to increase visual acuity (Kay & Kirk, 2000; Kiltie, 2000; Kirk & Kay, 2004). Other spatial frequencies could be ecologically more important than visual acuity in the recognition of other
individuals from the same species or group or in inding
prey or food in a low-contrast environment. The main spatial frequency range to be naturally selected would reasonably be the spatial frequency range of the CSF peak, and all other optical and neural changes may be associated with that selection. We tested the relationship between the spatial frequency of the CSF peak and visual acuity (Figure 4). We found a good correlation (R2 = .91) using an exponential model, suggesting that both parameters may co-evolve. Small changes in the spatial frequency of the CSF peak are related to small changes
in visual acuity until a range of 1-2 cpd for the spatial frequency of the CSF peak. After 1-2 cpd, the rate of change of visual acuity increases for each change in the spatial frequency of the CSF peak. Our analysis suggests that after the establishment of neural circuitry selected to be tuned for a spatial frequency, its high spatial frequency cut-off would also be automatically selected. The reason why the rate of change of visual acuity increases after a CSF peak at 1-2 cpd is still unclear. Other comparisons between the spatial frequency of the CSF peak and other optical and neural factors could be made to support our hypothesis.
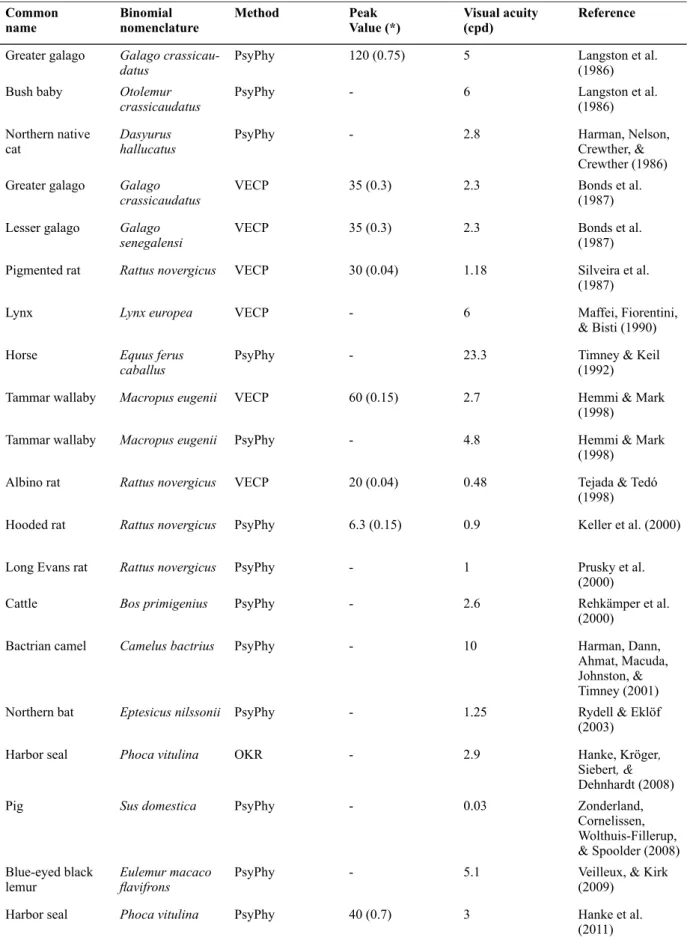
Table 1 summarizes the data from the literature regarding the spatial frequency of the CSF peak, contrast sensitivity value at the CSF peak, and visual acuity. This table may be useful for the study of vertebrate contrast sensitivity.
Table 1.Continue
Bluegill sunish Lepomis macrochirus
PsyPhy 40 (0.4) 5.25 Northmore et al.,
2007
Zebraish (larval) Danio rerio OKR - 0.16 Haug et al., 2010
Amphibia
Leopard frog Rana pipiens PsyPhy - 2.8 Aho (1996)
Reptilia
Freshwater turtle Pseudemys script elegans
VECP - 5.6 Northmore &
Granda (1991)
Loggerhead sea turtle
Caretta caretta VECP - 6.1 Bartol et al. (2002)
Midland banded water snake
Nerodia sipedon pleuralis
VECP - 4.25 Baker et al. (2007)
Aves
Chick Gallus gallus domesticus
PsyPhy - 14 Johnson (1914)
Pigeon Columbia livia PsyPhy - 14 Hamilton &
Goldstein (1933)
Blackbird Turdus merula PsyPhy - 22.5 Donner (1951)
Chafinch Fringilla coelebs PsyPhy - 22.5 Donner (1951)
European robin Erithacus rubeculus
PsyPhy - 6 Donner (1951)
Fieldfare Turdus pilaris PsyPhy - 22.5 Donner (1951)
Reed bunting Emberiza schoeniclus
PsyPhy - 7.8 Donner (1951)
Skylark Aulada arvensis PsyPhy - 22.5 Donner (1951)
Yellowhammer Emberiza citrinella
PsyPhy - 19.1 Donner (1951)
Pigeon Columbia livia PsyPhy - 13 Blough (1971)
Great horned owl Bubo virginianus PsyPhy - 7.5 Fite (1973)
Tawny owl Strix aluco PsyPhy - 8 Martin & Gordon
(1974)
Jackdaw Coloeus monedula - - 33 Dabrowska (1975)
Jay Garrulus glandarius
- - 30 Dabrowska (1975)
Common name
Binomial nomenclature
Method Peak
Value (*)
Visual acuity (cpd)
Magpie Pica pica - - 33 Dabrowska (1975)
Rook Corvus frugileus - - 30 Dabrowska (1975)
Australian wedge-tailed eagle
Aquila audax PsyPhy 16 (10) 100 Reymond & Wolfe (1981)
Domestic chick Gallus gallus domesticus
PsyPhy - 1.5 Over & Moore
(1981)
American kestrel Falco sparverius PsyPhy - 40 Hirsch (1982)
Wedge-tailed eagle
Aquila audax PsyPhy - 140 Reymond (1985)
American kestrel Falco sparverius PsyPhy - 160 Fox et al. (1976)
Brown falcon Falco berigora PsyPhy - 73 Reymond (1987)
Little owl Athene noctua ERG - 5 Porciatti et al.
(1989)
Little owl Athene noctua VECP - 6 Porciatti et al.
(1990)
White Carneaux pigeon
Columbia livia PsyPhy - 16 Hodos et al.
(1991)
Japanese quail Coturnix coturnix japonica
PsyPhy - 6.8 Hodos et al.
(1991)
Pigeon Columbia livia ERG - 18 Porciatti,Hodos,
Signorini, & Bramanti(1991)
Japanese quail Coturnix coturnix japonica
ERG 7 (1) 4.5 Lee et al. (1997)
White leghorn new domestic chick
Gallus gallus domesticus
OKR 10 (1) 8.6 Schmid, &
Wildsoet (1998)
Japanese jungle crow
Corvus macrorhyncos
PsyPhy - 8.4 Yamamoto et al.
(2001)
White Carneaux pigeon
Columbia livia ERG 4.6 (0.68) 3.31 Hodos et al. (2002)
White Carneaux pigeon
Columbia livia PsyPhy 9.9 (0.81) 5.23 Hodos et al. (2002)
American kestrel Falco sparverius ERG - 46 Gaffney & Hodos
(2003)
American kestrel Falco sparvarius ERG 10.7 (2.09) 30.1 Ghim & Hodos (2006)
Barn owl Tyto alba ERG 6 (1.08) 6.98 Ghim & Hodos
(2006)
Common starling Sturnus vulgaris ERG 6.2 (1.11) 7.56 Ghim & Hodos (2006)
Table 1.Continue
Common name
Binomial nomenclature
Method Peak
Value (*)
Visual acuity (cpd)
Japanese quail Coturnix coturnix japonica
ERG 9.8 (1.03) 6.38 Ghim & Hodos
(2006)
Red-bellied Woodpecker
Melanerpes carolinus
ERG 6.7 (0.81) 2.29 Ghim & Hodos
(2006)
White Carneaux Pigeon
Columbia livia ERG 8 (1.29) 17.17 Ghim & Hodos (2006)
Barn owl Tyto alba pranticola
PsyPhy 12 (1) 3.43 Harmening et al.
(2009)
Domestic chick Gallus gallus domesticus
PsyPhy - 6.5 Gover et al. (2009)
Domestic chick Gallus gallus domesticus
PsyPhy 10 (1) 7 Jarvis et al. (2009)
Mammalia
Capuchin monkey Cebus monkey PsyPhy - 63 Johnson (1914)
Pigmented rat Ratus novergicus PsyPhy - 1.7 Lashley (1930)
Albino rat Rattus novergicus PsyPhy - 0.57 Lashley (1930)
Chimpanzee Pan trogloditys PsyPhy - 65 Spence (1934)
Rhesus monkey Macaca mulatta PsyPhy - 67 Weinstein &
Grether (1940)
Human Homo sapiens PsyPhy 200 (6) 60 Campbell, &
Green (1965a)
Human Homo sapiens PsyPhy 200 (3) 40 Robson (1966)
Lesser sac-winged Bat
Saccopteryx leptura
PsyPhy - 1.43 Suthers (1966)
Little brown bat Myotis lucifugus PsyPhy - 0.17 Suthers (1966)
Stumptail macaque
Macaca arctoides PsyPhy - 42.8 Yarczower,
Wolbarsht, Galloway, Fligsten, & Malcolm (1966)
Rhesus macaque Macaca mulatta PsyPhy - 53 Cowey & Ellis
(1967)
Rabbit Oryctolagus cuniculus
PsyPhy - 6 Van Hof (1967)
Deermice Peromyscus californicus
PsyPhy - 1.57 Rahmann,
Rahman, & King (1968)
Deermice Peromyscus maniculatus gracilis
PsyPhy - 1.5 Rahmann et al.
(1968)
Table 1. Continue
Common name
Binomial
nomenclature Method
Peak Value (*)
Visual acuity
Deermice Peromyscus maniculatus bairdii
PsyPhy - 1.25 Rahmann et al.
(1968)
Deermice Peromyscus polionotus
PsyPhy - 0.5 Rahmann et al.
(1968)
Deermice Peromyscus
loridanus PsyPhy - 0.9 Rahmann et al. (1968)
Human Homo sapiens PsyPhy 550 (2) 45 Campbell &
Robson (1968)
Human Homo sapiens VECP 250 (2) 35 Campbell &
Maffei (1970)
Harbor seal Phoca vitulina PsyPhy - 3.6 Schusterman &
Balliet (1970a)
Stellar sea lion Eumetopias jubata PsyPhy - 4.2 (underwater) Schusterman & Balliet (1970a)
California sea lion Zalophus californicus
PsyPhy - 5.7 Schusterman &
Balliet (1970b)
Asian clawless otter
Amblionyx cinerea PsyPhy - 2.2 Balliet & Schusterman (1971)
Paciic white-sided
dolphin
Lagenorrhyncus obliquidens
PsyPhy - 5 Spong & White
(1971)
Killer whale Orcinus orca PsyPhy - 11 White, Cameron,
Spong, & Bradford (1971)
Cat Felis catus VECP - 4.5 Berkley &
Watkins (1973)
Cat Felis catus VECP 120 (0.2) 15 Campbell et al.
(1973)
Bottlenose dolphin Tursiops truncates PsyPhy - 3.3 Pepper & Simmons (1973)
Cat Felis catus PsyPhy - 6 Blake et al. (1974)
Crab-eating
macaque
Macaca fascicularis
PsyPhy 100 (4.2) 50 De Valois et al.
(1974)
Human Homo sapiens PsyPhy 200 (4.5) 50 De Valois et al.
(1974)
Mink Mustela vison PsyPhy - 4 (air)
1.93 (underwater)
Sinclair, Dunstone, & Poole (1974)
Bottlenose dolphin Tursiops truncatus PsyPhy - 2.5 (air) 3.8 (water)
Herman, Peacock, Yunker, & Madsen (1975)
Cat Felis catus PsyPhy - 9 Jacobson,
Franklin, & McDonald (1976)
Common vampire bat
Desmodus rotundus
PsyPhy - 1.25 Manske &
Schmidt (1976)
Table 1.Continue
Common name
Binomial nomenclature
Method Peak
Value (*)
Visual acuity (cpd)
Squirrel monkey Saimiri sciureus PsyPhy 150 (4) 35 Merigan (1976)
Pigmented rat Rattus novergicus PsyPhy - 0.5 Wiesenfeld, & Branchek (1976)
Owl monkey Aotus trivirgatus PsyPhy 90 (2) 10 Jacobs (1977)
Cat Felis catus VECP 120 (0.4) 8.5 Harris (1978)
Albino rat Rattus novergicus PsyPhy 11 (0.05) 0.4 Birch & Jacobs (1979)
Pigmented rat Rattus novergicus PsyPhy 25 (0.05) 1.2 Birch & Jacobs (1979)
House mouse Mus musculus OKR 0.91 (0.125) 0.5 Sinex et al. (1979)
Golden hamster Mesocricetus auratus
PsyPhy - 0.35 Emerson (1980)
California ground squirrel
Speromphilus beecheyi
PsyPhy - (0.7) 4 cpd Jacobs et al.
(1980)
Rabbit Oryctolagus cuniculus
PsyPhy - 2 Vaney (1980)
Ring-tailed lemur Lemur catta PsyPhy - 7 cpd Neuringer,
Kosobud, & Cochrane (1981)
Cat Felis catus PsyPhy 60 (0.6) 2.6 Pasternak & Merigan (1981)
Tree squirrel Sciurus griseus Sciurus niger Sciurus carolensis
PsyPhy 30 (0.5) 3.8 Jacobs et al.
(1982)
Opossum Didelphis marsupialis
VECP 8 (0.05) 1.25 Silveira et al.
(1982)
Meerkat Suricata suricata PsyPhy - 6.3 Moran, Timney,
Sorensen, & Desrochers (1983)
Dog Canis lupus familiaris
VECP - 12.59 Odom, Bromberg,
& Dawson (1983)
Dog Canis lupus familiaris
ERG - 11.61 Odom et al. (1983)
Rabbit Oryctolagus cuniculus
VECP 100 (0.3) 3 Pak (1984)
Tree shrew Tupaia belangeri PsyPhy 9 (0.7) 1.8 Petry et al. (1984)
Human Homo sapiens PsyPhy 250 (2) 35 Mullen (1985)
Big brown bat Eptesicus fuscus PsyPhy - 1 Bell, & Fenton
(1986)
Pallid bat Antrozous pallidus PsyPhy - 4 Bell, & Fenton
(1986)
Table 1.Continue
Common name
Binomial nomenclature
Method Peak
Value (*)
Visual acuity (cpd)
Greater galago Galago crassicau-datus
PsyPhy 120 (0.75) 5 Langston et al.
(1986)
Bush baby Otolemur crassicaudatus
PsyPhy - 6 Langston et al.
(1986)
Northern native cat
Dasyurus hallucatus
PsyPhy - 2.8 Harman, Nelson,
Crewther, & Crewther (1986)
Greater galago Galago crassicaudatus
VECP 35 (0.3) 2.3 Bonds et al.
(1987)
Lesser galago Galago senegalensi
VECP 35 (0.3) 2.3 Bonds et al.
(1987)
Pigmented rat Rattus novergicus VECP 30 (0.04) 1.18 Silveira et al. (1987)
Lynx Lynx europea VECP - 6 Maffei, Fiorentini,
& Bisti (1990)
Horse Equus ferus caballus
PsyPhy - 23.3 Timney & Keil
(1992)
Tammar wallaby Macropus eugenii VECP 60 (0.15) 2.7 Hemmi & Mark (1998)
Tammar wallaby Macropus eugenii PsyPhy - 4.8 Hemmi & Mark
(1998)
Albino rat Rattus novergicus VECP 20 (0.04) 0.48 Tejada & Tedó (1998)
Hooded rat Rattus novergicus PsyPhy 6.3 (0.15) 0.9 Keller et al. (2000)
Long Evans rat Rattus novergicus PsyPhy - 1 Prusky et al.
(2000)
Cattle Bos primigenius PsyPhy - 2.6 Rehkämper et al.
(2000)
Bactrian camel Camelus bactrius PsyPhy - 10 Harman, Dann,
Ahmat, Macuda, Johnston, & Timney (2001)
Northern bat Eptesicus nilssonii PsyPhy - 1.25 Rydell & Eklöf (2003)
Harbor seal Phoca vitulina OKR - 2.9 Hanke, Kröger,
Siebert, &
Dehnhardt (2008)
Pig Sus domestica PsyPhy - 0.03 Zonderland,
Cornelissen, Wolthuis-Fillerup, & Spoolder (2008)
Blue-eyed black lemur
Eulemur macaco
lavifrons PsyPhy - 5.1 Veilleux, & Kirk (2009)
Harbor seal Phoca vitulina PsyPhy 40 (0.7) 3 Hanke et al.
(2011)
Note: * Contrast sensitivity peak value at the spatial frequency indicated between brackets in cycles per degree. PsyPhy, data obtained using psychophysics. OKR , data obtained by recording of the optokinetic motor response. VECP, data obtained by recording the visually evoked cortical potential pattern. ERG, data obtained by recording the pattern electroretinogram.
Table 1.Continue
Common name
Binomial nomenclature
Method Peak
Value (*)
Visual acuity (cpd)
Acknowledgements
The authors dedicate this work to Eduardo Oswaldo Cruz, physician, physiologist, and visual neuroscientist, who was awarded the 2009 Brazilian Neuroscience Medal. Supported by: FINEP IBN Net; CNPq-PRONEX/FAPESPA #2268 and #316799/2009; CNPq #476744/2009-1, #620037/2008-3, and #475860/2010-1; and CAPES-PROCAD #182/2007. LCLS is a CNPq research fellow. LCLS would like to thank Eduardo
Oswaldo Cruz, who guided him through the irst steps of his scientiic career and taught him all that matters
about Physiological Optics and Visual Neuroscience.
References
Aho, A.C. (1997). The visual acuity of the frog (Rana pipiens).
Journal of Comparative Physiology A, 180, 19-24.
Andrade da Costa, B.L.S, & Hokoç, J.N. (2000). Photoreceptor topography of the retina in the New World Monkey Cebus apella.
Vision Research, 40, 2395-2409.
Arnulf, A., & Dupuy, O. (1960). La transmission des contrastes par le systeme optique de l’oeil et les seuils des contrastes retiniens. Comptes Rendue de L’Academie des Sciences Paris, 250, 2757-2759. Atkinson, J., & Campbell, F.W. (1974). The effect of phase on the
perception of compound gratings. Vision Research, 14, 159-162. Bain, R., & Kulikowski, J.J. (1976). Contrast thresholds for pattern
and movement detection evaluated by evoked potentials. Journal of Physiology (London), 259, 34P-35P.
Baker, R.A., Gawne, T.J., Loop, M.S., & Pullman, S. (2007). Visual acuity of the midland banded water snake estimated from evoked telencephalic potentials. Journal of Comparative Physiology A: Neuroethology, Sensory, Neural, and Behavioral Physiology, 193, 865-870.
Balliet, R.F., & Schusterman, R.J. (1971). Underwater and aerial visual acuity in the Asian “clawless” otter (Amblionyx cineria cineria). Nature, 234, 305-306.
Bartol, S.M., Musick, J.A., & Ochs, A.L. (2002). Visual acuity thresholds of juvenile loggerhead sea turtles (Caretta caretta): an electrophysiolocal approach. Journal of Comparative Physiology A: Neuroethology, Sensory, Neural, and Behavioral Physiology,
187, 953-960.
Bell, G.P., & Fenton, M.B. (1986). Visual acuity, sensitivity and binocularity in a gleaning insectivorous bat, Macrotus californicus
(Chiroptera: Phyllostomidae). Animal Behaviour, 34, 409-414. Berkley, M.A., & Watkins, D.W. (1973). Grating resolution and
refraction in the cat estimated from evoked cerebral potentials.
Vision Research, 13, 403-415.
Bilotta, J., & Powers, M.K. (1991). Spatial contrast sensitivity
of goldish: mean luminance, temporal frequency and a new
psychophysical technique. Vision Research, 31, 577-585. Birch, D., & Jacobs, G.H. (1979). Spatial contrast sensitivity in albino
and pigmented rats. Vision Research, 19, 933-937.
Bisti, S., & Maffei, L. (1974). Behavioural contrast sensitivity of the cat in various visual medians. Journal of Physiology (London),
241, 201-210.
Blake, R. (1988). Cat spatial vision. Trends in Neurosciences, 11, 78-83. Blake, R., Cool, S.J., & Crawford, M.L.J. (1974). Visual resolution in
the cat. Vision Research, 14, 1211-1217.
Blakemore, C., & Campbell, F.W. (1969a). Adaptation to spatial stimuli. Journal of Physiology (London), 200, 11P-13P.
Blakemore, C., & Campbell, F.W. (1969b). On the existence of neurones in the human visual system selectively sensitive to the orientation and size of retinal images. Journal of Physiology (London), 203, 237-260.
Blakemore, C., Carpenter, R.H., & Georgeson, M.A. (1970). Lateral inhibition between orientation detectors in the human visual system. Nature, 228, 37-39.
Blough, P.M. (1971). The visual acuity of the pigeon for distant targets.
Journal of the Experimental Analysis of Behavior, 15, 57-67.
Blough, P.M., & Blough, D.S. (1989). Visual effects of opiates in pigeons: II. Contrast sensitivity to sinewave gratings.
Psychopharmacology, 97, 85-88.
Bonds, A.B., Casagrande, V.A., Norton, T.T., & DeBruyn, E.J. (1987). Visual resolution and sensitivity in a nocturnal primate (Galago) measured with visual evoked potentials. Vision Research, 27, 845-857. Campbell, F.W. (1983). Why do we measure contrast sensitivity?
Behavioural Brain Research, 10, 87-97.
Campbell, F.W., Cooper, G.F., & Enroth-Cugell, C. (1969). The spatial selectivity of the visual cells of the cat. Journal of Physiology (London), 203, 223-235.
Campbell, F.W., & Maffei, L. (1970). Electrophysiological evidence for the existence of orientation and size detectors in the human visual system. Journal of Physiology (London), 207, 635-652. Campbell, F.W., & Green, D.G. (1965a). Optical and retinal factors
affecting visual resolution. Journal of Physiology (London), 181, 576-593.
Campbell, F.W., & Green, D.G. (1965b). Monocular versus binocular visual acuity. Nature, 208, 191-192.
Campbell, F.W., & Gregory, A.H. (1960a). Effect of size of pupil on visual acuity. Nature, 187, 1121-1123.
Campbell, F.W., & Gregory, A.H. (1960b). The spatial resolving power of the human retina with oblique incidence. Journal of the Optical Society of America, 50, 831.
Campbell, F.W., & Gubish, R.W. (1966). Optical quality of human eye. Journal of Physiology (London), 186, 558-578.
Campbell, F.W., Howell, E.R., & Robson, J.G. (1971). The appearance of gratings with and without the fundamental Fourier component.
Journal of Physiology (London), 217, 17P-18P.
Campbell, F.W., & Kulikowski, J.J. (1966). Orientational selectivity of the human visual system. Journal of Physiology (London), 187, 437-445.
Campbell, F.W., Kulikowski, J.J., & Levinson, J. (1966). The effect of orientation on the visual resolution of gratings. Journal of Physiology (London), 187, 427-436.
Campbell, F.W., & Kulikowski, J.J. (1971). Electrophysiological measure of the psychophysical contrast threshold. Journal of Physiology (London), 217, 54P-55P.
Campbell, F.W., & Kulikowski, J.J. (1972). Visual evoked potential as a function of contrast of a grating pattern. Journal of Physiology (London), 222, 345-356.
Campbell, F.W., & Maffei, L. (1974). Contrast and spatial frequency.
Scientiic American, 231, 106-114.
Campbell, F.W., Maffei, L., & Piccolino, M. (1973). The contrast sensitivity of the cat. Journal of Physiology (London), 229, 719-731. Campbell, F.W., Nachmias, J., & Jukes, J. (1970). Spatial-frequency
discrimination in human vision. Journal of the Optical Society of America, 60, 555-559.
Campbell, F.W., & Robson, J.G. (1968). Application of Fourier analysis to the visibility of gratings. Journal of Physiology (London), 197, 551-566.
Cowey, A., & Ellis, C.M. (1967). Visual acuity of rhesus and squirrel monkeys. Journal of Comparative and Physhiological Psychology,
64, 80-84.
Cowey, A., Henken, D.B., & Perry, V.H. (1982). Effects on visual acuity of neonatal or adult tectal ablation in rats. Experimental Brain Research, 48, 149-152.
Curcio, C.A., Sloan, K.R., Kalina, R.E., & Hendrikson, A.E. (1990). Human photoreceptor topography. Journal of Comparative Neurology, 292, 497-523.
Dabrowska, B. (1975). Investigations on visual acuity of some corvine species. Folia Biologica, 23, 311-332.
Dartnall, H.J.A., Arden, G.B., Ikeda, H., Luck, C.P., Rosenberg, M.E., Pedler, C.M.H., & Tansley (1965). Anatomical, electrophysiological and pigmentary aspects of vision in the bush baby: an interpretative study. Vision Research, 5, 399-424.
Dean, P. (1981). Visual pathways and acuity in hooded rats.
Behavioural Brain Research, 3, 239-271.
DeBruyn, E.J., Wise, V.L., & Casagrande, V.A. (1980). The size and topographic arrangement of retinal ganglion cells in the galago.
Vision Research, 20, 315-327.
De Valois, R.L., & De Valois, K.K. (1980). Spatial vision. Annual Review of Psychology, 31, 309-341.