Contrast sensitivity and retinal ganglion cell responses in the
primate
Barry B. Lee
1,2and Hao Sun
11 - State University of New York, NY, USA
2 - Max-Planck Institute for Biophysical Chemistry, Göttingen, NI, Germany
Abstract
Human contrast sensitivity is considered in relation to the responses delivered by retinal ganglion cells of the primate to luminance and chromatic contrast. At different temporal frequencies, response amplitude relative to response variability determines the limit to sensitivity of a single ganglion cell. This can be related to speciic models of central detection mechanisms. Both for luminance and chromatic contrast, psychophysical sensitivity to temporal modulation can be achieved by summation of activity of just a few cells that provide input to a detection mechanism. This analysis is then extended to a spatial context. Several sets of data indicate that, in spatial terms, detection mechanisms are of limited spatial extent, and that, at least in the case of luminance patterns, eye movements play a critical role in contrast detection. Keywords: contrast sensitivity, primate, retinal ganglion cells, eye movements, contrast detection
Received 25 November 2010; received in revised form 4 March 2011; accepted 5 March 2011. Available on line 15 june 2011
Barry B. Lee, State University of New York, college of Optometry. Hao Sun, Max-Planck Institute for Biophysical Chemistry, Göttingen, Germany. Address for correspondence: Dr. Barry B. Lee, Graduate Center for Vision Research, SUNY Optometry, 33 W. 42nd. St., New York, NY 10036, USA Phone: 212-938-5773; FAX 212-938-5796; E-mail [email protected]
Introduction
Psychophysical contrast sensitivity is ultimately limited by the responsivity of retinal ganglion cells relative to the noise in their signals, i.e., the variability inherent in maintained activity and responses. Central mechanisms may later improve psychophysical sensitivity by summing over cells, at the cost of a loss of spatial precision. By comparing physiological sensitivity of single ganglion cells and psychophysical sensitivity, we hope to specify the amount of summation that might occur. On the other hand, central mechanisms may not make optimal use of incoming signals from the retina, effectively discarding information; an example of this is given in the following sections. By comparing ganglion cell signals with
psychophysical contrast sensitivity, we aim to deine the
way cortical mechanisms process ganglion cell responses. The retino-cortical pathway of primates can be segregated into three main cell systems: a magnocellular (MC) pathway that originates in parasol ganglion cells and receives additive inputs from middle- (M) and long-wavelength (L) cones; a parvocellular pathway that originates in midget ganglion cells and receives opponent L and M cone input; and a koniocellular pathway that originates in the ganglion cells that receive S-cone
input, and passes through the koniocellular layers of the lateral geniculate nucleus. The MC pathway is largely responsible for detection of luminance contrast, while PC and KC pathways are responsible for detection of chromatic contrast; the PC pathway is very sensitive to red-green contrast because of the opponent input from M and L cones, and the KC pathway for blue-yellow contrast because of the opponent input between S cones and a mixture of the M- and L-cone types (see Lee, Martin, & Grünert, 2010; Lee, 2011, for review).
In this brief review we irst consider contrast
sensitivity as a function of the temporal frequency of luminance or chromatic modulation, neglecting spatial factors. By comparing psychophysical and physiological data, it is possible to model how cortical mechanisms operate on the retinal signal, in terms of temporal
iltering and other factors. However, contrast sensitivity
is often considered in a spatial context, for example, detection of sinewave gratings. Spatial characteristics
of contrast detection mechanisms, e.g., cortical ilters, are more dificult to specify in terms of ganglion cell
responses, but we argue that eye movements are critically important for detection of spatial contrast, echoing Kelly (1979), who suggested ‘eye movements are the sine qua non of pattern vision’.
Temporal sensitivity to luminance and
chromatic modulation
Kelly and his coworkers irst postulated that distinct
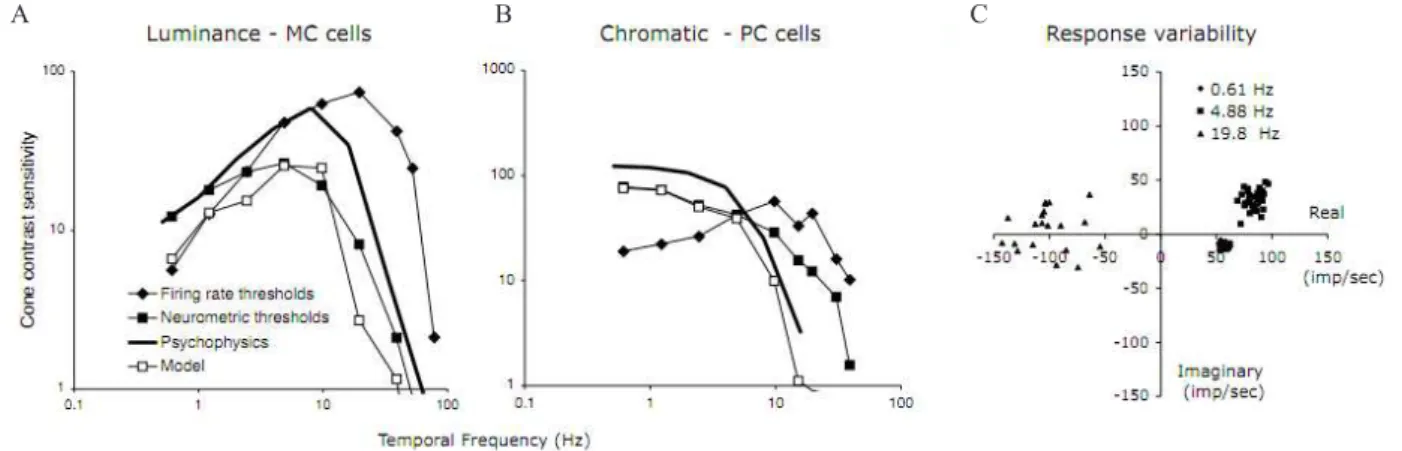
properties are responsible for detection of luminance and chromatic modulation (Kelly, 1974; Kelly & Norren, 1977). For luminance modulation set in a dark surround, the psychophysical luminance temporal sensitivity has a band-pass shape with peak temporal frequency near 10 Hz and a critical fusion frequency (CFF) of 40-50 Hz under photopic conditions. For chromatic modulation, the psychophysical chromatic temporal sensitivity has a low-pass character with maximal sensitivity at low temporal frequencies, falling off rapidly above 4 Hz with a CFF of 10-12 Hz. Figures 1A,B show examples of psychophysical temporal sensitivity curves for luminance and chromatic modulation; the data are replotted from Swanson Ueno, Smith, and Pokorny(1987).
The transient nature of MC cell responses implies a band-pass temporal response characteristic, and the sustained nature of PC cell responses implies a low-pass temporal response characteristic (e.g., Dreher, Fukuda, & Rodieck, 1976). This suggested a correlation between physiological MC and PC pathways and the psychophysical luminance and chromatic channels. In the following sections we describe the way in which such responses can be analyzed; early studies were
limited to consideration of iring rate, whereas later work
has adopted increasingly sophisticated approaches. A similar development can be seen, for example, in the
sophistication of approaches to the relation of the iring
of MT neurons to movement perception (reviewed in Britten, Shadlen, Newsome, & Movshon, 1992).
Figures 1A, B include luminance and chromatic modulation sensitivity of MC and PC cells in comparison to the psychophysical data; detailed
description of stimulus conditions is given in the igure
legends. The simplest way of relating psychophysical contrast sensitivity to cell responses is to measure cell
iring rate. For the “iring rate thresholds” curves (Lee,
Pokorny, Smith, Martin, & Valberg, 1990), cellular
sensitivity was deined as the stimulus contrast required to generate a 10 imp/sec modulation in cell iring measured as the irst-harmonic response amplitude
to the sinusoidal modulation. The MC-cell sensitivity curve for luminance modulation roughly corresponds to the psychophysical luminance curve, and the PC-cell sensitivity curve for chromatic modulation roughly corresponds to the chromatic curve. Responses of PC cells to luminance modulation are weak and do not match the shape of the psychophysical luminance curve (Lee et al., 1990; Sun, Rüttiger, & Lee, 2004).
However, in both luminance and chromatic cases
the cell sensitivity curves (iring rate) extend to higher
temporal frequencies than observed psychophysically. This might imply that high temporal frequency signals
are somehow iltered out at a central site; information
provided by the retina is discarded. One weakness of this
Figure 1. A: Comparison of psychophysical temporal contrast sensitivity to luminance modulation with cellular temporal contrast sensitivity to luminance modulation based on MC cells’ responses. The psychophysical temporal contrast sensitivity were replotted from Swanson et al. (1987). Cellular data are a mean of 5 cells. Firing rate thresholds refer to the modulation contrast required to evoke a 10 imp/sec 1st-harmonic Fourier response amplitude. Neurometric thresholds take into account both the cell 1st-harmonic response amplitude and cycle-to-cycle response variability. The model data assume that a central detector with a ixed time constant operates upon ganglion cell signals, and thresholds were estimated based on the operation of such a the central detector. A detailed description may be found in Leeet al. (2007). B: A similar approach with red-green chromatic modulation. Exact wavelengths and conditions differ between studies, and psychophysical and cellular sensitivities have been converted into cone contrast. C: An illustration of the increase in response noise in ganglion cell signals. Responses of a +L-M cell to red-green modulation are plotted for different temporal frequencies. X and Y axes represent the real and imaginary components of Fourier analysis; and each point represents Fourier analysis of response to a single stimulus cycle. As frequency increases, there is a moderate increase in response amplitude (distance to the origin increases) and a phase change due to response latency (rotation around the origin). There is also a substantial increase in response variability (scatter) due to the stochastic nature of the impulse train. In all data, retinal illuminance was ca. 1000-2000 td and ield size was 2-4 deg in diameter. Psychophysical data were obtained with foveal viewing, while physiological data from parafoveal recordings (5-10 deg eccentricity); this is also the case in Figures 2-4.
early analysis is that it neglected response variability. Central mechanisms must distinguish signal from noise in
the afferent retinal responses, and this irst analysis did not
take into account neural noise, i.e., response variability of a single cell, although it did consider inter-cell variability. More sophisticated analysis takes this into account.
Recent results indicates that response variability increases with temporal frequency (Sun et al., 2004). Figure 1C illustrates this point. It shows responses of a PC cell (+L-M) to red-green modulation at three temporal frequencies. The impulse trains for the ganglion cell were Fourier analyzed cycle-by-cycle. The real and imaginary components of the 1st harmonic
responses for each cycle are shown. At 0.61 Hz, the points for individual cycles are closely clustered. This indicates little response variability from cycle to cycle. As temporal frequency increases, the clouds of points (squares for 4.88 Hz and triangles for 19.8 Hz) move further away from the origin, indicating an increase in mean response amplitude, and they rotate counterclockwise around the origin, due to response latency. In addition, scatter of the cloud also increases substantially, i.e., responses become more variable from cycle to cycle. This is because the total number of impulses per cycle decreases with temporal frequency as stimulus cycle length decreases. Impulse generation of ganglion cells approximates a Poisson process (Troy & Lee, 1994), and with fewer impulses response variability increases.
The next step is to estimate the threshold of an ideal observer who bases judgments on the output of a single cell, by comparing its response amplitude to its response variability; further details of this procedure are given in Lee, Sun, and Zucchini (2007). This leads to
the “neurometric thresholds” curves in Figures. 1A,B. Some high frequency sensitivity in the iring rate curve
is lost in the neurometric curve due to the increased response noise at high temporal frequencies, and the MC-cell MTF now corresponds better to psychophysical
sensitivity. So central iltering is no longer required in
this case. The PC-cell response to chromatic red-green modulation is now low-pass as in the psychophysics, but it still extends to higher temporal frequencies than
the psychophysical curve. This would conirm that high temporal frequency chromatic responses are iltered and
discarded at a central site (or that the central detection mechanisms have a long time constant; see below). A similar result holds for blue-yellow modulation and cells of the S-cone pathway (Yeh, Lee, & Kremers, 1995).
This kind of single-cell analysis does not take into account how central mechanisms pool information from an array of retinal inputs; it determines the sensitivity that can be achieved by assuming an observer bases judgments on a single cell, and this is unrealistic. In addition, the neurometric analysis depends on Fourier analysis of cell responses. Fourier analysis takes single
cycles of the cell response, which means that the analysis window changes with temporal frequency. In reality, the psychophysical luminance and chromatic
mechanisms have a ixed summation time, or critical
duration (Swanson et al., 1987), and hence it is unlikely that a central detector changes its time course with the temporal structure of the input. It is more realistic to
model a central detector with a ixed time constant (Lee
et al., 2007). Details of the kind of assumptions needed for this modeling can be found in Lee et al. (2007).
The “model” curves in Figures 1A, B shows contrast
sensitivity for a cortical detector with a constant time window of ca. 40 msec for luminance modulation, and 200-300 msec for chromatic modulation. Their shapes closely resemble the psychophysical data. The time windows used for luminance and chromatic modulation are similar to the critical durations estimated for psychophysical sensitivity to luminance and chromatic
lashes (Swanson et al., 1987).
The resulting ‘Model’ curves fall below psychophysical sensitivity by about a factor of two. Additive summation of cell signals can be shown to increase sensitivity of a central mechanism in proportion to the square root of the number of cells, as might be expected on a statistical basis. So summation over just a few cells (ca. 4) would be adequate to improve the model sensitivity so that is can support psychophysical performance. Lastly, neurometric functions relating cell sensitivity to contrast are usually shallower than psychometric functions (Tolhurst, Movshon, & Dean, 1983). To steepen the function, some non-linear multiplicative interaction is necessary (Lee et al., 2007; Tolhurst et al., 1983).
To summarize, we have briely reviewed how
psychophysical contrast sensitivity to luminance and chromatic modulation can be modeled based on ganglion cell responses, using the impulse trains emanating from retinal ganglion cells. Under many conditions, cellular sensitivity (MC cells to luminance modulation and PC cells to chromatic modulation) is not much lower than that of an observer, hence summation over just a few cells’ responses would be adequate to support psychophysical performance. These conclusions hold at different retinal illuminance levels (Lee et al., 1990) and also with other stimulus waveforms such as pulses (Lee, Pokorny, Smith, & Kremers, 1994), square waves and ramps (Kremers, Lee, Pokorny, & Smith, 1993). One striking feature of this analysis is that the response of PC cells to red-green chromatic modulation (and S-cone cells to blue-yellow modulation) extends to higher temporal frequencies than can be seen psychophysically. High temporal frequency chromatic signals appear to be
iltered out at a central site.
The experiments described indicate that speciic
models must be addressed when trying to relate ganglion
cell activity to contrast sensitivity; iring rates are not
Spatial aspects of contrast sensitivity
The above analyses suggest that summation over a limited number of ganglion cells is required to reach psychophysical sensitivity. Spatial summation in, for example, a spatial detection mechanism encompassing just a few ganglion cells, would be adequate. Can one
ind support for this supposition?
It is of note that in Vernier tasks, thresholds with pairs of short bar targets that each cover just a few MC cells’
receptive ields are comparable to thresholds with pairs of long bar targets that cover many receptive ields. This
suggests that summation of spatial signals from just a few ganglion cells is adequate to support psychophysical performance (Lee, Wehrhahn, Westheimer, & Kremers, 1995). The fact that extending the bar target to greater lengths does not lower psychophysical thresholds indicates that, in this task, cortical mechanisms do not sum along long contours and are thus spatially restricted. The equivalent spatial summation paradigm for detection task is Ricco’s law, i.e. log threshold decreases linearly as a function of log target area, and the total stimulus energy (production of threshold and stimulus area) at threshold is constant. Barlow (1958) estimated
that detection ‘eficiency is highest for a stimulus about
40-45 arc minute in diameter’ at an eccentricity of 6.3 degrees (close to the eccentricity at which our recordings are performed). Ganglion cell density is about 1000 per square degree at this eccentricity (Wässle, Grünert, Röhrenbeck, & Boycott, 1990). If ca. 10% of ganglion
cell are MC cells (including both on- and off-center cells), and the MC cell center has a Gaussian radius of ca. 5 min at this eccentricity (Derrington & Lennie, 1984), this would correspond to just 4-6 ganglion cell centers being fully covered by a 40-45 arc minute target at the highest
detection eficiency. On the other hand, psychophysically
spatial summation is heavily dependent on temporal factors and retinal illuminance (Barlow, 1958), and some improvement in threshold persists up to very large
stimulus sizes, so it is dificult to draw irm conclusions
from spatial summation experiments of this type. MC cell responsivity to perimetric stimuli has recently been compared to psychophysical sensitivities in perimetric measurement (Swanson, Sun, Lee, & Cao, 2010). The perimetric tests considered were the conventional size III stimulus (circular luminance increment of 26 min of arc in diameter) and a ‘frequency-doubling’ stimulus (a 0.5 cycle/deg counterphase modulated grating of size 2 deg of arc x 2 deg of arc). The ratio of MC cell responsivity to psychophysical sensitivity was similar in both cases, indicating that central detection mechanisms do not take advantage of the large spatial extent of the frequency-doubling stimulus relative to the small size III spot, thus also implying central detection mechanisms involved in the detection have limited spatial extent.
Another approach to the spatial mechanisms underlying detection derives from experiments with modulated targets set in different surrounds. The
Figure 2.A: Three stimulus conditions that yield different psychophysical results. A modulated target is set in an equiluminant surround, or a surround of much lower or higher luminance. At low temporal frequencies, psychophysical temporal contrast sensitivity is much higher with the equiluminant surround than with surround of either higher or lower luminance. B: Sketch of stimulus conditions for physiological measurements. A modulated central ield was set in three different surrounds (equiluminant, dark, bright). The stimulus was positioned at different loci relative to the receptive ield center. C: Mean response amplitudes as a function of stimulus (hatched region) locus relative to the receptive ield for the three surround conditions. Response amplitude is little affected by the surround, and there is no obvious enhancement of the response close to the edge of the target. Mean luminance was 30 cd/m2. Data shown are vector averaged responses of 5 MC cells.
psychophysical data in Figure 1 were measured with targets set in a dark surround, as in the middle sketch in Figure 2A. If the modulated spot is set in an equiluminant surround (Figure 2A, upper sketch), then the luminance psychophysical sensitivity curve becomes low-pass, i.e., there is a dramatic increase in contrast sensitivity
at low temporal frequencies. This was irst noted by Kelly (1961) and since conirmed by several authors;
if the target is set in a bright surround, the sensitivity curve again reverts to a band-pass shape (Figure 2A, lower sketch (Spehar & Zaidi, 1997). Kelly proposed
that ixational eye movements across the border of a
modulated target in the equiluminant surround provided a contrast signal, causing the elevated sensitivity. However, this was discounted by later authors since such effects apparently persisted with a stabilized retinal image (Keesey, 1970). The phenomenon was attributed to an effect of static contrast, so that some lateral interaction, such as lateral inhibition, enhanced responsivity of a contrast mechanism at the border.
The validity of this explanation has recently been reexamined at the ganglion cell level (Ennis, Lee, & Zaidi, 2009). Ganglion cells’ responses were recorded to luminance modulated stimuli (0.25 Hz) set in equiluminant, dark or brighter surrounds (Figure 2A) and presented at various locations relative to
the receptive iled center, as sketched in Figure 2B.
Ganglion cell response amplitudes (25% stimulus contrast) as a function of stimulus location relative to the
receptive ield center for the three surround conditions
are plotted in Figure 2C. The hatched area represents the stimulus. Responses of on- and off-center cells were similar (except for the difference in phase) and the data represent averaged response amplitude for on- and off-center cells combined (n=5). There is little difference in ganglion cell responsivity (in terms of 1st harmonic
amplitude from Fourier analysis) between the different surround conditions, and none of the surround conditions
showed signiicant enhancement of responses at the
edge of the stimulus. Also, response amplitude is low, less than 10 imp/sec. Neurometric analysis indicated
low detectability with these iring rates (see Leeet al., 2007, for details). These results strongly indicate that, at the ganglion cell level, static contrast does not produce any edge enhancement effects that might account for the psychophysical results, and one might conclude that it
would be dificult to generate such edge enhancement
based on static contrast at a central site.
If the static contrast hypothesis is invalidated,
the ixational eye movement hypothesis should be
reconsidered as a basis for contrast detection under these conditions. We attempted to mimic the effects of eye movements by introducing small stimulus displacements (jumps) during the modulation cycle, as might occur with small saccades. This situation is sketched in Figure 3. In the top panels of Figure 3A, stimuli with
an equiluminant surround are sketched. The luminance of the stimulus center is sinusoidally modulated around the static surround luminance level, as indicated in the stimulus modulation waveform. A 30 min of arc stimulus jump occurred at different modulation phases. The stimulus was so situated that the edge traversed the
center of the receptive ield of the cell, in the example
shown an on-center MC-cell. If the jump direction is such that an incremental stimulus edge traverses the cell’s center, then an on-center MC cell gave a vigorous excitatory response (second column); for the same stimulus location but the opposite jump direction there
is an inhibition of iring, since the luminance over the
Figure 3. Demonstration of vigorous responses from MC cells evoked by small displacements of a modulated target set in an equiluminant surround. The top row show four snapshot of the stimulus, and below is sinusoidal modulation of target luminance
in time. The target jumps over the receptive ield at different
modulation phases; the snapshots are positioned above the modulation phase at which the jump occurs, and the receptive
ield position shown refers to the top row of histograms. Each row
of histograms shows responses to target jumps at the 4 phases of
target modulation. The ield position shown refers to the upper row of histograms. In the irst and third histograms, the jump
occurs at a phase when the target is of the same luminance as the surround; no response occurs. If the jump occurs when the target is at higher luminance than the surround, on-center cells will give a vigorous response to the appropriate jump direction. The two rows show opposite jump directions; in the lower row, the edge
jumps back and the receptive ield is situated on the other side of
the edge. B: If the target is set in a dark surround, there is always a vigorous response, irrespective of target phase, or whether the stimulus is modulated at all. Mean target luminance 30 cd/m2; jump amplitude 30 min of arc. Target modulation 40%.
A
center decreases (fourth column). If the stimulus jump occurs when the stimulus center is at the same luminance
as the surround, there is no ganglion cell response (irst
and third columns). The lower row of histograms shows what happens for a jump back in the reverse direction,
with the receptive ield starting just outside the stimulus.
The contrast relationships are now reversed, as is the pattern of responses. Neurometric analysis shows that these response peaks can support detection. Responses of off-center cells showed a reciprocal pattern.
Figure 3B shows the situation with a dark surround, for just two of the jump conditions. Responses are equally vigorous no matter whether the stimulus is at its peak luminance or mean luminance, or unmodulated (not shown). Thus, with a dark surround, the presence of eye movement does not help the detection of the stimulus.
These data indicate that, at least under these stimulus conditions, eye movements play a critical role in contrast detection, as originally suggested by Kelly (1961). The implication is that small retinal areas close to the
contrast edge provide signiicant inputs to the detection
mechanism. This would be consistent with the results with sinusoidal modulation in the previous section, where convergence of a few cells onto a central detector would be adequate to account for psychophysical sensitivity. On the other hand, how a coherent percept of the stimulus target is generated when responses of on- and off-center cells give intermittent information about the border, dependent on the detailed pattern of eye movements remains an open question.
The role of eye movements in contrast detection was further addressed by Kelly (1979) by measurement of psychophysical contrast sensitivity over a broad range of temporal and spatial frequencies during image stabilization, to construct what he termed a spatiotemporal threshold surface. He stressed that spatial contrast
sensitivity curves under normal viewing conditions, with eye movements, are likely to have a marked low spatial frequency attenuation because, at low spatial frequencies and with natural eye movements, temporal frequency is very low; thus low spatial frequency attenuation and low temporal frequency attenuation are confounded.
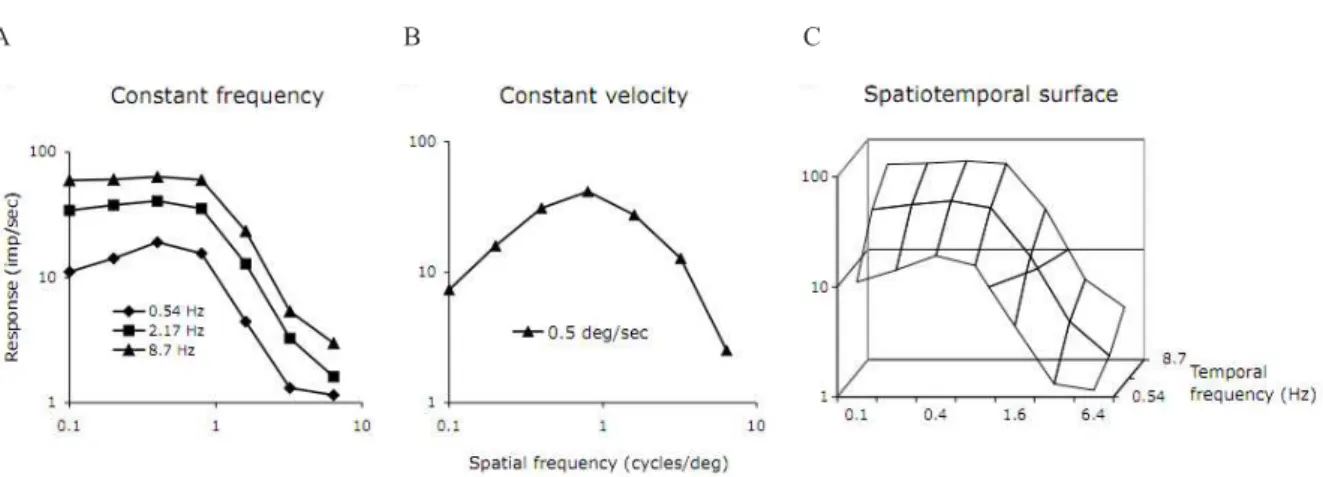
An analogous approach was used to obtain the cellular data shown in Figure 4, which shows averaged values from a sample of MC cells (n=14). Figure 4A shows ganglion cell response as a function of spatial frequency at three temporal frequencies. There is some interaction between spatial and temporal frequency (at 0.51 Hz the function is more band-pass in shape), but the curves do not show substantial low-frequency attenuation. However, if a constant drift velocity across the retina is used (i.e. the product ratio of temporal and spatial frequency is constant), the spatial frequency tuning curve becomes much more band-pass due to the low responsivity of MC cells to low temporal frequencies (Figure 4B). The data in Figure 4A can be replotted in 3-dimensional form as in Figure 4C. These data resemble the psychophysical results of Kelly (1979), who showed a more extensive spatiotemporal surface. We interpret these results as supporting the hypothesis that psychophysical contrast detection
is strongly dependent on ixational eye movements
scanning across the visual scene.
Discussion and conclusions
The goal of our approach is to delimit mechanisms of contrast detection by considering the signals generated by retinal ganglion cells. It appears that, for temporal modulation, combining signals from just a few cells is adequate to support a psychophysical mechanism of the required sensitivity, for both luminance and chromatic
Figure 4. MC cell spatial frequency tuning curves under different conditions; all data at 40% contrast, mean of 8 cells. A:
Curves at different temporal frequencies show similar shapes, except for greater low spatial frequency roll off at the lowest temporal frequency. B: If measurements are made at the same drift velocity across the visual ield the spatial frequency tuning
curve becomes more band-pass in shape, since at low spatial frequency the temporal frequency is low as well. C: Section of spatiotemporal response surface at the three temporal frequencies tested. Mean luminance 30 cd/m2.
modulation. However, for chromatic modulation at high temporal frequencies, signals of PC cells appear
to be iltered out at a central site; this could be because
high-frequency signals in chromatic pathways lose their chromatic opponency (Gouras & Zrenner, 1979; Lee Martin, Valberg, & Kremers, 1993) so that the integrity of the chromatic signal is compromised.
We argue that luminance contrast detection mechanisms have limited spatial extent, receiving input from only a few MC cells. The spatial extent of chromatic detection mechanisms is less clear. Although the psychophysical effects sketched in Figure 2A also occur with chromatic targets (Ennis et al., 2009), the sustained nature of PC-cell responses makes the effects shown in Figure 3 (for MC cells and luminance modulation) much less obvious in PC cells.
For spatial processing of luminance contrast detection, we suggest that the role of target movement (either through eye movements or movement of the target itself) is crucial, consistent with detection mechanisms of limited spatial extent activated by contrast borders. Kelly
(1961) irst suggested eye movements were important
in this context, but the apparent persistence of the effect sketched in Figure 2 after image stabilization (Keesey, 1970) led this idea into disfavor, and Kelly (1969) considered explanations relying on lateral inhibitory effects. However, it seems likely from the present results that this account is inadequate; early attempts at image stabilization were not entirely effective.
The concept of sustained and transient channels in human vision (Kulikowski & Tolhurst, 1973), linked to the discovery of sustained and transient ganglion cell classes (albeit in the cat), led to a general neglect of the role of eye movements in contrast detection; sustained ganglion cell classes with strong center-surround structure were thought to provide a basis for static contrast effects. However, although PC cells are sustained, they have very low achromatic contrast sensitivity (Hicks, Lee, & Vidyasagar, 1983; Kaplan & Shapley, 1986), so that achromatic contrast detection based on this cell class appears unlikely. If contrast detection depends on the MC pathway, the transient nature of their responses will accentuate the role of eye movements in contrast detection.
A role for eye movements has largely been neglected in summaries of spatial vision psychophysics (Graham, 1989). Nevertheless, Kelly (1979) returned to his original hypothesis in later work, and concluded, as cited above, ‘eye movements are the sine qua non of spatial vision’. The role of eye movements in pattern vision has recently been the subject of renewed interest, and a critical role of eye movements in contrast sensitivity is supported by some of the recent results sketched here.
The cortical site of possible detection mechanisms is unknown as is their neurophysiological structure. It is likely that it is naïve to seek them at a single cell level, as implied in the neuron doctrine for the cortex (Barlow,
1972), but rather they should be sought in some form
of distributed processing. This makes veriication of the
mechanisms proposed here a challenging task.
Acknowledgements
We thank Robert Ennis and Qasim Zaidi to reproduce unpublished data in Figures 2 and 3. This work was supported by NIH grant EY 13112 to BBL.
References
Barlow, H. B. (1958). Temporal and spatial summation in human vision at different background intensities. Journal of Physiology,
141, 337-350.
Barlow, H. B. (1972). Single units and sensation: a neuron doctrine for perceptual psychology? Perception, 1, 371-394.
Britten, K. H., Shadlen, M. N., Newsome, W. T., & Movshon, J. A. (1992). The analysis of visual motion: a comparison of neural and psychophysical performance. Journal of Neuroscience, 12, 4745-4765. Derrington, A. M., & Lennie, P. (1984). Spatial and temporal contrast
sensitivities of neurones in lateral geniculate nucleus of macaque. Journal of Physiology, 357, 219-240.
Dreher, B., Fukuda, Y., & Rodieck, R. W. (1976). Identiication, classiication and anatomical segregation of cells with X--like and Y--like properties in the lateral geniculate nucleus of old-world
primates. Journal of Physiology, 258, 433-452.
Ennis, R., Lee, B. B., & Zaidi, Q. (2009). The effects of eye movements
on contrast detection. Society for Neuroscience Abstracts, 651.11.
Gouras, P., & Zrenner, E. (1979). Enhancement of luminance licker
by color-opponent mechanisms. Science, 205, 587-589.
Graham, N. (1989). Visual Pattern Analyzers. New York: Oxford
University Press.
Hicks, T. P., Lee, B. B., & Vidyasagar, T. R. (1983). The responses of cells in macaque lateral geniculate nucleus to sinusoidal gratings. Journal of Physiology, 337, 183-200.
Kaplan, E., & Shapley, R. M. (1986). The primate retina contains two types of ganglion cells with high and low contrast sensitivity. Proceedings of the National Academy of Sciences, U.S.A., 83, 2755-2757.
Keesey, U. T. (1970). Variables determining licker sensitivity in small ields. Journal of the Optical Society of America, 60, 390-398. Kelly, D. H. (1961). Visual responses to time-dependent stimuli:
I. Amplitude sensitivity measurements. Journal of the Optical
Society of America, 51, 422-429.
Kelly, D. H. (1969). Flickering patterns and lateral inhibition. Paper presented at the Journal of the Optical Society of America. Kelly, D. H. (1974). Spatio-temporal frequency characteristics
of color-vision mechanisms. Journal of the Optical Society of America, 64, 983-990.
Kelly, D. H. (1979). Motion and vision. II Stabilized spatio-temporal threshold surface. Journal of the Optical Society of America, 69, 1340-1349.
Kelly, D. H., & Norren, D. V. (1977). Two-band model of heterochromatic licker. Journal of the Optical Society of America,
67, 1081-1091.
Kremers, J., Lee, B. B., Pokorny, J., & Smith, V. C. (1993). Responses of macaque ganglion cells and human observers to compound
periodic waveforms. Vision Research, 33, 1997-2011.
Kulikowski, J. J., & Tolhurst, D. J. (1973). Psychophysical evidence for sustained and transient detectors in human vision. Journal of Physiology, 232, 149-162.
Lee, B. B. (2011). Visual pathways and psychophysical channels in
the primate. Journal of Physiology,589, 41-47.
Lee, B. B., Martin, P. R., & Grünert, U. (2010). Retinal connectivity
and primate vision. Progress in Retinal Research, 29, 622-639.
Lee, B. B., Pokorny, J., Smith, V. C., Martin, P. R., & Valberg, A. (1990). Luminance and chromatic modulation sensitivity of
macaque ganglion cells and human observers. Journal of the
Optical Society of America A, 7, 2223-2236.
to combined luminance and chromatic modulation. Journal of the Optical Society of America A, 10, 1403-1412.
Lee, B. B., Pokorny, J., Smith, V. C., & Kremers, J. (1994). Responses
to pulses and sinusoids in macaque ganglion cells. Vision Research,
34, 3081-3096.
Lee, B. B., Wehrhahn, C., Westheimer, G., & Kremers, J. (1995). The spatial precision of macaque ganglion cell responses in relation to
Vernier acuity of human observers. Vision Research, 35, 2743-2758.
Lee, B. B., Sun, H., & Zucchini, W. (2007). The temporal properties of the response of macaque ganglion cells and central mechanisms of licker detection. Journal of Vision, 7, 1-16.
Spehar, B., & Zaidi, Q. (1997). Surround effects on the shape of the temporal contrast-sensitivity function. Journal of Optical Society of America A, 14, 2517-2525.
Sun, H., Ruttiger, L., & Lee, B. B. (2004). The spatiotemporal precision of ganglion cell signals: a comparison of physiological
and psychophysical performance with moving gratings. Vision
Research, 44, 19-33.
Swanson, W. H., Ueno, T., Smith, V. C., & Pokorny, J. (1987). Temporal modulation sensitivity and pulse detection thresholds
for chromatic and luminance perturbations. Journal of the Optical
Society of America A, 4, 1992-2005.
Swanson, W. H., Sun, H., Lee, B. B., & Cao, D. (2010). Responses of retinal ganglion cells to perimetric stimuli. Investigative Ophthalmology and Visual Science, 51,764-771.
Tolhurst, D. J., Movshon, J. A., & Dean, F. A. (1983). The statistical reliability of signals in single neurons in cat and monkey visual cortex. Vision Research, 23, 775-785.
Wässle, H., Grünert, U., Röhrenbeck, J., & Boycott, B. B. (1990). Cortical magniication factor and the ganglion cell density of the
primate retina. Vision Research, 30, 1897-1911.
Yeh, T., Lee, B. B., & Kremers, J. (1995). The temporal response of ganglion cells of the macaque retina to cone-speciic modulation.