A study of the distribution of phylogenetically conserved blocks
within clusters of mammalian homeobox genes
Nikola Stojanovic
Department of Computer Science and Engineering, University of Texas at Arlington, Arlington, Texas, USA.
Abstract
Genome sequencing efforts of the last decade have produced a large amount of data, which has enabled whole-genome comparative analyses in order to locate potentially functional elements and study the overall patterns of phylogenetic conservation. In this paper we present a statistically based method for the characterization of these patterns in mammalian DNA sequences. We have applied this approach to the study of exceptionally well conserved homeobox gene clusters (Hox), based on an alignment of six species, and we have constructed a map of Hox cata-loguing the conserved fragments, along with their locations in relation to the genes and other landmarks, sometimes showing unexpected layouts.
Key words:genomics, phylogenetic conservation, multiple sequence alignments, heaviest segments, Hox.
Received: November 4, 2008; Accepted: May 25, 2009.
Introduction
The power of comparative analysis of genomic sequence data has been recognized for many years. The conservation patterns among related species reveal the homology between genomic segments, as well as the ef-fects of functional constraints on mutations (Hardison, 2000; Zody, 2007). It is generally understood that con-served regions did not succumb to the evolutionary drift due to the effect of deleterious mutations, and consequently sequence alignments became important for locating func-tional loci in DNA (Milleret al., 2004). For larger regions, such as gene exons, even pairwise alignments are already sufficient if the target species are chosen well, but for the detection of subtler signals one needs multiple sequences. Until several years ago large scale studies of multiple align-ments were not feasible in eukaryotes, mammals in particu-lar, but with the advancement of sequencing projects this situation has dramatically changed. In particular, projects directed towards targeted sequencing of genomic regions for the purpose of the analysis of conservation (Thomaset al., 2003; The ENCODE Project Consortium, 2004; Mar-gulieset al., 2005) have already produced substantial re-sults (The ENCODE Project Consortium, 2007; Kinget al., 2007).
Whereas the early attempts to identify functional DNA elements based on phylogenetic conservation were largely heuristic, there were continuous efforts to
statisti-cally characterize them with respect to the background (Li and Miller, 2002; Ganley and Kobayashi, 2008). Local background may amount to more than just a reference framework, as it has been known for more than a decade now that regions such asHox gene clusters may be pro-tected from evolutionary drift by some yet unknown mech-anism (Duret and Bucher, 1997). Thus, if a region of good conservation appears unlikely in its environment that could be a strong indication that it is important. A region of a more ordinary composition can still be functional, but it does not stand out clearly enough to suggest function based solely on the conservation, so other methods may be needed (for instance, a combination of positional information with lookups in the databases of known motifs, such as TRANSFAC (Wingender, 2008) or Jaspar (Bryne et al., 2008)). However, before addressing this issue one needs to characterize what “local” means. Concerning the rate of change between homologous sequences it should clearly be an area in which this rate does not vary much, overall.
The approach described in this paper is based on this local environment concept. We have applied it to the analy-sis of clusters of mammalian homeobox genes, also known asHox. We have chosen them because they have been ex-tensively studied, so the locations of genes and many other elements are well known, and also because of their good overall phylogenetic conservation which involves features other than simple sequence motifs, including the stability of intergenic spacing in orthologous, but not paralogous, clus-ters and an apparent resiliency to rearrangements and the insertion of transposable elements (International Human Genome Sequencing Consortium, 2001). There are four
Send correspondence to Nikola Stojanovic. Department of Com-puter Science and Engineering, University of Texas at Arlington, 301 Nedderman Hall, 416 Yates Street, 76019-0015 Arlington, TX, USA. E-mail: [email protected].
Hoxclusters in mammals:HoxAon human chromosome 7, HoxBon chromosome 17,HoxCon chromosome 12, and HoxD on chromosome 2. They span about 100-200 kb each, and contain a total of 39 genes in human, divided in 13 groups of paralogs (labeled 1 through 13).Hoxgenes are ordered in the same way in each cluster, although not every cluster contains the full set of 13 genes. The function of the paralogs is only partially redundant, as the loss of one gen-erally cannot be completely compensated by the others (Horanet al., 1995; Duboule, 2000; Lynchet al., 2006).
AllHox genes code for transcription factors which regulate the formation of the anterior-posterior axis of an animal during early embryonic development, acting on a large number of downstream genes (Forondaet al., 2008, Li-Kroeger et al., 2008). Since this axis is common throughout the evolution,Hoxclusters are well conserved, often over regions much longer than expected under a sim-ple model of coding sequence and transcriptional regula-tion. These genes are also triggered in a strict succession which corresponds to their spatial arrangement (Cobb and Duboule, 2004), so their order, and not just their sequence, appear to be under constraint. This was instrumental for our purpose, because we could build reliable multiple align-ments, and also expect that the nature and positions of func-tional elements could not have varied much. However, the main goal of our work was the characterization of the over-all phylogenetic sequence conservation in Hox clusters, rather than a search for individual functional elements. The latter task can be better achieved by projects such as ENCODE, whereHoxAwas one of its target regions during its pilot phase (The ENCODE Project Consortium, 2004). Many other groups are currently looking atHoxclusters, too, since developmental regulation is a subject of intensive research.
Materials and Methods
As the first step in our analysis, we have constructed long alignments of all fourHoxclusters and their surround-ing regions (of about 500 kb each, measured in human se-quence) from six mammals representing three distinct groups: two primates (human and baboon), two ungulates (cow and pig) and two rodents (mouse and rat), using Multi-LAGAN software (Brudnoet al., 2003). Since this alignment has been initially built for the targeted study of other genomic features, in an unrelated work by our collab-orators, it included only 27 out of 39 Hox genes in its high-quality section, which has nevertheless provided us with long contiguous regions of about 90 kb ofHoxA clus-ter, 150 kb ofHoxBcluster, 160 kb ofHoxC cluster and about 80 kb ofHoxDcluster. These sequences totaled to about half megabase ofHox, comprising about half of the total area of the clusters and two thirds of the genes, so we considered these data sufficient for our study.
We then fragmented the alignments into large blocks where the conservation rate could have been considered
constant. This was done iteratively, expanding small seed blocks until the application of the Central Limit Theorem indicated that the neighboring ones were unlikely to draw from the same distribution, at 0.99 or higher significance. The seed length has been set to 50, as we wanted it as short as possible, and below this minimal sample size the appli-cation of the CLT may have been unreliable. As a practical rule in statistics, it is a generally accepted that Central Limit Theorem should be used for sample sizes of at least 50, and preferably 100 or more. Below this count one can still use Student-tdistribution with appropriate number of degrees of freedom, however special considerations concerning the underlying random variable must be observed.
The columns of the alignment were scored using our implementation of the weighted parsimony algorithm (San-koff and Cedergren, 1983). However, we have tried to avoid introducing an arbitrary bias (since the relative evo-lution rates of the species we have considered are still largely unknown) and thus applied the uniform mutation costs,i.e.the unweighted scoring scheme, except for favor-ing transitions over transversions when there was a choice. For example, it has been well established that rodent evolu-tion rate is faster than that of primates (Mouse Genome Se-quencing Consortium, 2002), but even the relative positions of rodent and ungulate branches on the evolution-ary tree, with respect to primates, are still somewhat contro-versial (since all three groups are at about equal distance of 80-100 Myr). In this study we have applied a model under which rodents are closer to primates, as there appears to be accumulating evidence in support of this hypothesis. Inser-tions and deleInser-tions, reflected as gaps in the alignment, were treated as any other substitutions, even if a chain of gaps likely corresponds to a single evolutionary event. This way the entire alignment could have been represented as an ar-ray of scores si, divided into blocks of the initial seed
length, and subject to further refinement. In each iterative step we have calculated the meansmand sample variances
s2of the neighboring regions, then used themof the larger
sample as the true mean, and the smaller sample for the cal-culation of the confidence interval. These steps were re-peated until there was no change in the total number of blocks. Once it has been determined that neighboring blocks were unlikely to feature the same conservation rate, further refinement was performed in order to establish the most likely boundary, by adjusting it until it optimally dis-tributed the columns closer to one of the two means.
DNA, which are not position-specific). Once such blocks have been determined, we proceeded to identify the outli-ers. The expectation was that these outliers would roughly correspond to gene exons, as they would be the only known elements which would warrant relatively long blocks of consistent good correspondence.
After establishing the background conservation rate, it was possible to further isolate shorter regions significant within their own environment. Since the lower values for individual alignment column scoressiobtained through the
application of parsimony indicated better conservation, we modified them by subtracting si from the average local
background divergence. That assigned the highest score to the most conserved columns, and only these scoring better than the local mean remained positive. However, we have now used an infinite negative score for gap-containing col-umns – while some significant areas might have been lost because of this strategy, it also protected us from dealing with blocks in which, for instance, all but one sequence fea-tured a gap (in addition, a gap in any short region would likely preclude its function, and, furthermore, such gaps may even indicate just the lack of data, rather than a genu-ine evolutionary event). We have used the modified scores in order to isolate full runs of columns, also known as heaviest segments, by applying an algorithm (Stojanovic, 2009) we have adapted from Bentley (1986). Our imple-mentation is technically different, but it produces the same effect as the algorithm of Ruzzo and Tompa (1999). We de-fine the full runs as the maximal intervals cumulatively scoring higher than any of their subintervals.
Our algorithm locates all full runs in O(n) time, where nis the size of the score array,i.e.the number of columns in the alignment. In order to avoid the clutter and observe the trends, as opposed to individual sites, we have somewhat arbitrarily limited the minimal length of a considered full run to 25 columns. While this size may miss quite a few iso-lated transcriptional regulatory elements, it was appropriate for our goals, and for an environment conserved as well as Hox- other genomic regions may require a much smaller lower bound, although setting up an optimal one is more art than science.
We then calculated the mean and the variance for each of the located regions, and used these values for fur-ther comparisons. However, the located regions may still not be statistically significant in their own surroundings, so they needed to be examined in a more stringent way. Be-cause they were generally short (up to a few dozen bases), we have used the Student-ttest. Due to the decrease in vari-ance when the average is taken over longer intervals (and the increase in the number of degrees of freedom), longer ones may be more likely to pass the significance threshold, and in a purely random setting they would be also less likely to stand out. This corresponds well with their pre-sumed biological meaning, however the quality of the background conservation introduces a bias in the
interpre-tation, relating to the well-known dilemma of whether a perfectly conserved block should be discarded simply be-cause everything around it is well preserved. Blocks with a significant mean (i.e. these within outlying backgrounds, where everything which even slightly stands above the av-erage is highly significant, in reality, if not by likelihood) should thus be considered by that measure only, while the statistical significance test should be applied to these dis-covered in poorer background conservation areas.
We have assumed that if the regions of constant con-servation rates do not capture the exons of Hox genes throughout, at least their fragments should be recognized as long significant blocks. Shorter intervals may indicate pos-sible transcription factor binding sites and other functional elements, but their actual prediction would require further work. The fact that a region is distinguished from its envi-ronment still need not imply that it has a function, or at least an obvious function, as recent experiments have demon-strated in a rather dramatic way (Ahituvet al., 2007). We have thus limited our study to the annotation of the se-quence sites according to how unusual they were, leaving the actual determination of their functionality to expert esti-mates, computational (using further evidence), and in the laboratory.
Results
As soon as significant amounts of mammalian geno-mic sequences became available, includingHox, research-ers started looking at large-scale synteny and other compar-ative features. This has led to the first, relcompar-atively informal, observations that the overall conservation patterns in align-ments of some genomic segalign-ments, ours as well as these of other investigators, inHox(Sabarinadh et al., 2004) and elsewhere in mammalian genomes (Rijnkelset al., 2003), did not appear to correlate well with the expectations. If an alignment is biologically correct (and a mathematical opti-mum under a good scoring scheme would presumably come close to that), one would expect that gene exons would stand out more-or-less clearly, while the regulatory sequences would be dotted with clusters of conserved tran-scription factor binding motifs. Because of the inter-species genetic variations and the lack of DNA sequence specific-ity of most regulatory proteins this rarely happens in realspecific-ity, but a reasonably close alignment layout is intuitive (Sto-janovicet al., 1999).
intergenic region at the opening end, which was beneficial for our study (Figure 2). InHoxCwe have selected the area between about 48 kb 5’ toHoxC13to about 15 kb 3’ of HoxC5. This included the 5’ end of theHoxCcluster, with a significant starting intergenic area, but excluded its 3’ end, missing the HoxC4 gene. In HoxD we had the least se-quence to work with – our fragment included the last 264 bases of the intron ofHoxD4(thus missing sixHoxgenes, plus one exon) until about 46 kb 3’ ofHoxD1. At the 3’ end of theHoxDcluster we thus had a large segment of inter-genic sequence, however there has been an Ensembl (Fli-ceket al., 2008) prediction of another gene (XP_496612.1) in that area (a record which has been removed on re-annotation, despite the mRNA and EST evidence). Overall, this gave us a good blend ofHoxenvironments in which any patterns should be clearly visible.
We were somewhat surprised by the outcome of the initial breakup of the alignments into areas of constant con-servation rate, as they became divided into a large number of blocks of 250 bp on average, which could not have been merged further. This was primarily due to very low sample variances, and that confirmed the known fact that genomic sequences are far from random, even outside genes. How-ever, since intervals of this size can capture exons, we were content with this kind of division, especially as it was sta-ble,i.e.it did not substantially change with large increases in the significance threshold. Using this division we have also located shorter full runs standing out in these environ-ments.
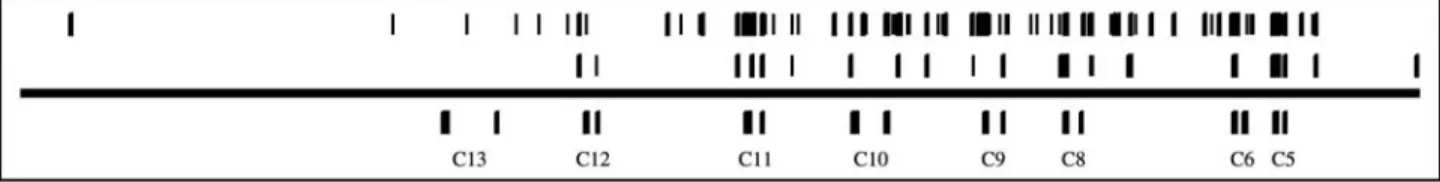
First we considered all segments, either large con-stant-rate environments or shorter regions of minimal length 25 bp, featuring a parsimony score of at most 0.1 substitutions per site. Minimal length was set at 25 because it was unlikely that an individual element would be this long (with transcription factor binding sites of 5-25 bp, and
miRNAs of about 22 bp), and we intended to analyze the trends only. The distribution of these areas in all fourHox clusters is shown in Figures 1 through 4. As it can be seen from these figures, the layout of these regions was slightly indicative of the concentration at the anterior end of the clusters, and some studies have indeed concluded that the mechanisms of regulation may be considerably different between groups ofHoxgenes, and thatcis-acting elements were more likely to be found in the close proximity of the anterior genes, with posterior ones being regulated in in-creasingly complex and spatially distant ways (Sharpeet al., 1998).
Because it is difficult to see from the figures where these regions were exactly located, we have tabulated their distribution over several distinct genomic domains, includ-ing 5’ regulatory regions, exons, introns, 3’ sequences and intergenic sequences, in Table 1 (counting the long regions) and Table 2 (short outlier regions). As we have mapped the Hoxgenes by the beginnings of their coding sequences, and inHoxthey are always located in the first exon, the imme-diate 5’ area contained the untranslated regions, with the promoter and the associated elements being more distant. Because of the varying sizes of the considered domains (for
Figure 1- Sequence conservation inHoxAcluster. Thick horizontal line
indicates the range which has been analyzed, with position ofHoxAgenes indicated below it (allHoxgenes have two exons). The bars right above the line indicate the positions of larger (50-400 bp) environments con-served at, or below, 0.1 average parsimony level, and the bars above them indicate the positions of shorter (25-100 bp) regions at the same level of conservation.
Figure 2- Sequence conservation inHoxBcluster. Thick horizontal line indicates the range which has been analyzed, with position ofHoxBgenes
indi-cated below it (allHoxgenes have two exons). The bars right above the line indicate the positions of larger (50-400 bp) environments conserved at, or be-low, 0.1 average parsimony level, and the bars above them indicate the positions of shorter (25-100 bp) regions at the same level of conservation.
Figure 3- Sequence conservation inHoxCcluster. Thick horizontal line indicates the range which has been analyzed, with position ofHoxCgenes
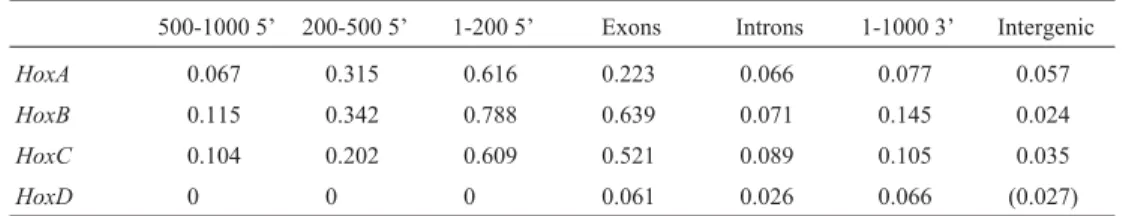
instance, the total length of all exons was much shorter than the intergenic areas), the absolute high conservation region counts were not very informative, so we have also mea-sured the percentage of the columns contained in the re-gions with the mean less than 0.1, and shown the results in Table 3. Alternatively, we could count just the percentage of individual high scoring columns – this approach would likely yield similar results, but it could be swayed by the noise created by isolated instances.
The layout of these regions was somewhat surprising. It showed the highest density not in gene exons, as
antici-pated, but at their immediate 5’ loci, normally containing the UTRs. This phenomenon has occasionally been noted by other studies, too, such as in casein gene clusters (Rijnkelset al., 2003). The conservation density drops as one moves away from the genes, however the fact that the density has been measured over regions of minimal length 25 makes this observation somewhat puzzling. One can ar-gue that some of these regions actually represent clusters of regulatory elements, since not every included column is re-quired to maintain the same high conservation rate, but the overall conservation may still be too good for such sce-nario. It may also be that some are important for post-transcriptional regulation, and targets for micro-RNAs, known to be involved in directingHoxexpression (Cobb and Duboule, 2004). However, from the substantial block conservation of the 5’ UTRs and promoter regions one is indeed tempted to hypothesize that some yet unknown mechanism protects these entire areas from mutations, im-posing a much wider constraint on the sequence than just on the functional elements.
Unexpectedly, no regions of high overall conserva-tion have been found in the small part of theHoxDcluster we have analyzed. Further inspection has shown that both
Figure 4- Sequence conservation inHoxDcluster. Thick horizontal line
indicates the range which has been analyzed, with position ofHoxDgenes indicated below it (allHoxgenes have two exons). The bars right above the line indicate the positions of larger (50-400 bp) environments con-served at, or below, 0.1 average parsimony level, and the bars above them indicate the positions of shorter (25-100 bp) regions at the same level of conservation.
Table 1- Number of long regions of average conservation of 0.1 substitution per site, or better, falling into each distinct genomic domain. The intergenic
domain number forHoxDhas been parenthesized because of the earlier Ensembl gene prediction at the location where many of the conserved regions have been found.
500-1000 5’ 200-500 5’ 1-200 5’ Exons Introns 1-1000 3’ Intergenic
HoxA 2 1 1 2 0 1 4
HoxB 1 2 5 9 0 1 10
HoxC 1 2 4 7 4 2 8
HoxD 0 0 0 1 0 0 (4)
Table 2- Number of short outlier regions of average conservation of 0.1 substitution per site, or better, falling into each distinct genomic domain. The
intergenic domain number forHoxDhas been parenthesized because of the earlier Ensembl gene prediction at the location where many of the conserved regions have been found.
500-1000 5’ 200-500 5’ 1-200 5’ Exons Introns 1-1000 3’ Intergenic
HoxA 5 10 14 28 10 15 54
HoxB 4 7 7 3 8 14 29
HoxC 3 4 9 8 13 15 51
HoxD 0 0 0 0 2 4 (22)
Table 3- Fractions of the total number of alignment columns in each distinct genomic domain contained in the regions of minimal length 25 bp, with
av-erage conservation rate of 0.1 or better. The intergenic data forHoxDhave been parenthesized because of the Ensembl gene prediction at the location where many of these regions were found.
500-1000 5’ 200-500 5’ 1-200 5’ Exons Introns 1-1000 3’ Intergenic
HoxA 0.067 0.315 0.616 0.223 0.066 0.077 0.057
HoxB 0.115 0.342 0.788 0.639 0.071 0.145 0.024
HoxC 0.104 0.202 0.609 0.521 0.089 0.105 0.035
the exons of these genes and the corresponding 5’ se-quences were indeed conserved, although not at the strin-gent 0.1 substitution average level. More puzzling was the concentration of high conservation sites in what we initially considered an intergenic region, but they almost all lie at or around the site of the Ensembl gene prediction, providing additional evidence of an unusual situation at that locus. However, many highly conserved regions have been found in the intergenic regions of otherHoxclusters, too. Some of them contain functional elements, although it is an open question why they were so long. A part of the explanation may be in the studies which have found miRNA genes withinHoxclusters (Yektaet al., 2004), and in that distal enhancer modules are common in the genome.
Discussion
In this paper we have presented findings which ap-pear to further support an argument that the functional con-straints on DNA sequences may be enforced by a mechanism broader than a simple prohibition of mutations within functional elements, even as no such mechanism has been discovered to date. The overall conservation patterns, both in the background and in the contiguous areas scoring better than the background indicate consistent good conser-vation in sequences upstream of the translation start sites, and often better than within the coding sequences them-selves. In addition, a large number, if not a majority, of both long and short intervals which score better than their local environment do so with high significance.
Although the goal of this work was to identify general trends only, rather than attempt to isolate short blocks and motifs with putative functional roles, our software was also capable of finding small isolated regions when they stood in a contrast with their environment (under a different parametrization scheme, though, permitting for much shorter outlier regions than considered in the rest of this study), as depicted in Figure 5. Here we have looked at the
regions of minimal length five whose cumulative score was exceeding the mean of their environment. As expected, many such regions have been located, and we have again used the Student-ttest to estimate their significance. Rou-ghly half were significant above the 0.99 level, again con-firming the fundamental non-random nature of genomic sequences. Some of these loci were clustering, but there was only an occasional match with experimentally con-firmed functional sites (dataset compiled from the literature by Laura Elnitski, unpublished). As these regions were more likely to stand out only in the areas of poor general conservation, we have not attempted to plot them on a chart similar to these illustrating more global features ofHox(in Figures 1 through 4).
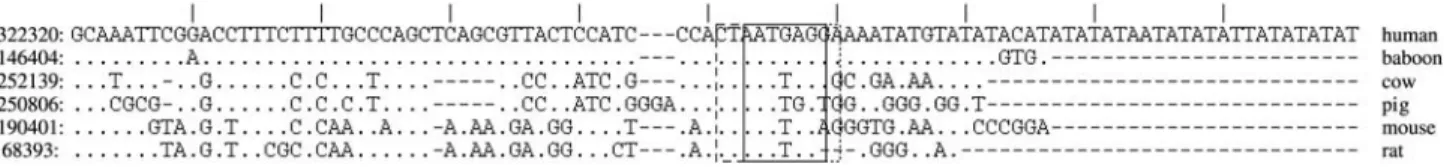
We have also adapted our approach to look for other-wise difficult-to-spot areas where the compared species ap-pear to exhibit different patterns of conservation (differential phylogenetic footprints (Gumucioet al., 1994, Stojanovic, 2004), as illustrated in Figure 6. In this context, we have looked at short areas where sequences within a particular group agreed, but did not feature significant overall conservation between the groups. However, this re-quired more elaborate modifications to the method reported in this manuscript, and will be a subject of another report.
Many other aspects of our methods are still a work in progress. We need to refine our ways of integrating data from different background conservation levels and long and short outlier regions, along with their significance, eliminating as many of the heuristics as it is possible in a genomic context. There are existing programs, such as Multi-PipMaker (Schwartzet al., 2000), or more recent comparative genomics tools developed by the University of California at Santa Cruz Genome Browser team (Karolchik et al.. 2008; Rosenbloomet al.2008) and the efforts of The ENCODE Project Consortium (2007) which perform simi-lar tasks, and usually provide an intuitive graphical repre-sentation, too. However, our approach is original, and it can
Figure 6- A region fromHoxCcluster exhibiting several blocks of good differential conservation, otherwise not obvious within the environment. Solid
and dashed lines indicate different kinds of differential conservation. Dots indicate the same letter as in row 1 (human).
be used in a complementary way with other software. An-other possible extension of this work may involve the replacement of our custom-built alignments with large pre-made assemblies which are being increasingly made publicly available (Milleret al., 2007). However, while no-body disputes the utility of multiple alignments involving sequences from dozens of related species, much smaller ones, such as our six-row construct, can serve well for the identification of overall conservational patterns. Using a very large number of species for this purpose may be an overkill, even if reliable deep pre-made alignments would be available for every genomic region under study.
It may be of interest to further divide the areas in which overall patterns of conservation are recorded to at least separate the exons of the considered genes (first exon as opposed to the rest), and then subdivide the first exon, when feasible, into the UTR and the transcribed part, and even at a finer granularity. The reason for that is in that the ENCODE consortium has reported (The ENCODE Project Consortium. 2007) that sites important for the initiation of transcription appear to be symmetrically distributed around the transcription start site, contrary to what has been previ-ously thought. This may explain some of the exceptionally high conservation we have observed in the 5’ UTR regions, although probably not all of it. However, one always has to keep in mind that these loci are important for many aspects of gene expression other than just the initiation of transcrip-tion, such as elongation and post-transcriptional regulation. We also plan to perform further systematic analysis by varying thresholds for the mean score of the conservation, and analyze the trends. In addition, our treatment of gaps in sequences, while practical, is not satisfactory. The uncritical inclusion of gaps often leads to artifacts, but their exclusion creates problems, too. No matter how uncomfortable they are to work with, gaps in alignments are presumed to reflect the natural process of nucleotide insertion and deletion, and as such they should be fully considered in the analysis.
Acknowledgments
The author would like to thank Dr. Laura Elnitski from the US National Human Genome Research Institute, who has compiled a large data set of experimentally con-firmed functional sites inHox, which we used for cross-comparisons with our findings, and Dr. Ken Dewar from Genome Quebec Innovation Centre at McGill University in Montreal, Canada, who has built the alignments and per-mitted the author to use them in his own work. This effort has been partially supported by US NIH grant 5R03LM009033-02.
References
Ahituv N, Zhu Y, Visel A, Holt A, Afzal V, Pennacchio LA, and Rubin EM (2007) Deletion of ultraconserved elements yields viable mice. PLoS Biol 5:e234.
Bentley JL (1986) Programming Pearls. Addison-Wesley, Read-ing.
Brudno M, Do CB, Cooper GM, Kim MF, Davydov E, Green ED, Sidow A and Batzoglou S (2003) Lagan and Multi-LAGAN: Effcient tools for large-scale multiple alignment of genomic DNA. Genome Res 13:721-731.
Bryne JC, Valen E, Tang MH, Marstrand T, Winther O, da Piedade I, Krogh A, Lenhard B and Sandelin A (2008) JASPAR, the open access database of transcription fac-tor-binding profiles: New content and tools in the 2008 up-date. Nucleic Acids Res 36:D102-D106.
Cobb J and Duboule D (2004) Tracing microRNA patterns in mice. Nat Genet 36:1033-1034.
Duboule D (2000) A hox by any other name. Nature 403:607-610. Duret L and Bucher P (1997) Searching for regulatory elements in
human noncoding sequences. Curr Opin Struct Biol 7:399-406.
Flicek P, Aken B, Beal K, Ballester B, Caccamo M, Chen Y, Clarke L, Coates G, Cunningham F, Cutts T,et al.(2008) Ensembl 2008. Nucleic Acids Res 36:D707-D714. Foronda D, de Navas LF, Garaulet DL and Sanchez-Herrero E
(2008) Function and specificity ofHoxgenes. Int J Dev Biol 52(Epub).
Ganley AR and Kobayashi T (2007) Phylogenetic footprinting to find functional DNA elements. Methods Mol Biol 395:367-380.
Gumucio D, Shelton D, Blanchard-McQuate K, Gray T, Tarle S, Heilstedt-Williamson H, Slightom J, Collins F and Good-man M (1994) Differential phylogenetic footprinting as a means to identify base changes responsible for recruitment of the anthropoidggene to a fetal expression pattern. J Biol Chem 26915371-15380.
Hardison R (2000) Conserved noncoding sequences are reliable guides to regulatory elements. Trends Genet 16:369-372. Horan G, Kovacs E, Behringer R and Featherstone M (1995)
Mu-tations in paralogous Hox genes result in overlapping homeotic transformations of the axial skeleton: Evidence for unique and redundant function. Dev Biol 169:359-372. International Human Genome Sequencing Consortium (2001)
Initial sequencing and analysis of the human genome. Na-ture 409:860-921.
Karolchik D, Kuhn R, Baertsch R, Barber G, Clawson H, Diekhans M, Giardine B, Harte R, Hinrichs A, Hsu F,et al. (2008) The UCSC genome browser database: 2008 update. Nucleic Acids Res 36:D773-D779.
King DC, Taylor J, Zhang Y, Cheng Y, Lawson HA, Martin J, ENCODE groups for Transcriptional Regulation and Multi-species Sequence Analysis, Chiaromonte F, Miller W and Hardison RC (2007) Findingcis-regulatory elements using comparative genomics: Some lessons from ENCODE data. Genome Res 17:775-786.
Li J and Miller W (2002) Significance of inter-species matches when evolutionary rate varies. In: Proceeding of the Sixth Annual International Conference on Computational Biol-ogy, ACM Press, New York, pp 216-224.
Lynch VJ, Roth JJ and Wagner GP (2006) Adaptive evolution of hox-gene homeodomains after cluster duplications. BMC Evol Biol 6:e86.
Margulies E, Vinson J, NISC Comparative Sequencing Program, Miller W, Jaffe D, Lindblad-Toh K, Chang J, Green E, Lander E, Mullikin J,et al.(2005) An initial strategy for the systematic identification of functional elements in the hu-man genome by low-redundancy comparative sequencing. Proc Natl Acad Sci USA 102:4795-4800.
Miller W, Makova K, Nekrutenko A and Hardison RC (2004) Comparative genomics. Annu Rev Genomics Hum Genet 5:15-56.
Miller W, Rosenbloom K, Hardison RC, Hou M, Taylor J, Raney B, Burhans R, King DC, Baertsch R, Blankenberg D,et al. (2007) 28-Way vertebrate alignment and conservation track in the UCSC Genome Browser. Genome Res 17:1797-1808. Mouse Genome Sequencing Consortium (2002) Initial
sequenc-ing and comparative analysis of the mouse genome. Nature 420:520-562.
Rijnkels M, Elnitski L, Miller W and Rosen JM (2003) Multi-species comparative analysis of a mammalian-specific ge-nomic domain encoding secretory proteins. Gege-nomics 82:417-432.
Rosenbloom K, Taylor J, Schaeffer S, Kent J, Haussler D and Miller W (2008) Phylogenomic resources at the UCSC Ge-nome Browser. Methods Mol Biol 422:133-144.
Ruzzo W and Tompa M (1999) A linear time algorithm for finding all maximal scoring subsequences. In: Proceedings of the Seventh International Conference on Intelligent Systems for Molecular Biology, pp 234-241.
Sabarinadh C, Subramanian S, Tripathi A and Mishra RK (2004) Extreme conservation of noncoding DNA near hoxd com-plex of vertebrates. BMC Genomics 5:e75.
Sankoff D and Cedergren R (1983) Simultaneous comparison of three or more sequences related by a tree. In: Sankoff D and Kruskal J (eds) Time Warps, String Edits, and Macromole-cules: The Theory and Practice of Sequence Comparison. Addison-Wesley, Reading, pp 253-264.
Schwartz S, Zhang Z, Frazer K, Smith A, Riemer C, Bouck J, Gibbs R, Hardison R and Miller W (2000) PipMaker - A
web server for aligning two genomic DNA sequences. Ge-nome Res 10:577-586.
Sharpe J, Nonchev S, Gould A, Whiting J and Krumlauf R (1998) Selectivity, sharing and competitive interactions in the regu-lation of Hoxb genes. EMBO J 17:1788-1798.
Stojanovic N, Florea L, Riemer C, Gumucio D, Slightom J, Good-man M, Miller W and Hardison R (1999) Comparison of five methods for finding conserved sequences in multiple align-ments of gene regulatory regions. Nucleic Acids Res 27:3899-3910.
Stojanovic N (2004) Computational methods for the analysis of differential conservation in groups of similar DNA se-quences. Genome Inform 15:21-30.
Stojanovic N (2009) An improved algorithm for the location of heaviest segments in genomic sequences. In: Proceedings of the 2009 International Joint Conferences on System Biol-ogy, Bioinformatics and Intelligent Computing, IJCBS09. The ENCODE Project Consortium (2004) The ENCODE
(ENCy-clopedia Of DNA Elements) Project. Science 306:636-640. The ENCODE Project Consortium (2007) The ENCODE pilot project: Identification and analysis of functional elements in 1% of the human genome. Nature 447:799-816.
Thomas JW, Touchman JW, Blakesley RW, Bouffard GG, Beckstrom-Sternberg SM, Margulies EH, Blanchette M, Siepel AC, Thomas PJ,et al.(2003) Comparative analyses of multi-species sequences from targeted genomic regions. Nature 424:788-793.
Wingender E (2008) TheTRANSFAC project as an example of framework technology that supports the analysis of genomic regulation. Brief Bioinform 9:326-332.
Yekta S, Shih I and Bartel DP (2004) MicroRNA-directed cleav-age of HOXB8 mRNA. Science 304:594-596.
Zody MC (2007) Comparative genomics: Identifying functional elements through conservation. In: Stojanovic N (ed) Com-putational Genomics: Curr Methods, Horizon Bioscience. Norfolk, UK, pp 1-30.
Guest Editor: José Carlos Merino Mombach