The historical biogeography of
Pteroglossus
aracaris (Aves, Piciformes,
Ramphastidae) based on Bayesian analysis of mitochondrial DNA sequences
Sérgio L. Pereira
1and Anita Wajntal
2 1Department of Natural History, Royal Ontario Museum, Toronto, Canada.
2
Departamento de Genética e Biologia Evolutiva, Universidade de São Paulo, São Paulo, SP, Brazil.
Abstract
Most Neotropical birds, includingPteroglossus aracaris, do not have an adequate fossil record to be used as time constraints in molecular dating. Hence, the evolutionary timeframe of the avian biota can only be inferred using alter-native time constraints. We applied a Bayesian relaxed clock approach to propose an alteralter-native interpretation for the historical biogeography ofPteroglossus based on mitochondrial DNA sequences, using different combinations of outgroups and time constraints obtained from outgroup fossils, vicariant barriers and molecular time estimates. The results indicated that outgroup choice has little effect on the Bayesian posterior distribution of divergence times withinPteroglossus, that geological and molecular time constraints seem equally suitable to estimate the Bayesian posterior distribution of divergence times forPteroglossus, and that the fossil record alone overestimates divergence times within the fossil-lacking ingroup. The Bayesian estimates of divergence times suggest that the radiation of Pteroglossus occurred from the Late Miocene to the Pliocene (three times older than estimated by the “standard” mi-tochondrial rate of 2% sequence divergence per million years), likely triggered by Andean uplift, multiple episodes of marine transgressions in South America, and formation of present-day river basins. The time estimates are in agree-ment with other Neotropical taxa with similar geographic distributions.
Key words: Pteroglossus, Ramphastidae, aves, molecular time estimates, biogeography.
Received: November 30, 2007; Accepted: June 3, 2008.
Introduction
Toucans, aracaris and toucanets (Aves, Piciformes, Ramphastidae) are a group of Neotropical birds easily rec-ognized by their colorful bills that are light and several times bigger than their head, bright-colored feathers and long tails sometime making up half of the body length. Tra-ditionally, six genera have been recognized in the family (Short and Horne, 2001), but molecular sequence analyses (Eberhard and Bermingham, 2005; Kimuraet al., 2004) re-vealed that the saffron aracari in the monotypic genus
Baillonius is embedded within Pteroglossus aracaris. Aracaris are medium-sized toucans, predominantly green above and yellow below, with a red rump and usually yel-low, red or black-red ventral bands or spots; the saffron aracari, on the other hand, has a distinct yellow-green plumage, red and green bill, and red periophtalmic region (Short and Horne, 2001). The molecular finding is sup-ported by vocalization (Haffer, 1974; Short and Horne, 2001) and anatomical characters (Hofling, 2004; Pires, 2008; Sick, 1997), leading the South American Classifica-tion Committee of the American Ornithologists’ Union and
the Brazilian Committee for Ornithological Records (Co-missão Brasileira de Registros Ornitológicos) to merge
BailloniusintoPteroglossus.
Considerable attention has been given to understand the tempo and mode of diversification of Ramphastidae. Haffer (1974) proposed that the generic radiation within Ramphastidae occurred in the Pleistocene and was influ-enced by alleged changes in forest distribution in tropical America due to glacial cycles of the Pleistocene. However, he later reformulated his hypothesis, suggesting that these vegetational changes may have also occurred prior to the Pleistocene (reviewed in Haffer, 1997). Nahum et al.
(2003) estimated that genus diversification within Ramphastidae occurred from about 47 million years ago (Mya) in the Middle Eocene to about 9.5 Mya in the Late Miocene, based on partial sequences of the mitochondrial cytochrome (cyt)band the ribosomal small subunit (12S rDNA) genes of one species of each genus. Eberhard and Bermingham (2005) obtained cytb, ATPase subunits 8 and 6 (ATPase8/6) and cytochrome oxidase subunit I (COI) se-quences for all but one species ofPteroglossusand esti-mated that the radiation within Pteroglossus initiated around 3 Mya in the Late Pliocene, and only few diver-gences occurred into the Pleistocene.
Send correspondence to Sergio L. Pereira. Department of Natural History, Royal Ontario Museum, 100 Queen’s Park, M5S 2C6 To-ronto, ON, Canada. E-mail: [email protected].
Considering Baillonius bailloni as Pteroglossus bailloni(Kimuraet al., 2004), this species is part of the
viridis superspecies group (sensu Haffer, 1974), and the split ofviridis from the other superspecies groups is the only common node in Nahumet al.(2003) and Eberhard and Bermingham (2005). Eberhard and Bermingham (2005) estimated that theviridisgroup separated from other groups ofPteroglossusaround 3 Mya, which is three times younger than the age proposed by Nahum et al. (2003). These differences can be explained in light of different cali-bration approaches taken in both studies. Nahum et al.
(2003) applied a strict molecular clock, excluding taxa that evolved at a significantly higher or lower rate than the aver-age, and calibrated the clock assuming the split between Galliformes and Piciformes to have occurred 100 Mya (Nahumet al., 2003). Given the lack of fossil or other rea-sonable molecular calibration data for the Ramphastidae, Eberhard and Bermingham (2005) applied the “standard” avian mitochondrial molecular clock rate of 2% sequence divergence per million years (Myr) (Shields and Wilson, 1987) to estimate divergence times for major nodes within
Pteroglossus, based on uncorrected genetic distances. Pereira and Baker (2006) demonstrated that avian rates of evolution are very heterogeneous across genes and across taxa and, in general, lower than the “standard” mo-lecular clock rate. They also revisited the calibration point used to derive the “standard” avian molecular clock (Shields and Wilson, 1987) and concluded that the original calibration point was underestimated by 9.5 Myr. Hence, the application of the “standard” molecular clock in birds, includingPteroglossus, underestimates divergence times. It is therefore crucial that those estimates based on the “standard” molecular clock be revised.
We estimated divergence times amongPteroglossus
by applying a Bayesian relaxed clock approach (Thorne and Kishino, 2002; Thorneet al., 1998) to a data set of mi-tochondrial DNA sequences. Because noPteroglossusare known in the fossil record, we used non-Ramphastid fos-sils, as well as geological events assumed to have been an effective barrier leading to speciation among Neotropical taxa, and molecular divergence times obtained for other birds as time constraints. We also tested whether different types of time constraints were conflicting with each other, and whether using more distant outgroups and older time constraints would lead to overestimating divergence times within Pteroglossus. This study shows that speciation in
Pteroglossusoccurred in a temporal framework compara-ble to that of many Neotropical vertebrates with similar geographic distribution.
Material and Methods
Reanalysis of available DNA sequences
The following Pteroglossus DNA sequences for ATPase8/6, COI and cytb were retrieved from GenBank
and used in the present study: AY661304, AY661305, AY661307, AY661309, AY661312, AY661313, AY661316, AY661318, AY661321, AY661323, AY661326, AY661328, AY661330, AY661332, AY661336, AY661267, AY661268, AY661270, AY661272, AY661275, AY661276, AY661279, AY661281, AY661284, AY661286, AY661289, AY661291, AY661293, AY661295, AY661299, AY661339, AY661340, AY661342, AY661344, AY661346, AY661347, AY661350, AY661352, AY661355, AY661357, AY661360, AY661362, AY661364, AY661366, AY661370, AY661373, AY661374, AY661375, AY661376, AY661377, AY661378, AY661379, AY661380, AY661381, AY661382, AY661383, AY661384, AY661385, AY661386, AY661387. Similarly, we retrieved DNA se-quences from GenBank for other Ramphastidae and Piciformes (EU604306, AY959801, AF100555, AY661337, AY661300, AY661371, AY661372, EU604307, AY897017, AF123525, NC_008546), Coracii-formes (AF441612, AF441590, U89183), PasseriCoracii-formes (AY325307, NC_002069, NC_007883), and more distant taxa (Anseriformes and Galliformes [Galloanserae] -EF373438, AY140729, AY140735, AY143688, AF165498, AF165474, AY143682, AF165492, AF165468, AY141905, AY141915, AY141925, AY141902, AY141912, AY141922), to cover the same gene regions sampled forPteroglossus. The choice of non-Ramphastid taxa was based on their potential utility for im-posing time constraints in the dating analyses as described below. The inclusion of Coraciiformes and Passeriformes was also based on the possible close relationships of these two groups and Piciformes, as suggested by molecular and morphological cladistic analyses (Ericson et al., 2006; Gibbet al., 2007; Livezey and Zusi, 2007). The final align-ment was 2,158 base pairs (bp) long.
Data partition, model selection, and phylogenetic inference
equally likely. We rooted the tree with Rhea americana
(GenBank accession number NC_000846). We used the following priors to all partitions: unconstrained: exponen-tial (10.0) for branch lengths, flat Dirichlet (1,1,1,1) for sta-tionary base frequencies, flat Dirichlet (1,1,1,1,1,1) for the nucleotide substitution ratio, uniform distribution (0,200) for the shape parameter of the gamma distribution of rate variation, and uniform distribution (0,1) for the proportion of invariable sites. MCMC samples were taken every 1000thcycle. We considered that runs had reached conver-gence when the average standard deviation of the split fre-quencies between both simultaneous runs was smaller than 0.01. We also plotted the log likelihood of sampled topolo-gies against Markov chain cycles to determine the burnin period in which the MCMC chain had reached a stationary status. Post-burnin samples from both simultaneous, inde-pendent runs were used to construct a 50% majority rule consensus tree. We considered nodes receiving≥0.95 pos-terior probability scores to be strongly supported. To ensure that inclusion of very distant outgroups needed to calibrate the relaxed molecular clock would not influence the rela-tionships withinPteroglossus, a second analysis of phylo-genetic inference using Ramphastidae taxa only and root-ing the tree with Capito was performed, using similar conditions as described above.
Testing alternative tree topologies
To evaluate the tree topologies obtained by Bayesian inference in MrBayes and a tree in which Pteroglossus bailloniwas forced to be a separate sister genus (following the classical systematics of the group), we applied the approximately unbiased (AU) test (Shimodaira, 2002) as implemented in the program CONSEL version 0.1f (Shi-modaira and Hasegawa, 2001). The AU test uses a multi-scale bootstrap technique and site log-likelihoods when computing p-values for the topologies being tested. In con-trast to tests that are more conservative, the multiscale boot-strap technique removes the bias of including more trees in the confident set as the number of trees being tested in-creases. The distribution of posterior probabilities for each alternative topology is obtained by counting the number of times the hypothesis is supported by the replicates.
Molecular dating
Estimates of the Bayesian posterior distribution of di-vergence times were performed using the Multidivtime package (Thorne and Kishino, 2002; Thorneet al., 1998), which assumes a stochastic model of change in rates of DNA substitution over time. For each data partition, branch lengths and variance-covariance matrices were estimated in the program Estbranches (part of the Multidivtime pack-age), based on maximum likelihood estimates of the transi-tion/transversion ratio, nucleotide frequencies and gam-ma-distributed rates of substitution previously obtained for the Bayesian tree topology under the F84 + Γ model of
DNA substitution in PAML 3.14 (Yang, 1997). This is the most complex model of DNA substitution that can be used with Multidivtime.
Three distinct sets of analyses were performed in-cluding allPteroglossusandCapito species, varying the outgroup and the non-Ramphastidae taxa used. For taxon set 1, other Piciformes and Passeriformes were used as outgroups, and the tree was rooted with Coraciiformes; taxon set 2 included all taxa as in the taxon set 1 plus Galloanserae as the most distant outgroups and rooting the tree with Rhea americana; and finally, in taxon set 3, Galloanserae was the only outgroup to Ramphastidae, and the tree was rooted with Rhea americana. Because the method requires an outgroup to root the tree and imposes that the rate of change in the DNA substitution rate at the root node is the same at the beginning and at the end of that branch (Thorneet al., 1998), the taxon used to root the tree is not included in the final Bayesian posterior estimates of divergence times and rates of DNA substitution.
Temporal constraints in molecular dating. Unfortu-nately, there is no known fossil ofPteroglossusor other Ramphastid that could be used to set a minimum age for this genus. Hence, we could only set time constraints based on fossil data available for outgroups, geological events as-sumed to have been a vicariant barrier for other avian and non-avian groups with similar geographic distribution as
Pteroglossus, or molecular time estimates derived from other studies. For time constraints based on the fossil re-cord, we imposed a minimum age of 30 Mya for the separa-tion of Picidae (Dryocopus) and Ramphastidae (Pteroglossus) (F1 in Figure 1) for taxon sets 1 and 2, based onRupelramphastoides knopfi(Mayr, 2005), and the split between Anseriformes and Galliformes (taxon sets 2 and 3; F2 in Figure 1) at 65 Mya, based on anseriformVegavis iaai
(Clarkeet al., 2005). For the geological time constraints in all taxon sets, we assumed that clades containing sister taxa with cis- and trans-Andean distribution (G1 in Figure 1) likely split when the northern end of the Cordillera of the Andes rose to present-day altitudes in the last 13 to 2 Mya (Gregory-Wodzicki, 2000; Lundberget al., 1998). Many studies have suggested that this geological event is a major vicariant barrier that led to the speciation of many groups of vertebrates with similar geographic distribution in Central and South America (see Results and Discussion). For taxon sets 1 and 2, we also used the minimum age of 82 Mya for the split between the New Zealand wrenAcanthisittafrom other Passeriformes (Ericsonet al., 2006) (G2 in Figure 1), assuming that the former was isolated when New Zealand broke off and drifted away from Australia around 82-85 Mya. For taxon set 3, we also imposed molecular time con-straints, based on published time estimates. We fixed the separation of Galloanserae (Anhima, Penelope andCrax) from Ramphastidae at 122.2 Mya (M1 in Figure 1) and the separation between Anseriformes and Galliformes (M2 in Figure 1) at 105 Mya (Pereira and Baker, 2006). We also constrained divergence times in Galliformes to lie within the 95% confidence interval of the time estimates of Pereira and Baker (2004). In this case, we set the separation be-tweenCrax blumenbachiiandC. daubentoni(M3 in Fig-ure 1) to a minimum of 5.0 and a maximum of 7.6 Mya and the split between those two species andC. rubrabetween 5.4 and 8.2 Mya (M4 in Figure 1), for which the uplift of the northern Andes is the major vicariant event that led to their diversification. Similarly, we set theCrax–Penelopesplit (M5 in Figure 1) at 26.9-40.6 Mya (Pereiraet al., 2002), and the divergence time betweenAndigenaandSelenidera
(M6 in Figure 1) to lie within the standard deviation esti-mated by Nahumet al. (2003),i.e., 23.9-31.7 Mya. The aforementioned time constraints were used in combination or separately for each taxon set described above, if the ap-propriate node to be constrained was included in that taxon set. We also performed two additional analyses for taxon set 3, one using molecular time constraints only, and the other geological time constraints only. The Bayesian dating
method seems to be robust to variation in time constraint, because much of the temporal information should be ex-tracted from the sequence data (Pereira and Baker, 2006). A comparison among these multiple analyses using different sets of time constraints and outgroups allowed us to evalu-ate the influence of types of time constraints and choice of outgroups in the Bayesian posterior distribution of diver-gence times amongPteroglossus.
Results and Discussion
Molecular phylogenetics and systematics of Pteroglossus
The best-fitting models of DNA substitution were the GTR for ATPase8/6 and COI, and HKY for cytb. All gene partitions also required a proportion of invariable sites and
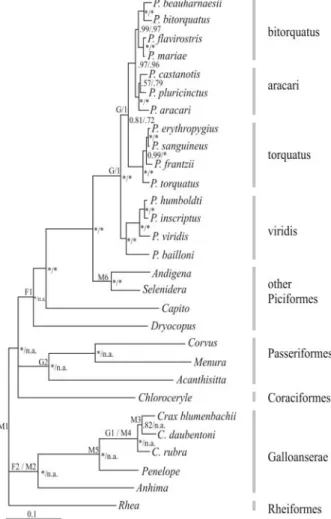
Figure 1- Multigene Bayesian consensus topology. Posterior probabili-ties for the analysis including all taxa or excluding Coraciiformes, Passeriformes and non-Ramphastid Piciformes are shown to the left and right of the slash, respectively. Posterior probabilities are indicated by * when 1.0. When taxa were not included in the analysis, posterior probabil-ities are indicated as not applicable (n.a.). Placement of fossil (F), geologi-cal (G) and molecular (M) time constraints are indicated by letters to the left of nodes and described in Methods. Grey bars to the right indicate
gamma-distributed rate variation across sites. The AIC weights, which measure the uncertainty in model selection, were 1.0, 0.95 and 0.89 for ATPase8/6, COI and cytb, re-spectively. These results suggest none to very little uncer-tainty in model selection. After seven million cycles, the split frequency between both simultaneous MCMC runs was 0.002. Assuming a conservative burnin period of 501 trees, our results indicated that all parameters reached con-vergence between both runs. The Bayesian consensus tree obtained from 6720 post-burnin trees revealed four major clades ofPteroglossus, based on clade age and allopatric distribution of a clade’s members (Figure 1): (1) viridis
group – P. bailloni, P. viridis, P. inscriptus and P.
humboldti; (2)torquatusgroup –P. torquatus,P. frantzii,
P. sanguineus, andP. erythropygius; (3)aracarigroup –P. aracari, P. pluricinctus and P. castanotis; and (4)
bitorquatusgroup –P. bitorquatus,P. beauharnaesii,P. flavirostris and P. mariae. Tree topology of the
Pteroglossusclade was identical when Ramphastid taxa only were included in the analysis andCapitowas used to root the tree and more distant outgroups were excluded from the analysis (Figure 1). Bayesian posterior probabili-ties were similar and very high for the majority of nodes, except that the support for the sister relationship betweenP. castanotisandP. plurinctusincreased with the exclusion of non-Ramphastid outgroups. The phylogenetic relation-ships recovered in both Bayesian analyses performed by us were identical to those reported and discussed in an earlier study (Eberhard and Bermingham, 2005); hence, the phylo-genetic and taxonomic implications will not be repeated here. However, we noted that our analyses recovered nodes with higher posterior probabilities across the tree compared to those in Eberhard and Bermingham (2005), including the association of the saffron toucanetPteroglossus bailloni
with the viridis group (1.0 versus 0.68). The higher poste-rior probability observed in our study may be the result of running the Markov chain for more cycles and assuming a more realistic model in which genes havea priori heteroge-neous rates of DNA evolution (e.g., Pereira and Baker 2006). The phylogenetic hypothesis recovered here and by Eberhard and Bermingham (2005) differs from that of Kimuraet al. (2004) because the latter had limited taxon and character sampling, yielding overall lower tree resolu-tion and node support (Huelsenbecket al., 1996; Pereiraet al., 2002).
All of the 90 alternative topologies within the 95% credible set of trees sampled showed the saffron toucanetP. baillonias a member of thePteroglossus viridisgroup and not as a sister lineage to all otherPteroglossus. To further assess the placement of the saffron toucanet, we also ap-plied a topological test to evaluate whether the differences seen between our consensus topology and a topology where the saffron toucanet is forced to be a separate sister lineage to all otherPteroglossusgroups is statistically significant. The AU test failed to exclude both topologies from the 95%
confidence set; it indicated, however, that the consensus to-pology obtained here is more likely to represent their phylogenetic relationships (p = 0.916) than the one forcing the saffron toucanet to be a sister genus toPteroglossus
(p = 0.084). In other words, in 91.6% of the replicates per-formed by the AU test, the saffron toucanet is embedded withinPteroglossus. Thus, the results reinforce the renam-ing ofBaillonius bailloniasPteroglossus bailloni, follow-ing molecular (Kimuraet al., 2004), vocalization (Haffer, 1974; Short and Horne, 2001), and anatomical data (Hofling, 2004; Pires, 2008; Sick, 1997).
Rates of evolution and divergence times among Pteroglossus
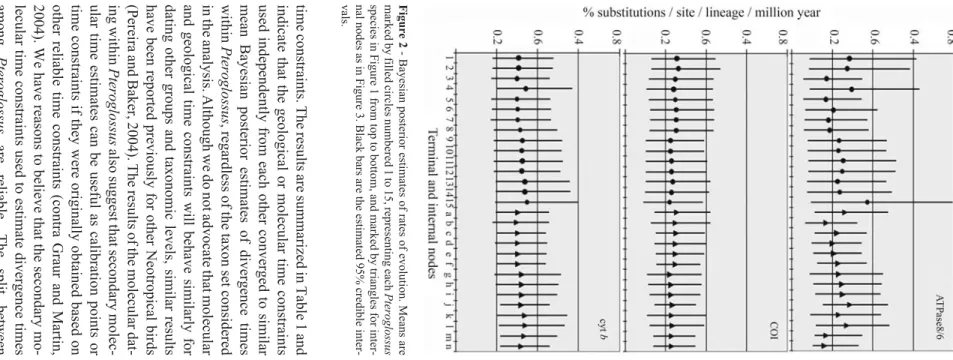
We approximated the posterior distribution of rates of evolution using a Bayesian approach that takes into account uncertainties in branch lengths and time constraints (Thorne and Kishino, 2002; Thorneet al., 1998). The pos-terior rates of evolution for ATPase 8/6, COI and cytbwere on average 0.23, 0.24 and 0.32% substitutions per site per lineage per million years (s/s/l/Myr), respectively. These rates are largely variable across time and taxa, especially for the ATPase 8/6 (Figure 2). These figures and the varia-tion observed are in agreement with Bayesian estimates (Pereira and Baker, 2006) showing that all mitochondrial genes evolve at a slower pace than 1.0% s/s/l/Myr (or 2% sequence divergence per million year) assumed by the “standard” mitochondrial molecular clock hypothesis (Brownet al., 1979; Shields and Wilson, 1987; Wilsonet al., 1985). Therefore, the use of the “standard” mitochon-drial molecular clock (Eberhard and Bermingham, 2005) to estimate divergence times within Pteroglossus is inade-quate.
The Bayesian posterior distribution of divergence times forPteroglossuswas obtained using three taxon sets differing in the composition of non-Ramphastidae taxa in-cluded. Also, we imposed time constraints based on the fos-sil record, geological events assumed to have been vicariant barriers leading to cladogenesis within Neotropical taxa, and molecular time estimates obtained from multiple genes and time constraints. The results of these analyses indicated that outgroup sampling has little influence on the Bayesian posterior distribution of divergence times among
Pteroglossuswhen a variety of time constraints are used in combination (Table 1). For example, the mean posterior distribution of node ages derived from taxon set 1 that in-cluded a Piciformes plus three Passeriformes did not differ more than 0.5 Myr from the mean posterior distribution de-rived from taxon set 3 that had only Galloanserae as non-Ramphastidae outgroups. The size and distribution of the posterior 95% credible interval were very similar among the analyses of the three different taxon sets (Table 1).
The results are summarized in Table 1 and that the geological or molecular time constraints independently from each other converged to similar Bayesian posterior estimates of divergence times Pteroglossus , regardless of the taxon set considered analysis. Although we do not advocate that molecular time constraints will behave similarly for other groups and taxonomic levels, similar results been reported previously for other Neotropical birds and Baker, 2004). The results of the molecular dat -Pteroglossus also suggest that secondary molec -estimates can be useful as calibration points or constraints if they were originally obtained based on reliable time constraints (contra Graur and Martin, We have reasons to believe that the secondary mo -time constraints used to estimate divergence times Pteroglossus are reliable. The split between and the remaining birds set at 122 Mya was from a mitogenomic Bayesian approach that used and Wajntal 969 2 -Bayesian posterior estimates of rates of evolution. Means are by filled circles numbered 1 to 15, representing each Pteroglossus in Figure 1 from top to bottom, and marked by triangles for inter -as in Figure 3. Black bars are the estimated 95% credible inter
-Table 1- Bayesian posterior estimates of divergence times amongPteroglossus. Mean, standard deviation (SD) and 95% credible intervals (95% CrI, in brackets) are given in million years for each taxon set ana-lyzed and correspond to estimates using all geological, fossil and molecular time constraints (unless specified) applicable for that taxon set. Node labels as in Figure 3.
Node labels Taxon set 1 Taxon set 2 Taxon set 3 Taxon set 3 (molecular only) Taxon set 3 (geological only) Taxon set 1 (fossil only) Taxon set 3 (fossil only)
A 2.9±0.6 (1.7, 4.2) 2.9±0.7 (1.6, 4.5) 3.0±0.8 (1.7, 4.7) 2.6±0.6 (1.5,4.0) 3.0±0.7 (1.7, 4.6) 6.6±2.3 (3.1, 12.0) 7.7±2.9 (3.4, 14.8)
b 1.0±0.4 (0.3, 1.8) 1.2±0.5 (0.3, 2.2) 1.1±0.5 (0.3, 2.1) 0.9±0.4 (0.2, 1.8) 1.1±0.5 (0.3, 2.1) 2.4±1.2 (0.7, 5.2) 3.2±1.7 (0.8, 7.5)
C 4.1±0.7 (2.8, 5.6) 4.4±0.9 (2.8, 6.2) 4.6±0.9 (2.9, 6.5) 3.9±0.8 (2.5, 5.5) 4.6±0.9 (2.9, 6.5) 9.8±3.3 (4.9, 17.5) 11.8±4.0 (5.8, 21.5)
d 3.2±0.6 (2.0, 4.5) 3.4±0.8 (2.0, 5.1) 3.6±0.8 (2.2, 5.3) 3.0±0.7 (1.8, 4.5) 3.5±0.8 (2.1, 5.2) 7.5±2.7 (3.7, 13.9) 9.3±3.5 (4.4, 17.8)
E 4.0±0.7 (2.8, 5.6) 4.2±0.9 (2.7, 6.1) 4.6±0.9 (2.9, 6.5) 3.9±0.8 (2.5, 5.5) 4.6±0.9 (2.9, 6.4) 9.6±3.2 (4.8, 17.2) 11.7±4.1 (5.7, 21.8)
F 5.6±0.8 (4.1, 7.4) 5.7±1.0 (3.9, 7.9) 6.1±1.0 (4.2, 8.2) 5.2±0.9 (3.6, 7.0) 6.1±1.0 (4.1, 8.2) 13.2±4.2 (7.0, 23.1) 15.6±5.1 (8.0, 27.9)
g 0.8±0.4 (0.1, 1.6) 0.9±0.5 (0.1, 2.0) 0.9±0.5 (0.1, 2.0) 0.8±0.4 (0.1, 1.7) 0.9±0.5 (0.1, 2.0) 1.8±1.0 (0.3, 4.3) 2.7±1.7 (0.3, 6.9)
h 2.1±0.5 (1.2, 3.2) 2.4±0.7 (1.2, 3.9) 2.3±0.6 (1.2, 3.6) 1.9±0.5 (1.0, 3.1) 2.3±0.7 (1.2, 3.7) 4.9±1.9 (2.2, 9.4) 6.7±2.8 (2.7, 13.5)
I 3.2±0.6 (2.1, 4.6) 3.4±0.8 (2.0, 5.2) 3.3±0.8 (2.0, 5.0) 2.8±0.7 (1.7, 4.3) 3.3±0.8 (1.9, 5.1) 7.2±2.5 (3.7, 13.2) 9.3±3.5 (4.2, 18.0)
J 9.8±1 .1 (7.7, 11.9) 9.5±1.2 (7.1, 11.9) 9.9±1.2 (7.3, 12.1) 8.4±1.0 (6.4, 10.3) 9.8±1.3 (7.3, 12.2) 22.4±6.2 (12.7, 36.6) 26.3±7.6 (14.5, 44.0)
K 1.5±0.5 (0.7, 2.5) 1.7±0.6 (0.6, 2.9) 1.6±0.6 (0.6, 2.8) 1.4±0.5 (0.5, 2.4) 1.6±0.6 (0.6, 2.8) 3.3±1.4 (1.3, 6.7) 4.6±2.2 (1.4, 9.7)
L 3.8±0.8 (2.4, 5.4) 4.2±1.0 (2.4, 6.3) 4.1±1.0 (2.4, 6.2) 3.5±0.8 (2.1, 5.2) 4.1±1.0 (2.4, 6.1) 8.4±2.8 (4.3, 15.2) 12.1±4.3 (5.7, 22.3)
m 10.1±1.2 (7.7, 12.3) 10.0±1.3 (7.3, 12.4) 10.0±1.3 (7.2, 12.3) 8.5±1.1 (6.2, 10.5) 9.9±1.3 (7.1, 12.3) 21.7±5.8 (12.7, 35.2) 28.2±7.9 (15.5, 46.3)
five avian and seven non-avian fossils spread throughout the tree (Pereira and Baker, 2006). The same estimate was obtained when only four fossils included in the 95% credi-ble interval were used (Pereira and Baker, 2006), or when only the eight fossils that fall outside the 95% credible in-terval were used (SLP, unpublished). Additionally, the mo-lecular time constraints imposed among curassows were independently derived from geological and secondary mo-lecular constraints (Pereira and Baker, 2004).
Conversely, the Bayesian posterior distribution of di-vergence times derived from the use of fossil constraints alone resulted in much older dates for all nodes within
Pteroglossus, especially when Galloanserae was included in the analysis (Table 1). This finding is not surprising be-cause the fossils used as minimum age constraints represent much deeper divergences (i.e., split between Ramphastidae and Picidae and between Anseriformes and Galliformes) than those expected forPteroglossus.
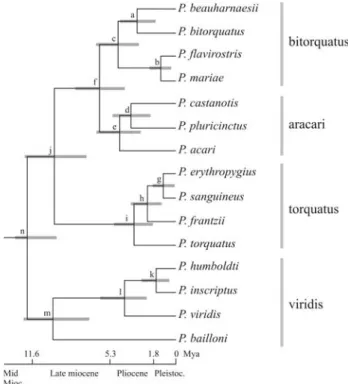
Taken together, the above results indicate that the combination of different types of time constraints reduces the effects of overestimating divergence times caused by the use of much deeper fossil constraints. Hereafter, we will consider the estimates from the molecular set of time con-straints and most inclusive taxon sampling as the best estimates for the divergence times among Pteroglossus
(Figure 3).
A biogeographic hypothesis for the evolution of Pteroglossus
Our Bayesian posterior estimates of divergence times (Table 1) are about three times older than those of Eberhard and Bermingham (2005) and place the beginning of the ra-diation withinPteroglossusinto the Late Miocene instead of the Late Pliocene (Figure 3). Also, the Bayesian poste-rior estimates of divergence times rule out a major influ-ence of the Pleistocenic glaciation – interglaciation cycles in the speciation of this group, as previously suggested (Eberhard and Bermingham, 2005; Haffer, 1974).
The 95% credible intervals (CI) of the Bayesian pos-terior estimates of divergence times (Table 1; Figure 3) and the allopatric distribution of species within the same subclades can be combined to suggest a biogeographic hy-pothesis for the radiation ofPteroglossus, based on major geological and physiographic paleoevents that occurred since the Miocene. For example, the initial cladogenic events amongPteroglossusthat took place around 11 and 8 Mya (based on the 95% CI) coincide with extensive marine transgression into low-lying areas of South America, in the present-day La Plata, Paraná, Orinoco and Amazon River basins (Lundberget al., 1998). Also, a major upheaval of the Cordillera of the Andes occurred about 12.9 and 11.5 Mya, as suggested by sedimentological and paleomagne-tical data (Hoorn, 1994), reaching about half of its mod-ern-day elevations (Gregory-Wodzicki, 2000) and creating a continuous mountain range in the northern region of
South America (Hoorn, 1994). The northern uplift influenced the flow patterns of paleobasins and created paleolakes before the current drainage system was estab-lished (Hoorn, 1994; Lundberg et al., 1998). These paleoevents likely fragmented the Neotropical forest, iso-lating the ancestors of theviridisgroup in the highlands of the Brazilian and Guiana Shields, and the ancestors of the
torquatusandaracari/bitorquatusgroups on opposite sides of the Andes. Although P. bailloni is isolated nowadays from other members of theviridis group by the Brazilian savanna biome, palynological data do not indicate the pres-ence of savanna-like vegetation prior to the Late Miocene (Hoorn, 1994). Therefore, this species is likely to represent an ancient stock that became isolated in the current Atlantic Forest due to an extensive marine transgression in the La Plata and Paraná River basins in the Mid to Late Miocene and failed to adapt and invade the Brazilian savanna that developed between the Amazon and the Atlantic Forests during the Miocene (Lundberget al., 1998; Penningtonet al., 2004).
Theviridis,aracariandbitorquatusgroups are sym-patric with each other in most of their Amazonian distribu-tion, but species within groups tend to exhibit allopatric distributions.Pteroglossus viridisandP. aracariare found in the Guiana Shields, on the north bank of the Amazon River, while their respective sister groups are found on the south bank of the Amazon River (P. inscriptus and P. humboldti) and in western Amazonia (P. castanotisandP. Figure 3 - Chronogram and phylogenetic relationships among
pluricinctus). The estimated divergence time for this spe-cies group between 5 and 2 Mya falls within a period of time after which the Amazon River basin had very much es-tablished its present-day easterly flow towards the Atlantic Ocean (Lundberget al., 1998), major orogenic transforma-tion brings the Andes to present-day elevatransforma-tions (Greg-ory-Wodzicki, 2000; Hooghiemstra and Van der Hammen, 1998), and a Pliocene sea rise of about 100 meters higher than present-day level causes a marine transgression around 5 Mya that lasts about 800,000 years (Haqet al., 1987). These same paleoevents are likely to have influ-enced the split between P. beauharnaesii/P. bitorquatus
andP. flavirostris/P. mariae. However,P.beauharnaesiiis the only species to exhibit sympatric distribution with the three other species of its group. This suggests that ecologi-cal and/or other biologiecologi-cal factors likely played a major role in the speciation of thebitorquatusgroup.
Thetorquatusgroup has an exclusively trans-Andean distribution. Their present distributional range includes ar-eas of endemism in the Pacific lowlands and Isthmus of Panama that coincide with areas of endemism presumed to have been isolated during the marine transgressions of the Pliocene and Pleistocene (Nores, 2004). For example, the split ofP.torquatus, followed byP. frantzii, from the an-cestors ofP. erythopygius/P. sanguineusbetween 4.3 and 1.0 Mya is bracketed by the closing of the Isthmus of Pan-ama (Lundberget al., 1998) and the 5-Mya Pliocene sea level rise (Klammer, 1984). The split between P. erythopygiusandP. sanguineusbetween 0.1 and 1.7 Mya is our only estimate that coincides with Pleistocene glacial-interglacial periods. However, the specific status of these two taxa has yet to be genetically determined by sampling specimens throughout their range of distribution, as some authors consider them to be subspecies of P. torquatus
(Short and Horne, 2001).
The above geological events we put forward as major vicariant forces driving the speciation amongPteroglossus
aracaris are likely to have influenced the evolution of the Neotropical biota with comparable geographic distribution in tropical America (Bush, 1994; Nores, 1999, 2004; Wesselingh and Salo, 2006). Similar patterns of temporal divergence have been independently suggested from mo-lecular data for a growing number of congeneric species, including curassows and piping-guans (Grauet al., 2005; Pereira and Baker, 2004), parrots (Ribaset al., 2007), tro-gons (Moyle, 2005), monkeys (Collins and Dubach, 2001; Cortes-Ortiz et al., 2003), vesper mice and spiny rats (Galewskiet al., 2005; Salazar-Bravo et al., 2001), bats (Lim, 2007; Stadelmannet al., 2007), catfishes (Montoya-Burgos, 2003), and geckos (Gambleet al., 2008). Instead of applying the “standard” molecular clock, the present study and those cited above independently relied on fossil, geo-logical or a reasonable molecular time constraints to esti-mate the age of diversification within those groups of vertebrates. By comparing the spatial and temporal patterns
of radiation of multiple Neotropical groups under an integrated approach among phylogenetics, geology and paleoecology (Bush, 1994), we start to unfold the intricate biological and physical aspects that shaped the biodiversity of the Neotropics as we currently understand it.
Acknowledgments
Financial support was provided by the following Bra-zilian agencies: Fundação de Amparo à Pesquisa do Estado de São Paulo (FAPESP), Conselho Nacional de Desenvol-vimento Científico e Tecnológico (CNPq) and Coorde-nação de Aperfeiçoamento de Pessoal de Nível Superior (CAPES). Valuable suggestions by one of the anonymous reviewers were incorporated.
References
Brown WM, George Jr M and Wilson AC (1979) Rapid evolution of animal mitochondrial DNA. Proc Natl Acad Sci USA 76:1967-1971.
Bush MB (1994) Amazonian speciation: A necessarily complex model. J Biogeogr 21:5-17.
Clarke JA, Tambussi CP, Noriega JI, Erickson GM and Ketcham RA (2005) Definitive fossil evidence for the extant avian ra-diation in the Cretaceous. Nature 433:305-308.
Collins AC and Dubach JM (2001) Nuclear DNA variation in spi-der monkeys (Ateles). Mol Phylogenet Evol 19:67-75. Cortes-Ortiz L, Bermingham E, Rico C, Rodriguez-Luna E,
Sam-paio I and Ruiz-Garcia M (2003) Molecular systematics and biogeography of the Neotropical monkey genus,Alouatta. Mol Phylogenet Evol 26:64-81.
Eberhard JR and Bermingham E (2005) Phylogeny and compara-tive biogeography ofPionopsittaparrots andPteroglossus toucans. Mol Phylogenet Evol 36:288-304.
Ericson PG, Anderson CL, Britton T, Elzanowski A, Johansson US, Kallersjo M, Ohlson JI, Parsons TJ, Zuccon D and Mayr G (2006) Diversification of Neoaves: Integration of molecu-lar sequence data and fossils. Biol Lett 2:543-547.
Galewski T, Mauffrey JF, Leite YL, Patton JL and Douzery EJ (2005) Ecomorphological diversification among South American spiny rats (Rodentia, Echimyidae): A phylogen-etic and chronological approach. Mol Phylogenet Evol 34:601-615.
Gamble T, Simons AM, Guarino RC and Vitt LJ (2008) Tertiary climate change and the diversification of the Amazonian gecko genus Gonatodes (Sphaerodactylidae, Squamata). Mol Phylogenet Evol 46:269-277.
Gibb GC, Kardailsky O, Kimball RT, Braun EL and Penny D (2007) Mitochondrial genomes and avian phylogeny: Com-plex characters and resolvability without explosive radia-tions. Mol Biol Evol 24:269-280.
Grau ET, Pereira SL, Silveira LF, Hofling E and Wajntal A (2005) Molecular phylogenetics and biogeography of Neotropical piping guans (Aves, Galliformes):PipileBonaparte, 1856 is synonym ofAburriaReichenbach, 1853. Mol Phylogenet Evol 35:637-645.
Gregory-Wodzicki KM (2000) Uplift history of the Central and Northern Andes: A review. GSA Bull 112:1091-1105. Haffer J (1974) Avian speciation in tropical South America.
Cam-bridge, Massachusetts, 390 pp.
Haffer J (1997) Alternative models of vertebrate speciation in Amazonia: An overview. Biodiversity and Conservation, 6:451-476.
Haq BU, Hardenbol J and Vail PR (1987) Chronology of fluctuat-ing sea levels since the Triassic. Science 235:1156-1167. Hofling E (2004) Recent anatomical studies on neotropical birds.
Ornitol Neotrop 15:73-81.
Hooghiemstra H and Van der Hammen T (1998) Neogene and Quaternary development of the Neotropical rain forest: The refugia hypothesis, and a literature overview. Earth-Sci Rev 44:147-183.
Hoorn C (1994) An environmental reconstruction of the palaeo-Amazon River system (Middle-Late Miocene, NW Ama-zonia). Palaeogeogr Palaeoclimat Palaeoecol 112:187-238. Huelsenbeck JP, Bull JJ and Cunningham CW (1996) Combining
data in phylogenetic analysis. Trends Ecol Evol 11:152-158. Kimura RK, Pereira SL, Grau ET, Höfling E and Wajntal A (2004) Genetic distances and phylogenetic analysis suggest thatBailloniusCassin, 1867 is aPteroglossusIlliger, 1811 (Piciformes, Ramphastidae). Ornitol Neotrop 15:527-537. Klammer G (1984) The relief of extra-Andean Amazon basin. In:
Sioli H (ed) The Amazon: Limnology and Landscape Ecol-ogy of a Mighty Tropical River and Its Basin. Dr. W. Junk, Dordrecht, pp 47-83.
Lim BK (2007) Divergence times and origin of neotropical sheath-tailed bats (Tribe Diclidurini) in South America. Mol Phylogenet Evol 45:777-791.
Livezey BC and Zusi RL (2007) Higher-order phylogeny of mod-ern birds (Theropoda, Aves, Neornithes) based on compara-tive anatomy. II. Analysis and discussion. Zool J Linn Soc 179:1-95.
Lundberg JG, Marshall LG, Guerrero J, Horton B, Malabarba MCSL and Wesselingh F (1998) The stage for Neotropical fish diversification: A history of tropical South American rivers. In: Malabarba LR, Reis RE, Vari RP, Lucena ZMS and Lucena CAS (eds) Phylogeny and Classification of Neotropical Fishes. Editora Universitaria PUCRS, Porto Alegre, pp 13-48.
Mayr G (2005) A tiny-barbet like bird from the lower Oligocene of Germany: The smallest species and earliest substantial fossil record of the Pici (woodpeckers and allies). The Auk 122:1055-1063.
Montoya-Burgos JI (2003) Historical biogeography of the catfish genusHypostomus(Siluriformes, Loricariidae), with impli-cations on the diversification of Neotropical ichthyofauna. Mol Ecol 12:1855-1867.
Moyle RG (2005) Phylogeny and biogeographical history of Tro-goniformes, a pantropical bird order. Biol J Linn Soc 84:725-738.
Nahum LA, Pereira SL, Fernandes FMD, Matioli SR and Wajntal A (2003) Diversification of Ramphastinae (Aves, Ramphastidae) prior to the Cretaceous/Tertiary boundary as shown by molecular clock of mtDNA sequences. Genet Mol Biol 26:411-418.
Nores M (1999) An alternative hypothesis for the origin of Ama-zonian bird diversity. J Biogeogr 26:475-485.
Nores M (2004) The implications of Tertiary and Quaternary sea level rise events for avian distribution patterns in the low-lands of northern South America. Global Ecol Biogeogr 13:149-161.
Nylander JA (2004) MrModeltest 2.0. Program distributed by the author. Evolutionary Biology Centre, Uppsala University. Pennington RT, Lavin M, Prado DE, Pendry CA, Pell SK and
Butterworth CA (2004) Historical climate change and speciation: Neotropical seasonally dry forest plants show patterns of both tertiary and quaternary diversification. Phil Trans R Soc Lond B Biol Sci 359:515-537.
Pereira SL and Baker AJ (2004) Vicariant speciation of curassows (Aves, Cracidae): A hypothesis based on mitochondrial DNA phylogeny. The Auk 121:682-694.
Pereira SL and Baker AJ (2006) A mitogenomics timescale for birds detects variable phylogenetic rates of molecular evolu-tion and refutes the standard molecular clock. Mol Biol Evol 23:1731-1740.
Pereira SL, Baker AJ and Wajntal A (2002) Combined nuclear and mitochondrial DNA sequences resolve generic relation-ships within the Cracidae (Galliformes, Aves). Syst Biol 51:946-958.
Ribas CC, Moyle RG, Miyaki CY and Cracraft J (2007) The as-sembly of montane biotas: Linking Andean tectonics and climatic oscillations to independent regimes of diversifica-tion inPionusparrots. Proc Biol Sci 274:2399-2408. Ronquist F and Huelsenbeck JP (2003) MrBayes 3: Bayesian
phylogenetic inference under mixed models. Bioinformatics 19:1572-1574.
Salazar-Bravo J, Dragoo JW, Tinnin DS and Yates TL (2001) Phylogeny and evolution of the neotropical rodent genus Calomys: Inferences from mitochondrial DNA sequence data. Mol Phylogenet Evol 20:173-184.
Shields GF and Wilson AC (1987) Calibration of mitochondrial DNA evolution in geese. J Mol Evol 24:212-217.
Shimodaira H (2002) An approximately unbiased test of phylo-genetic tree selection. Syst Biol 51:492-508.
Shimodaira H and Hasegawa M (2001) CONSEL: For assessing the confidence of phylogenetic tree selection. Bioinforma-tics 17:1246-1247.
Short LL and Horne JFM (2001) Toucans, Barbets and Honey-guides. Ramphastidae, Capitonidae and Indicatoridae. Ox-ford University Press, New York, 554 pp.
Sick H (1997) Ornitologia Brasileira. Nova Fronteira, Rio de Ja-neiro, 823 pp.
Stadelmann B, Lin L-K, Kunz TH and Ruedi M (2007) Molecular phylogeny of New World Myotis (Chiroptera, Vespertilionidae) inferred from mitochondrial and nuclear genes. Mol Phylogenet Evol 43:32-48.
Thorne JL and Kishino H (2002) Divergence time and evolution-ary rate estimation with multilocus data. Syst Biol 51:689-702.
Thorne JL, Kishino H and Painter IS (1998) Estimating the rate of evolution of the rate of molecular evolution. Mol Biol Evol 15:1647-1657.
Wesselingh FP and Salo JA (2006) A Miocene perspective on the evolution of the Amazon basin. Scripta Geologica 133:439-458.
Wilson AC, Cann RL, Carr S, George M, Gyllensten U, Helm-Bychowski K, Higuchi R, Palumbi SR, Prager E, Sage RD, et al.(1985) Mitochondrial DNA and two perspectives on evolutionary genetics. Biol J Linn Soc 26:375-400. Yang Z (1997) PAML: A program package for phylogenetic
anal-ysis by maximum likelihood. Comput Appl Biosci 13:555-556.
Yang Z and Yoder AD (2003) Comparison of likelihood and Bayesian methods for estimating divergence times using multiple gene loci and calibration points, with application to a radiation of cute-looking mouse lemur species. Syst Biol 52:705-716.
Internet Resources
Pires TC (2008) Filogenia de Ramphastidae (Aves, Piciformes), com base em caracteres morfológicos siringeais. Master’s Thesis, Dept. Zoology, University of São Paulo, http:// www.teses.usp.br/teses/disponiveis/41/41133/tde-1606200 8-143347/.
Associate Editor: Louis Bernard Klaczko