AMTD
5, 6679–6732, 2012MAXDOAS formaldehyde slant
column measurements
G. Pinardi et al.
Title Page
Abstract Introduction
Conclusions References
Tables Figures
◭ ◮
◭ ◮
Back Close
Full Screen / Esc
Printer-friendly Version Interactive Discussion
Discussion
P
a
per
|
Dis
cussion
P
a
per
|
Discussion
P
a
per
|
Discussio
n
P
a
per
|
Atmos. Meas. Tech. Discuss., 5, 6679–6732, 2012 www.atmos-meas-tech-discuss.net/5/6679/2012/ doi:10.5194/amtd-5-6679-2012
© Author(s) 2012. CC Attribution 3.0 License.
Atmospheric Measurement Techniques Discussions
This discussion paper is/has been under review for the journal Atmospheric Measurement Techniques (AMT). Please refer to the corresponding final paper in AMT if available.
MAXDOAS formaldehyde slant column
measurements during CINDI:
intercomparison and analysis
improvement
G. Pinardi1, M. Van Roozendael1, N. Abuhassan4, C. Adams2, A. Cede4,
K. Cl ´emer1,*, C. Fayt1, U. Frieß5, M. Gil6, J. Herman4, C. Hermans1, F. Hendrick1, H. Irie7,**, A. Merlaud1, M. Navarro Comas6, E. Peters8, A. J. M. Piters9,
O. Puentedura6, A. Richter8, A. Sch ¨onhardt8, R. Shaiganfar3, E. Spinei10, K. Strong2, H. Takashima7,***, M. Vrekoussis8,11, T. Wagner3, F. Wittrock8, and S. Yilmaz5
1
BIRA-IASB: Belgian Institute for Space Aeronomy, Brussels, Belgium 2
Department of Physics, University of Toronto, Ontario, Canada 3
Max Planck Institute for Chemistry, Mainz, Germany 4
NASA/Goddard Space Flight Center, USA 5
Institute of Environmental Physics, University of Heidelberg, Germany 6
INTA, Madrid, Spain 7
AMTD
5, 6679–6732, 2012MAXDOAS formaldehyde slant
column measurements
G. Pinardi et al.
Title Page
Abstract Introduction
Conclusions References
Tables Figures
◭ ◮
◭ ◮
Back Close
Full Screen / Esc
Printer-friendly Version Interactive Discussion
Discussion
P
a
per
|
Dis
cussion
P
a
per
|
Discussion
P
a
per
|
Discussio
n
P
a
per
|
8
Institute of Environmental Physics, University of Bremen, Germany 9
Royal Netherlands Meteorological Institute, KNMI, De Bilt, The Netherlands 10
Laboratory for Atmospheric Research, Washington State University, Pullman WA, USA 11
Energy, Environment and Water Research Center, The Cyprus Institute, Nicosia, Cyprus *
now at: Instituut voor Sterrenkunde, Katholieke Universiteit Leuven, Belgium **
now at: Center for Environmental Remote Sensing, Chiba University, Japan ***
now at: Department of Earth System Science, Faculty of Science, Fukuoka University, Japan Received: 23 July 2012 – Accepted: 6 September 2012 – Published: 18 September 2012 Correspondence to: G. Pinardi ([email protected])
AMTD
5, 6679–6732, 2012MAXDOAS formaldehyde slant
column measurements
G. Pinardi et al.
Title Page
Abstract Introduction
Conclusions References
Tables Figures
◭ ◮
◭ ◮
Back Close
Full Screen / Esc
Printer-friendly Version Interactive Discussion
Discussion
P
a
per
|
Dis
cussion
P
a
per
|
Discussion
P
a
per
|
Discussio
n
P
a
per
|
Abstract
We present intercomparison results for formaldehyde (HCHO) slant column measure-ments performed during the Cabauw Intercomparison Campaign of Nitrogen Dioxide measuring Instruments (CINDI) that took place in Cabauw, the Netherlands, in summer 2009. During two months, nine atmospheric research groups simultaneously operated
5
MAXDOAS instruments of various designs to record UV-visible spectra of scattered sunlight at different elevation angles that were analysed using common retrieval set-tings. The resulting HCHO dataset was found to be highly consistent, the mean diff er-ence between instruments generally not exceeding 15 % or 7.5×10¹⁵molec cm2, for
all viewing elevation angles. Furthermore, a sensitivity analysis was performed to
in-10
vestigate the uncertainties in the HCHO slant column retrieval when varying key input parameters such as the molecular absorption cross-sections, correction terms for the Ring effect or the width and position of the fitting interval. This study led to the identifica-tion of potentially important sources of errors associated with cross-correlaidentifica-tion effects involving the Ring effect, O4, HCHO and BrO cross-sections and the DOAS closure
15
polynomial. As a result, a set of updated recommendations was formulated for HCHO slant column retrieval in the 336.5–359 nm wavelength range. To conclude, an error budget is proposed which distinguishes between systematic and random uncertain-ties. The total systematic error is estimated to be of the order of 20 % and is dominated by uncertainties in absorption cross-sections and related spectral cross-correlation
ef-20
fects. For a typical integration time of one minute, random uncertainties range between 5 % and 30 %, depending on the noise level of individual instruments.
1 Introduction
Formaldehyde (HCHO) is the most abundant organic carbonyl compound in the at-mosphere. Being a short-lived oxidation product of a large number of Volatile
Or-25
AMTD
5, 6679–6732, 2012MAXDOAS formaldehyde slant
column measurements
G. Pinardi et al.
Title Page
Abstract Introduction
Conclusions References
Tables Figures
◭ ◮
◭ ◮
Back Close
Full Screen / Esc
Printer-friendly Version Interactive Discussion
Discussion
P
a
per
|
Dis
cussion
P
a
per
|
Discussion
P
a
per
|
Discussio
n
P
a
per
|
natural origin or from human activities. In particular, the variability of HCHO over conti-nents is dominated by local production from non-methane volatile organic compounds (NMVOCs) (Millet et al., 2006; Stavrakou et al., 2009a,b and references therein), orig-inating from biogenic, pyrogenic or anthropogenic sources. These emissions, through their involvement in tropospheric ozone chemistry, are important in controlling air
qual-5
ity. Over Europe, satellite observations reveal a marked seasonal cycle, with a summer maximum and a winter minimum (Curci et al., 2010).
Tropospheric formaldehyde has been observed from nadir UV backscatter satellite sensors (Chance et al., 2000; Palmer et al., 2003; Wittrock et al., 2006; De Smedt et al., 2008, 2010; Millet et al., 2008; Marbach et al., 2009; Vrekoussis et al., 2010;
10
Curci et al., 2010), as well as from airborne and ground-based in-situ instruments (e.g. Hak et al., 2005; Fried et al., 2011 and references therein) and ground-based remote-sensing Fourier transform infrared spectrometers (e.g. Demoulin et al., 1999; Jones et al., 2009; Vigouroux et al., 2009). In the UV, HCHO can be measured using ac-tive and passive differential optical absorption spectroscopy (DOAS) (see Platt and
15
Stutz, 2008, for a review). Among the category of passive DOAS systems, the Multi-AXis DOAS (MAXDOAS) technique can be used for tropospheric trace gas monitoring (Van Roozendael 2003; H ¨onninger et al., 2004; Sinreich et al., 2005). The MAXDOAS technique has been successfully applied to NO2, HCHO, SO2, BrO, and CHOCHO de-tection (e.g. Bobrowski et al., 2003; Wittrock et al., 2004; Heckel et al., 2005; Sinreich
20
et al., 2007; Pikelnaya et al., 2007; Theys et al., 2007; Cl ´emer et al., 2009; Vlemmix et al., 2010, 2011a; Irie et al., 2011; Wagner et al., 2011).
MAXDOAS instruments perform quasi-simultaneous observations of scattered sun-light in a range of viewing directions scanned from the horizon to the zenith. Measure-ments made at low elevation angles have a higher sensitivity to lower tropospheric
25
AMTD
5, 6679–6732, 2012MAXDOAS formaldehyde slant
column measurements
G. Pinardi et al.
Title Page
Abstract Introduction
Conclusions References
Tables Figures
◭ ◮
◭ ◮
Back Close
Full Screen / Esc
Printer-friendly Version Interactive Discussion
Discussion
P
a
per
|
Dis
cussion
P
a
per
|
Discussion
P
a
per
|
Discussio
n
P
a
per
|
the vertical distribution of both trace gases and aerosols (Wagner et al., 2004; Frieß et al., 2006; Irie et al., 2008, 2009; Cl ´emer et al., 2010; Li et al., 2010). These ad-vantages, combined with the fact that measurements can be made automatically year-round with a good/frequent temporal sampling, make the MAXDOAS method suitable for long-term monitoring of atmospheric composition. Moreover, due to their spatial
5
representativeness in both vertical and horizontal axes (Irie et al., 2011; Wagner et al., 2011), MAXDOAS measurements are also particularly well suited to make the link be-tween satellite observations, chemical transport model calculations, and in-situ mea-surements in a validation context (Brinksma et al., 2008; Vlemmix et al., 2011b).
The first reported MAXDOAS measurements of HCHO were performed in the Italian
10
Po-Valley in summer 2002 and 2003 (Heckel et al., 2005; Wagner et al., 2011). Soon after, Hak et al. (2005) reported on an intercomparison exercise including the chro-matographic technique, long-path (LP) DOAS, Fourier Transform Infrared (FTIR), MAX-DOAS, and Hantzsch-type in-situ instruments, showing good consistency between the different techniques. In 2006, Wittrock et al. published a study on global HCHO
15
mapping from the SCIAMACHY nadir satellite instrument including comparisons with two MAXDOAS systems (in Kenya and the Netherlands), and found good agreement within the estimated uncertainties. Pikelnaya et al. (2007) and Inomata et al. (2008) also compared MAXDOAS HCHO with LP-DOAS and PTR-MS data, respectively, and Vigouroux et al. (2009) compared SCIAMACHY, MAXDOAS and FTIR HCHO total
20
columns in a tropical remote region. Recently, Fried et al. (2011) presented a compari-son of ground-based MAXDOAS and aircraft HCHO measurements during the INTEX-B campaign and showed good agreement between both datasets.
Although the aforementioned studies have largely demonstrated the capabilities of MAXDOAS systems for HCHO detection, no effort has been devoted so far to
intercom-25
AMTD
5, 6679–6732, 2012MAXDOAS formaldehyde slant
column measurements
G. Pinardi et al.
Title Page
Abstract Introduction
Conclusions References
Tables Figures
◭ ◮
◭ ◮
Back Close
Full Screen / Esc
Printer-friendly Version Interactive Discussion
Discussion
P
a
per
|
Dis
cussion
P
a
per
|
Discussion
P
a
per
|
Discussio
n
P
a
per
|
2010; Piters et al., 2012), where a number of MAXDOAS instruments were jointly op-erated, presented the opportunity to assess for the first time the consistency of these HCHO measuring systems. The Cabauw site is located in a semi-rural area of the Netherlands where formaldehyde concentrations are expected to be between one and several tens of ppbv, which are typical background levels in the continental boundary
5
layer and urban regions, respectively (Hak et al., 2005; Fried et al., 2011). In their study on multi-component MAXDOAS retrievals during CINDI, Irie et al. (2011) reported me-dian HCHO Vertical Mixing Ratios (VMRs) of around 2.5 ppbv, and peak values of up to 8 ppbv. The CINDI data set is therefore ideally suited for an HCHO intercomparison exercise.
10
This paper is structured as follows. Section 2 gives an overview of the CINDI cam-paign, the data recorded, the instruments, and the settings used by the different groups. Results from the HCHO slant column intercomparison are then presented in Sect. 3. In Section 4, we focus on sensitivity tests performed to assess the stability of the HCHO evaluations. Results are used to derive an error budget for slant column retrievals.
15
Conclusions and perspectives are given in Sect. 5.
2 Data analysis
2.1 The CINDI intercomparison campaign
The CINDI campaign took place at the Cabauw Experimental Site for Atmospheric Re-search (CESAR site; Russchenberg et al., 2005) a semi-rural area in the Netherlands.
20
Although the campaign mainly focused on tropospheric NO2, aerosols were also moni-tored with in-situ systems, sun photometers and a lidar (Piters et al., 2012; Zieger et al., 2011; Irie et al., 2011). To complement the atmospheric composition measurements, the site offered a large ensemble of meteorological observations. A detailed descrip-tion of the CINDI campaign and an overview of first results can be found in Piters
25
AMTD
5, 6679–6732, 2012MAXDOAS formaldehyde slant
column measurements
G. Pinardi et al.
Title Page
Abstract Introduction
Conclusions References
Tables Figures
◭ ◮
◭ ◮
Back Close
Full Screen / Esc
Printer-friendly Version Interactive Discussion
Discussion
P
a
per
|
Dis
cussion
P
a
per
|
Discussion
P
a
per
|
Discussio
n
P
a
per
|
Instruments were installed and tested between 8 and 14 June 2009 and a for-mal semi-blind intercomparison of NO2 and O4 Differential Slant Column Densities (DSCDs) took place from 15 to 30 June 2009 (Roscoe et al., 2010). After that date, additional measurements were performed by several groups until 24 July, focusing on other species, such as HCHO, BrO, and CHOCHO. The goal of the formal semi-blind
5
NO2 and O4 intercomparison was to characterize the current level of consistency of multi-axis instruments, as previously done for the zenith-sky instruments of the Net-work for the Detection of Atmospheric Composition Change (NDACC; e.g. Roscoe et al., 1999; Vandaele et al., 2005). During CINDI, 22 NO2 measuring systems were intercompared, and most of them were shown to meet the criteria for endorsement by
10
NDACC (Roscoe et al., 2010).
2.2 Instruments
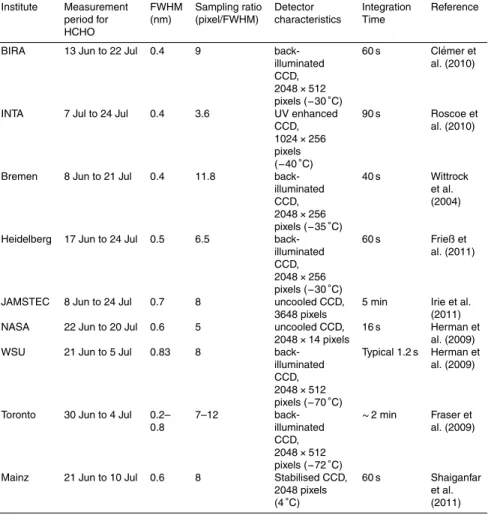
The present work focuses on HCHO measurements from MAXDOAS instruments. Nine groups participated in this exercise, as reported in Table 1. In addition NIWA (National Institute for Water and Atmospheric Research, New Zealand) and KNMI (Koninklijk
15
Nederlands Meteorologisch Instituut, the Netherlands) performed a few HCHO mea-surements during the campaign. However, these data were too sparse to include in the intercomparison.
A comprehensive description of the CINDI MAXDOAS instruments can be found in Piters et al. (2012) and Roscoe et al. (2010), and additional references relevant
20
for the present study are given in Table 1. All systems that operated during CINDI recorded spectra at a set of prescribed elevation angles (2◦, 4◦, 8◦, 15◦, 30◦ and the zenith), and at a fixed azimuth angle of 287◦relative to North. A full cycle of MAXDOAS measurements was generally obtained within half an hour. For the intercomparison of HCHO, only measurements recorded at solar zenith angle (SZA) less than 75◦ were
25
AMTD
5, 6679–6732, 2012MAXDOAS formaldehyde slant
column measurements
G. Pinardi et al.
Title Page
Abstract Introduction
Conclusions References
Tables Figures
◭ ◮
◭ ◮
Back Close
Full Screen / Esc
Printer-friendly Version Interactive Discussion
Discussion
P
a
per
|
Dis
cussion
P
a
per
|
Discussion
P
a
per
|
Discussio
n
P
a
per
|
As can be seen in Table 1, the characteristics of the various instruments were quite diverse, ranging from commercial mini-DOAS systems to state-of-the-art scien-tific grade instruments equipped with thermoelectrically cooled CCD array detectors of large dimension. Accordingly, the stability and noise levels were expected to dif-fer considerably from one system to another, with a direct impact on corresponding
5
HCHO measurements. Another important point is that some instruments were set up to record spectra in both UV and visible ranges simultaneously, while others had to al-ternate between these two wavelengths regions. As a result, some systems (e.g. INTA and Toronto) could only measure HCHO after 30 June, at the end of the formal period of the NO2 intercomparison exercise described in Roscoe et al. (2010). Others
instru-10
ments (WSU, NASA) switched their wavelength range repeatedly over time, alternating the two types of measurements throughout the campaign. It should be noted that the MAXDOAS instrument of the Toronto group was tested in multi-axis mode for the first time during this campaign, and only a few days of data were available.
2.3 HCHO analysis settings 15
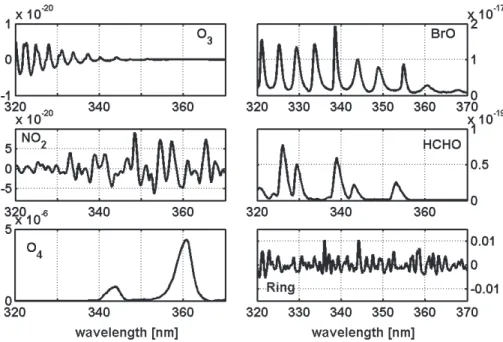
Formaldehyde presents structured absorption bands in the UV spectral region, be-tween 240 and 360 nm. Because of the increased ozone absorption below 320 nm, only the bands above 320 nm are generally used for the spectral retrieval of HCHO. In this region, the HCHO DSCDs are retrieved from measured spectra by applying the DOAS technique (Platt and Stutz, 2008, and references therein). The wavelength
inter-20
val for fitting is generally optimized so as to (1) maximize the sensitivity to HCHO, (2) minimize the fitting residuals and the scatter of the retrieved HCHO slant columns, and (3) minimize the interferences with other absorbers. Figure 1 displays the absorption cross-sections of the trace gases that need to be considered in the 320–370 nm wave-length region. Based on experience and heritage from past studies on ground-based
25
AMTD
5, 6679–6732, 2012MAXDOAS formaldehyde slant
column measurements
G. Pinardi et al.
Title Page
Abstract Introduction
Conclusions References
Tables Figures
◭ ◮
◭ ◮
Back Close
Full Screen / Esc
Printer-friendly Version Interactive Discussion
Discussion
P
a
per
|
Dis
cussion
P
a
per
|
Discussion
P
a
per
|
Discussio
n
P
a
per
|
are summarized in Table 2. Note that all absorption cross-sections were convolved to the resolution of the individual instruments using slit function information provided by each group. In the case of the O3 and NO2 cross-sections, a solar I0 correction was applied (Aliwell et al., 2002).
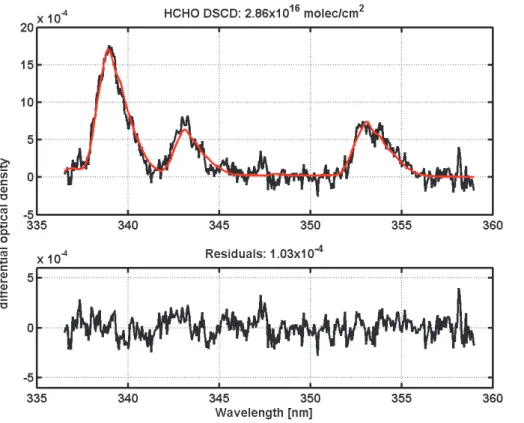
For the retrievals, daily reference spectra were taken from the zenith observations
5
around 11:40 UT. Figure 2 presents an example of HCHO fitting results obtained with the BIRA-IASB instrument on 30 June 2009, at 4◦ elevation angle and 43◦ SZA. The corresponding residuals (approximately 10−4 RMS) are typical of low-noise scientific grade instruments. Under similar conditions, residuals can be an order of magnitude larger when using compact mini-DOAS systems.
10
2.4 Results
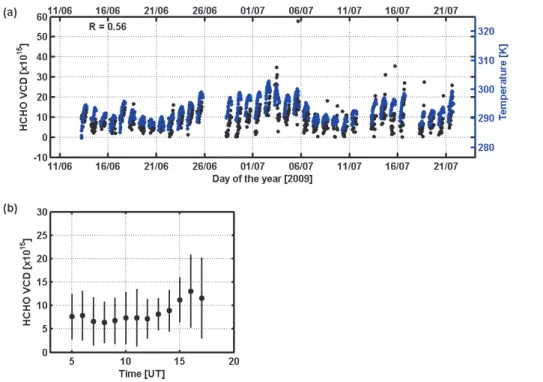
Figure 3a shows an example of HCHO measurements obtained during CINDI. HCHO DSCDs measured by the BIRA-IASB MAXDOAS instrument at 30◦elevation were con-verted into equivalent vertical columns (VCDs) using a simple geometrical approxima-tion (H ¨onninger et al., 2004). The time-series of HCHO VCDs covers approximately
15
one month during summer. Comparing the retrieved columns with measurements of the ambient temperature (Fig. 3a), one can see that the HCHO variations are strongly correlated with corresponding changes in the temperature. This feature was reported by Irie et al. (2011) and is consistent with a background HCHO source, mainly due to the oxidation of biogenic NMVOCs. In contrast, the HCHO peak values as observed on
20
several days in July are probably related to anthropogenic emission sources. In Fig. 3b, the complete VCD dataset was binned and plotted as a function of the local time. As can be seen from the standard deviations, the natural variability of HCHO is large, but the diurnal variation consistently peaks in the afternoon, which is likely related to the progressive oxidation of the NMVOCs emitted during the day.
AMTD
5, 6679–6732, 2012MAXDOAS formaldehyde slant
column measurements
G. Pinardi et al.
Title Page
Abstract Introduction
Conclusions References
Tables Figures
◭ ◮
◭ ◮
Back Close
Full Screen / Esc
Printer-friendly Version Interactive Discussion
Discussion
P
a
per
|
Dis
cussion
P
a
per
|
Discussion
P
a
per
|
Discussio
n
P
a
per
|
3 Slant column intercomparison results
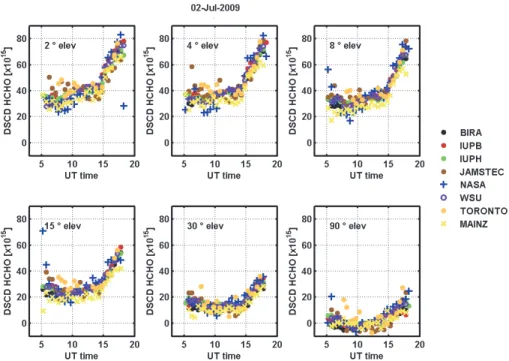
We follow the method introduced in Roscoe et al. (2010) for the NO2 and O4 slant column measurement intercomparison. HCHO DSCDs retrieved by each group using the baseline analysis settings defined in Table 2, are averaged over periods of 30 min. This procedure minimizes the impact of the temporal and spatial variability of HCHO
5
and of the differences in read-out noise between instruments. An example of the diurnal evolution of the resampled HCHO DSCDs is shown in Fig. 4 for different elevation angles and for SZA <75◦, on 2 July 2009. This day was chosen because almost all instruments were in operation and the HCHO concentrations had a smooth variation over time. As can be seen, the HCHO DSCDs are consistently larger at low elevation
10
due to the enhanced light path in the near-surface HCHO layer; good agreement is observed between various datasets.
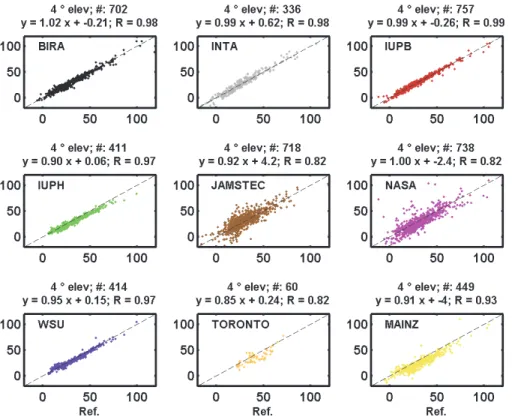
To proceed further, the measurements from each group were first compared to the Bremen dataset, which has the most complete time-series, very frequent measure-ments and smooth behaviour. In the second step, a reference dataset was created by
15
grouping the instruments that presented the best mutual agreement. To illustrate this procedure, Fig. 5 displays the BIRA HCHO DCSDs plotted against those of Bremen, for different elevation angles. Relevant statistical parameters (correlation coefficient, slope and intercept of the linear regression fit) are indicated. As can be seen, the scat-ter plots are compact, and the slopes and correlation coefficients are close to unity,
20
confirming the good agreement between the Bremen and BIRA instruments. Statistical parameters at 30◦ and 90◦ elevation are slightly smaller, due to the smaller dynamical range of the DSCDs at those elevations (see Fig. 4). Similar agreement was found with INTA, and therefore a reference data set was created by averaging data from the Bremen, BIRA and INTA instruments. The scatter plots displayed in Fig. 6 illustrate,
25
AMTD
5, 6679–6732, 2012MAXDOAS formaldehyde slant
column measurements
G. Pinardi et al.
Title Page
Abstract Introduction
Conclusions References
Tables Figures
◭ ◮
◭ ◮
Back Close
Full Screen / Esc
Printer-friendly Version Interactive Discussion
Discussion
P
a
per
|
Dis
cussion
P
a
per
|
Discussion
P
a
per
|
Discussio
n
P
a
per
|
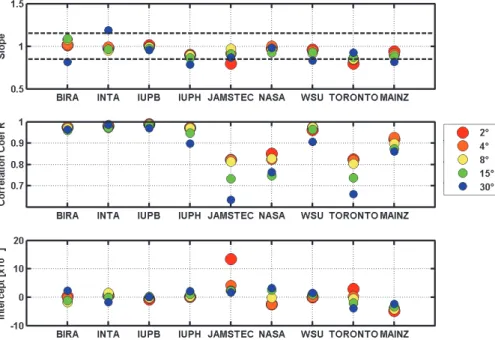
groups agree quite well with the reference. Figure 7 presents the final results of the statistical analysis, constructed using the whole ensemble of off-axis measurements (2◦, 4◦, 8◦, 15◦ and 30◦). Most instruments compare relatively well with the reference for most of the elevation angles: correlation coefficients are close to unity (illustrating the compactness of the scatter plot with respect to the reference), slopes deviate by no
5
more than 15 % from the reference, and intercepts are close to zero. Note that larger relative differences against the reference are systematically obtained at 30◦ elevations due to the lower HCHO DSCDs at this elevation angle (see Fig. 4). Also smaller values for the correlation coefficients and larger intercept values and corresponding uncer-tainties are found for the JAMSTEC, NASA and Toronto datasets, which might possibly
10
be connected to the larger noise of the corresponding instruments with respect to oth-ers (see Fig. 6). A test with an orthogonal regression (instead of linear) shows similar results.
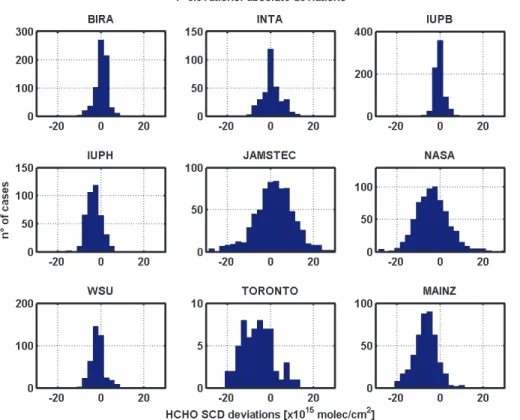
For each instrument, the histograms of the absolute HCHO DSCDs deviations are presented in Fig. 8. Only the results at 4◦ elevation are shown, but similar
conclu-15
sions can be drawn at other elevations. All instruments, except the Toronto one, have a symmetric and quasi-Gaussian shape for the 4◦ elevation, but large differences in the Gaussian FWHM (full width at half maximum). Largest FWHM values are found for JAMSTEC, NASA and Mainz, consistent with the noise level of those instruments. Some of the groups (IUPH, JAMSTEC, NASA, Toronto and Mainz) also display a small
20
but significant bias compared to the reference. It should be mentioned again that the first three instruments (BIRA, INTA and Bremen) were used to construct the reference dataset and thus a better agreement with the reference is expected due to this choice. For the Mainz instrument, the negative bias might be related to the position of the in-strument, at an altitude of 20 m on the Cabauw tower, where measurements probably
25
AMTD
5, 6679–6732, 2012MAXDOAS formaldehyde slant
column measurements
G. Pinardi et al.
Title Page
Abstract Introduction
Conclusions References
Tables Figures
◭ ◮
◭ ◮
Back Close
Full Screen / Esc
Printer-friendly Version Interactive Discussion
Discussion
P
a
per
|
Dis
cussion
P
a
per
|
Discussion
P
a
per
|
Discussio
n
P
a
per
|
The HCHO intercomparison exercise presented here should be connected to the NO2 and O4 comparisons performed by Roscoe et al. (2010). They reported fitted slopes for the visible MAX-DOAS instruments within 10 % of unity at almost all non-zenith elevations, with most instruments within 5 %; similarly, values of 12 % and 7 %, were found for the UV sensors. The 15 % deviation from unity slope derived in our study
5
for the HCHO columns in the UV are thus a good result, considering that retrieving HCHO DSCDs is more challenging than retrieving NO2, because of the smaller optical thickness of HCHO.
4 Sensitivity study
The intercomparison study presented in Sect. 3 has been conducted using
standard-10
ized retrieval settings consistently applied by each participating group. This harmoniza-tion procedure allowed us to concentrate on instrument-specific differences and to draw conclusions on the overall level of consistency between HCHO measuring systems op-erated during CINDI. We now concentrate on evaluating the sensitivity of HCHO results to possible changes in the retrieval settings using representative spectra from the BIRA
15
instrument recorded on a clear day (4 July 2009). As will be illustrated hereafter, these sensitivity tests highlight possible optimizations in the HCHO slant column retrieval parameters and lead to the recommendation of new analysis settings. Sensitivity test results are shown both on DSCDs and on dDSCDs, i.e. the difference of the off-axis DSCDs with the zenith DSCDs of the scan (the closest in time), as it’s the information
20
used in the profile inversions.
4.1 Degree of closure polynomial and Ring effect
When performing a DOAS retrieval, an important free parameter is the degree of the polynomial function that is used to account for the smooth part of the attenuation spec-trum. To avoid oscillations that may correlate with trace gas absorption features, the
AMTD
5, 6679–6732, 2012MAXDOAS formaldehyde slant
column measurements
G. Pinardi et al.
Title Page
Abstract Introduction
Conclusions References
Tables Figures
◭ ◮
◭ ◮
Back Close
Full Screen / Esc
Printer-friendly Version Interactive Discussion
Discussion
P
a
per
|
Dis
cussion
P
a
per
|
Discussion
P
a
per
|
Discussio
n
P
a
per
|
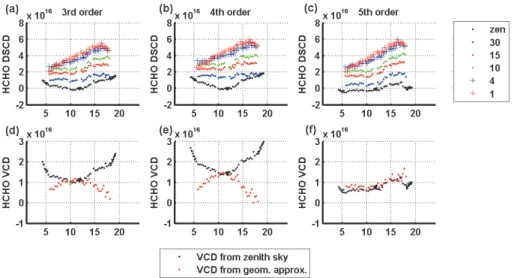
degree of this polynomial is generally restricted to values less than 5. For the baseline retrievals, a 3rd order polynomial was selected. However, during our sensitivity tests, we noticed that any changes to these polynomial settings had a strong impact on the diurnal behaviour of the HCHO DSCD, especially for high elevation angles including zenith, as can be seen in Fig. 9a, b, c. This raised the following two questions: (1) why
5
such a dependence on the polynomial order, and (2) which one of the tested settings is the most satisfactory? In order to answer the second question, we decided to investi-gate the consistency of VCDs estimates as follows. In a first approximation, the HCHO VCD can be derived from measured DSCDs in two different simple ways: first, from the difference between 30◦ elevation off-axis and zenith observations using the so-called
10
geometrical approximation (H ¨onninger et al., 2004) and second, from direct conversion of the zenith-sky observations using appropriate AMFs. For the present analysis, and considering that our test data were recorded under clear-sky aerosol-free conditions, zenith-sky HCHO AMFs were calculated using the UVspec/DISORT model (Mayer and Kylling, 2005; Hendrick et al., 2006) at the wavelength of 346 nm and for a typical HCHO
15
profile peaking in the boundary layer. The HCHO content in the noon reference spec-trum was derived using the geometrical approximation, so that both VCD evaluations (geometrical approximation and zenith-sky conversion) were constrained to agree at the time of the noon reference spectrum. The resulting time-series of retrieved HCHO VCDs are displayed in Fig. 9d, e, f for the same three polynomial settings. As can
20
be seen only the third case, i.e. the DOAS evaluation using a 5th order polynomial, leads to consistent retrievals of HCHO VCDs using both geometrical approximation and zenith-sky conversion.
Although these results strengthen our confidence in the corresponding HCHO DSCDs, the question remains: what is causing the observed dependence on the
poly-25
AMTD
5, 6679–6732, 2012MAXDOAS formaldehyde slant
column measurements
G. Pinardi et al.
Title Page
Abstract Introduction
Conclusions References
Tables Figures
◭ ◮
◭ ◮
Back Close
Full Screen / Esc
Printer-friendly Version Interactive Discussion
Discussion
P
a
per
|
Dis
cussion
P
a
per
|
Discussion
P
a
per
|
Discussio
n
P
a
per
|
showed that none of the other parameters involved in the HCHO retrieval produces a similar shape.
The Ring effect (Grainger and Ring, 1962) is a well-known phenomenon responsible for filling-in of the solar and telluric lines in scattered sunlight spectra (e.g. Grainger and Ring, 1962; Wagner et al., 2009 and references therein). This effect is large in
compari-5
son to the faint absorption features of HCHO and it can therefore produce interferences if not well corrected in the DOAS evaluation. To investigate further, the sensitivity of our HCHO DSCDs to uncertainties in the Ring effect, additional test analyses were per-formed using different sources for the Ring cross-sections:
– Baseline case: cross-section calculated according to Chance and Spurr (1997)
10
– Case A: normalised cross-section generated according to Wagner et al. (2009)
– Case B: cross-section derived from SCIATRAN radiative transfer calculations in a Rayleigh atmosphere (A. Richter, personal communication, 2005)
– Case C: two cross-sections generated from Principal Component Analysis of a range of SCIATRAN calculations in an ozone containing atmosphere, according
15
to Vountas et al. (1998)
Figure 11 shows the relation between changes in HCHO DSCDs and corre-sponding changes in the Ring fit coefficients when using different Ring cross-sections. One can see that HCHO dDSCD changes compared to the baseline (delta dDSCDs=dDSCD(new setting) – dDSCD(baseline)) are linearly related to changes in
20
the Ring fit coefficients. Comparing the retrieval cases using, respectively, a 3rd and a 5th order polynomials, it is also clear that the interference between HCHO and the Ring effect is much stronger when a 3rd order polynomial is used (Fig. 11a). This sug-gests that, for our analysis conditions, the use of a 3rd order polynomial introduces a misfit that activates the correlation between Ring and HCHO differential absorption
25
AMTD
5, 6679–6732, 2012MAXDOAS formaldehyde slant
column measurements
G. Pinardi et al.
Title Page
Abstract Introduction
Conclusions References
Tables Figures
◭ ◮
◭ ◮
Back Close
Full Screen / Esc
Printer-friendly Version Interactive Discussion
Discussion
P
a
per
|
Dis
cussion
P
a
per
|
Discussion
P
a
per
|
Discussio
n
P
a
per
|
a number of combinations of polynomials and Ring effect cross-sections were inves-tigated and are summarized in Fig. 12. For each case, the root-mean square of the differences between HCHO VCDs retrieved using our two alternative VCD calculation methods are displayed. Overall, one can see that the sensitivity to the choice of the Ring effect cross-section is smallest when using a polynomial of order 5, for which
5
more consistent results are obtained when changing the Ring datasets.
4.2 O4absorption cross-section
Another important interfering species in the HCHO fitting interval is the collisional dimer of molecular oxygen (O4). Its absorption cross-sections are still poorly characterised due the difficulty of measuring them in laboratory under pressures and temperatures
10
representative of atmospheric conditions. The Greenblatt et al. (1990) cross-sections are known to suffer from wavelength registration errors and have been measured under unsuitable high pressure conditions, not present in the ambient atmosphere. Alterna-tively, the Hermans et al. (2003) dataset provides cross-sections of overall better qual-ity, however significant uncertainties still remain, particularly in the UV region below
15
360 nm. We tested both datasets, and came to the conclusion that significant interfer-ences take place between O4, HCHO and BrO absorption features in the 336.5–359 nm interval. Figure 13 shows the HCHO and BrO DSCDs, as retrieved from MAXDOAS measurements using the Hermans et al. and the Greenblatt et al. O4 cross-sections. As can be seen, the Hermans dataset (our initial baseline for the intercomparison
ex-20
ercise) leads to larger HCHO columns but also to a larger spread in the BrO DSCDs retrieved at different viewing elevations, a feature that is not expected for a stratospheric absorber like BrO. In contrast, the BrO DSCDs derived using the Greenblatt O4 cross-section appear to be more consistent. Similarly to the case of the polynomial discussed before, this suggests that a misfit to the O4absorption (larger in this case using the
Her-25
AMTD
5, 6679–6732, 2012MAXDOAS formaldehyde slant
column measurements
G. Pinardi et al.
Title Page
Abstract Introduction
Conclusions References
Tables Figures
◭ ◮
◭ ◮
Back Close
Full Screen / Esc
Printer-friendly Version Interactive Discussion
Discussion
P
a
per
|
Dis
cussion
P
a
per
|
Discussion
P
a
per
|
Discussio
n
P
a
per
|
the Greenblatt et al. cross-sections, as is clearly apparent from Fig. 14. Based on these considerations, we conclude that the Greenblatt et al. O4 cross-section so far remains the better choice for HCHO retrieval in the 336.5–359 nm region.
4.3 DOAS fitting interval
As already mentioned, the baseline HCHO fitting interval selected for the present study
5
extends from 336.5 to 359 nm. This wavelength region, which includes three strong absorption bands of HCHO, has generally been recommended for HCHO DSCD re-trievals. However, the absorption structures of HCHO and BrO are to some extent correlated in this wavelength interval, which has been identified as an issue for satel-lite BrO retrievals (Theys et al., 2011). Figure 15b graphically displays the correlation
10
matrix of the different absorption cross-sections used in the HCHO fit. As can be seen, HCHO and BrO present the largest coefficient of correlation (around 0.55), which can be easily explained by the similarities of their differential absorption cross-sections (see Fig. 15a). In comparison, other species are less correlated. However, the coefficient of correlation between HCHO and O3and for other combinations involving O3, O4, BrO,
15
NO2and Ring are not negligible. Such correlations may be expected to be dependent on the wavelength interval considered for the analysis. Therefore, in an attempt to iden-tify the settings that would minimize the correlation matrix, calculations were performed for a range of fitting intervals starting between 332 and 338 nm and ending between 352 and 360 nm, in steps of 0.25 nm, in a similar way than what was done in Vogel
20
et al. (2012). For each case, the root-mean-square of the non-diagonal elements of the correlation matrix was reported in Fig. 15c. Smaller correlations are clearly found for fitting intervals starting at short wavelengths. From visual inspection of Fig. 15c, one can conclude that the 333–358 nm wavelength range presents a local minimum of correlation, likely because of the addition of a BrO band at 334 nm in a region free of
25
AMTD
5, 6679–6732, 2012MAXDOAS formaldehyde slant
column measurements
G. Pinardi et al.
Title Page
Abstract Introduction
Conclusions References
Tables Figures
◭ ◮
◭ ◮
Back Close
Full Screen / Esc
Printer-friendly Version Interactive Discussion
Discussion
P
a
per
|
Dis
cussion
P
a
per
|
Discussion
P
a
per
|
Discussio
n
P
a
per
|
To further explore the potential of this extended fitting interval on our HCHO MAX-DOAS retrievals, additional sensitivity tests were performed. Results again show large instabilities with respect to the Ring effect interference. This is illustrated in Fig. 16a, b, c where the HCHO DSCD retrieved in the 333–358 nm interval with a 5th order polyno-mial and O4Greenblatt et al. dataset, is displayed for different elevation angles and for
5
different choices of the Ring cross-sections. As can be seen, the diurnal behaviour of the retrieved HCHO DSCDs has a large dependence on the source of the Ring cross-section used in the DOAS fit, and the corresponding HCHO VCDs calculated using the two methods introduced in Sect. 4.1 are generally inconsistent. These results sug-gest that the extended fitting interval that minimizes the BrO-HCHO interference is also
10
more sensitive to Ring effect misfits. Therefore, any attempt to use this interval should be made with great care.
4.4 Recommended analysis settings
The sensitivity studies performed on BIRA data of 4 July 2009 revealed several possible optimisations of the HCHO DOAS retrieval, in order to minimise interferences and
mis-15
fits related to polynomial order, Ring effect and O4and BrO absorption cross-sections. Compared to the settings used during the intercomparison exercise and presented in Table 2, the use of a 5th degree polynomial and the wavelength corrected O4Greenblatt et al. (1990) cross-section is recommended. Applied in the 336.5–359 nm wavelength interval, these changes reduce instabilities related to the Ring effect and lead to more
20
AMTD
5, 6679–6732, 2012MAXDOAS formaldehyde slant
column measurements
G. Pinardi et al.
Title Page
Abstract Introduction
Conclusions References
Tables Figures
◭ ◮
◭ ◮
Back Close
Full Screen / Esc
Printer-friendly Version Interactive Discussion
Discussion
P
a
per
|
Dis
cussion
P
a
per
|
Discussion
P
a
per
|
Discussio
n
P
a
per
|
5 Error budget
The total uncertainties on the HCHO DSCDs retrieval can be divided into two cate-gories: (1) the random errors mostly caused by measurement noise, and (2) errors affecting the slant columns in a systematic way.
5.1 Random uncertainties
5
Random errors in DOAS observations are primarily related to the measurement noise which, for silicon array detectors, is generally limited by the photon shot noise. Assum-ing that the errors of the individual detector pixels are uncorrelated and that the DOAS fit residuals are dominated by instrumental noise, the random contribution to the DSCD error can be derived from the DOAS least-squares fit error propagation (e.g. Stutz and
10
Platt, 1996). Random errors are then adequately represented by the slant column fit errors. Any deviation with respect to these assumptions generally results in an overesti-mation of the random error, so one can consider to a first approxioveresti-mation that the DOAS DSCD error constitutes an upper limit of the true random error. For the instruments in-volved in this exercise, slant column errors varying between∼1×10¹⁵molec cm2and
15
∼2×10¹⁶molec cm2 were reported by the different groups as illustrated in Fig. 17a
for 4 July 2009 at SZA less than 75◦. As expected, scientific grade instruments (BIRA, Bremen, IUPH, WSU) display small errors of the order of 1×10¹⁵molec cm2while
mini-DOAS types of instruments (e.g. Mainz) are significantly noisier, typical errors reach-ing 5×10¹⁵molec cm2 or more. In order to better compare the actual performances
20
of the different instruments, the DSCD errors were further normalised to a common integration time of 1 min. As can be seen in Fig. 17c, this largely improves the consis-tency between the scientific-grade instruments, which all display similar noise levels. The NASA and Mainz instruments, which use small and uncooled or less cooled de-tectors (see Table 1) have larger errors as is to be expected. More surprisingly, the
25
AMTD
5, 6679–6732, 2012MAXDOAS formaldehyde slant
column measurements
G. Pinardi et al.
Title Page
Abstract Introduction
Conclusions References
Tables Figures
◭ ◮
◭ ◮
Back Close
Full Screen / Esc
Printer-friendly Version Interactive Discussion
Discussion
P
a
per
|
Dis
cussion
P
a
per
|
Discussion
P
a
per
|
Discussio
n
P
a
per
|
a mechanical slit problem having occurred during the campaign that reduced the signal to 25 % of normal values. Also temperature instabilities have led to systematic features in the residuals that affected DSCD error estimates reported by this group. During part of the campaign, the Bremen instrument had a high frequency structure in the residuals which could be accounted for by using an empirical correction. The problem could not
5
be reproduced in the laboratory after the campaign and appears not to have impacted the NO2and HCHO retrievals. The INTA instrument (not on Fig. 17 because it was not measuring on 4 July) is showing similar level of noise. When normalised to the same integration time as the other instruments, JAMSTEC appears to have been the noisiest system operated during the campaign.
10
5.2 Systematic uncertainties
Several important sources of systematic uncertainty have already been discussed in depth as part of our sensitivity analysis, which led us to propose optimised HCHO re-trieval settings that minimise interference effects involving the polynomial closure term, Ring effect, O4, BrO and HCHO cross-sections. In this section, additional uncertainties
15
are treated with the aim of providing a comprehensive error budget for dDSCDs, as it’s the main parameter of interest for profiling inversion. This includes the impact of sys-tematic uncertainties in absorption cross-sections as well as errors due to calibration uncertainties, in particular the slit function and the wavelength calibration, which are key parameters for DOAS retrievals.
20
5.2.1 Absorption cross-sections
HCHO
Two sources of HCHO absorption cross-sections have been used in the literature, the Cantrell et al. (1990) spectrum and the Meller and Moortgat (2000) dataset. The latter was adopted for our baseline. HITRAN recommends the use of the Cantrell
25
AMTD
5, 6679–6732, 2012MAXDOAS formaldehyde slant
column measurements
G. Pinardi et al.
Title Page
Abstract Introduction
Conclusions References
Tables Figures
◭ ◮
◭ ◮
Back Close
Full Screen / Esc
Printer-friendly Version Interactive Discussion
Discussion
P
a
per
|
Dis
cussion
P
a
per
|
Discussion
P
a
per
|
Discussio
n
P
a
per
|
In the 336.5–359 nm interval and at the resolution of the BIRA spectrometer, the cross-sections differ by approximately 9 %, a difference which was found to propagate directly to the slant column retrievals. The temperature dependence of the HCHO absorption cross-section is small, of the order of 0.05 %◦K−1(De Smedt, 2011) and its effect was neglected here since the Meller and Moortgat cross-section was measured
5
at 293◦K, a temperature representative of ambient conditions during CINDI.
BrO
Two main sources of BrO cross-sections can be found in the literature: Wilmouth et al. (1999) and Fleischmann et al. (2004). These datasets are highly consistent in
10
shape and their use was found to result in very small differences in the HCHO dDSCD, of the order of a few 1014molec cm2. For a median dDSCD of 3.8×10¹⁶molec cm2at 4◦elevation, the difference is therefore less than 2 %.
Ozone 15
The baseline intercomparison settings used the Bogumil et al. (2003) ozone absorption cross-sections. We have tested the impact of using the alternative dataset from Brion, Daumont and Malicet (BDM, Daumont et al., 1992; Malicet et al., 1995). The resulting HCHO dDSCDs were found to be larger by approximately 5×10¹⁵molec cm2. For
a median dDSCD of 3.8×10¹⁶molec cm2at 4◦elevation, the difference is on the order
20
of 13 % during the day.
Ring effect
Although the cross-talk between HCHO and the Ring effect has been strongly reduced using the new baseline settings defined in Sect. 4 (see Fig. 10), some level of
25
AMTD
5, 6679–6732, 2012MAXDOAS formaldehyde slant
column measurements
G. Pinardi et al.
Title Page
Abstract Introduction
Conclusions References
Tables Figures
◭ ◮
◭ ◮
Back Close
Full Screen / Esc
Printer-friendly Version Interactive Discussion
Discussion
P
a
per
|
Dis
cussion
P
a
per
|
Discussion
P
a
per
|
Discussio
n
P
a
per
|
uncertainties on the HCHO DSCD reaches up to 5 to 12 %.
NO2
The baseline intercomparison settings used the Vandaele et al. (1996) NO2absorption cross-sections at 298◦K. Switching to the alternative dataset of Burrows et al. (1998)
5
HCHO DSCDs are found to vary by 2 to 5 %, depending on the NO2content.
O4
The choice of the O4 cross-section has been already largely discussed in Sect. 4.2. Adopting the Greenblatt et al. (1990) dataset, which minimises inconsistencies in the
10
BrO slant columns, we further neglect residual errors related to O4. It should be noted that in this study, a wavelength axis corrected version of the Greenblatt et al. dataset has been used (see e.g. Wagner et al., 2002), with a shift of−0.2 nm.
5.2.2 Instrumental slit function and wavelength calibration
Uncertainties in key instrumental calibration parameters may also be important. For
15
example, imperfect characterisation of the slit function can lead to errors in the HCHO retrieval due to inappropriate convolution of the laboratory absorption cross-sections. This effect was tested by changing slightly the width of the measured slit function of the BIRA instrument (changes of ± 0.04 nm around the measured value of 0.38 nm
Gaussian FWHM). This led, e.g. to changes in the HCHO dDSCD at 4◦ elevation of
20
1×10¹⁵molec cm2, corresponding to relative differences of around 2 %. In addition, small perturbations to the wavelength registration of the spectra were introduced in order to test the sensitivity of the retrievals to known uncertainties in the wavelength calibration procedure. Results indicate changes of the order of 2×10¹⁵molec cm2 for
the 4◦ dDSCD (around 5 %) for shifts of 0.02 nm. We therefore conclude that
uncer-25
AMTD
5, 6679–6732, 2012MAXDOAS formaldehyde slant
column measurements
G. Pinardi et al.
Title Page
Abstract Introduction
Conclusions References
Tables Figures
◭ ◮
◭ ◮
Back Close
Full Screen / Esc
Printer-friendly Version Interactive Discussion
Discussion
P
a
per
|
Dis
cussion
P
a
per
|
Discussion
P
a
per
|
Discussio
n
P
a
per
|
Another potentially important source of error already identified in the CINDI NO2 study by Roscoe et al. (2010) is the accuracy of the pointing direction. Since this error source does not affect directly the DOAS evaluations, but more the determination of the corresponding air mass factors, we do not treat it explicitly here. It should of course be considered for a full error analysis of vertical column and/or profile concentration
5
retrieval of HCHO. Another source of error to consider for the profile inversion is the atmospheric noise, due to the temporal and spatial variability of HCHO during the off -axis scan and the clouds interferences.
5.3 Overall error budget
Based on the results discussed above, an overall assessment of the total uncertainties
10
on HCHO dDSCDs has been generated, including the main contributions of system-atic and random errors, and is shown in Fig. 18. The figure summarises the main results from the sensitivity study for an elevation angle of 4◦ with a typical dDSCD of 3.8×10¹⁶molec cm2, which is the median value during the 4 July 2009. For most
cases, the retrieved HCHO dDSCDs fall within 15 % of the values obtained with the
15
optimised settings defined in Sect. 4. Assuming that the different effects are suffi -ciently uncorrelated with each other, we can sum all deviations in quadrature to obtain an estimate of the overall systematic uncertainty, which is represented by the black line in Fig. 18. On this basis, we estimate the total systematic uncertainties on HCHO dDSCDs to be of approximately 20 % for measurements at 4◦ elevation, with a weak
20
dependence on the SZA. Since some of the effects considered in our study are likely to be partly correlated, these values could be considered as upper limits, however, de-spite our efforts to include the most important sources of uncertainties in our sensitivity analysis, the need for possible additional terms cannot be excluded a-priori. Moreover, the results presented here are based on a single day of measurements and are
influ-25
AMTD
5, 6679–6732, 2012MAXDOAS formaldehyde slant
column measurements
G. Pinardi et al.
Title Page
Abstract Introduction
Conclusions References
Tables Figures
◭ ◮
◭ ◮
Back Close
Full Screen / Esc
Printer-friendly Version Interactive Discussion
Discussion
P
a
per
|
Dis
cussion
P
a
per
|
Discussion
P
a
per
|
Discussio
n
P
a
per
|
In Fig. 18, the random error is estimated for a typical integration time of one minute. We distinguish between two typical cases corresponding to low-noise scientific grade instruments and to mini-DOAS types of instruments, respectively. As can be seen for scientific grade instruments, the total errors on individual measurements are largely dominated by the systematic part. For mini-DOAS instruments, both random and
sys-5
tematic uncertainties contribute similarly. As already mentioned, the random uncer-tainty can be reduced by means of longer integration time and, for less sensitive mini-DOAS instruments, a trade-offbetween error and temporal resolution has to be made.
6 Conclusions
HCHO differential slant columns were retrieved from nine different MAXDOAS
instru-10
ments jointly operated during the CINDI campaign in Cabauw, the Netherlands from June to July 2009. This exercise complements the formal semi-blind NO2and O4slant column intercomparison performed during the same campaign (Roscoe et al., 2010). To reduce the impact of uncertainties on retrieval parameters, common DOAS analysis settings were used by the different groups. In addition, 30-min averages were taken
15
to reduce differences in temporal sampling. The HCHO differential slant columns re-trieved by the different groups generally agree within 15 %, which is very satisfactory and almost as good as the agreement obtained for the NO2 and O4 intercomparison (Roscoe et al., 2010). This exercise shows that a large variety of MAXDOAS instru-ments of different grades and sensitivities can consistently measure HCHO columns
20
within acceptable errors. However, while scientific grade instruments clearly demon-strate their ability to provide low-noise measurements at high temporal resolution (less than 30 min), less sensitive mini-DOAS instruments display significantly larger noise, which probably compromises their ability to deliver vertical profile information at the same temporal resolution.
25
AMTD
5, 6679–6732, 2012MAXDOAS formaldehyde slant
column measurements
G. Pinardi et al.
Title Page
Abstract Introduction
Conclusions References
Tables Figures
◭ ◮
◭ ◮
Back Close
Full Screen / Esc
Printer-friendly Version Interactive Discussion
Discussion
P
a
per
|
Dis
cussion
P
a
per
|
Discussion
P
a
per
|
Discussio
n
P
a
per
|
the role of cross-correlation effects involving Ring effect, O4, BrO and HCHO absorp-tion cross-secabsorp-tions and the order of the DOAS closure polynomial. Optimised retrieval settings are proposed with the aim to minimise correlation effects. Furthermore, sys-tematic and random uncertainties are estimated for typical observation conditions. The largest systematic errors are found to be related to the Ring effect and to the
uncer-5
tainties in HCHO and O3absorption cross-sections. We conclude that the overall sys-tematic uncertainty on the HCHO DSCD retrievals is of the order of 20 % with a weak dependence on the solar zenith angle. Total errors are dominated by systematic effects for the scientific grade instruments, while both systematic and random uncertainties contribute at the same level for mini-DOAS-like instruments.
10
Finally, it must be pointed out that issues already identified during the semi-blind NO2 and O4intercomparison (Roscoe et al., 2010) remain largely valid for the present study on HCHO. In particular, the accuracy of slant column measurements crucially depends (especially for low elevation angles) on the accuracy of the pointing direction, which should therefore be checked on a regular basis. Also, the temporal variability in
tropo-15
spheric signals can be large, even if this variability is expected to be less important for HCHO than for NO2. For future MAXDOAS intercomparisons, a better synchronisation of the measurements should be considered to minimise the scatter possibly introduced by differences in measurement time.
Acknowledgements. The authors wish to thank the KNMI staffat Cabauw for their technical
20
assistance and for the infrastructure that was offered during the campaign. The CINDI Cam-paign was funded by ESA and EU, through the CEOS and ACCENT-AT2 projects, respectively. We further acknowledge the support of the EU via the GEOMON Integrated Project. We also thank Isabelle De Smedt and Nicolas Theys for helpful discussions during the preparation of this manuscript. The participation of the Toronto team was supported by the Canadian
Foun-25
dation for Climate and Atmospheric Science and the Centre for Global Change Science at the University of Toronto; the instrument was funded by the Natural Sciences and Engineering Re-search Council and the Canadian Foundation for Innovation, and is usually operated at the Polar Environment Atmospheric Research Laboratory (PEARL) by the Canadian Network for the Detection of Atmospheric Change (CANDAC).
AMTD
5, 6679–6732, 2012MAXDOAS formaldehyde slant
column measurements
G. Pinardi et al.
Title Page
Abstract Introduction
Conclusions References
Tables Figures
◭ ◮
◭ ◮
Back Close
Full Screen / Esc
Printer-friendly Version Interactive Discussion
Discussion
P
a
per
|
Dis
cussion
P
a
per
|
Discussion
P
a
per
|
Discussio
n
P
a
per
|
References
Aliwell, S. R., Van Roozendael, M., Johnston, P. V., Richter, A., and Wagner, T., Arlander, D. W., Burrows, J. P., Fish, D. J., Jones, R. L., Tørnkvist, K. K., Lambert, J.-C., Pfeilsticker, K., and Pundt, I.: Analysis for BrO in zenith-sky spectra: an intercomparison exercise for analysis improvement, J. Geophys. Res., 107, D140, doi:10.1029/2001JD000329, 2002.
5
Bobrowski, N., H ¨onninger, G., Galle, B., and Platt, U.: Detection of bromine monoxide in a vol-canic plume, Nature, 423, 273–276, doi:10.1038/nature01625, 2003.
Bogumil, K., Orphal, J., Homann, T., Voigt, S., Spietz, P., Fleischmann, O. C., Vogel, A., Hart-mann, M., BovensHart-mann, H., Frerik, J., and Burrows, J. P.: Measurements of molecular ab-sorption spectra with the SCIAMACHY pre-flight model: instrument characterization and
ref-10
erence spectra for atmospheric remote sensing in the 230–2380 nm region, J. Photoch. Pho-tobio. A., 157, 167–184, 2003.
Brinksma, E. J., Pinardi, G., Volten, H., Braak, R., Richter, A., Schoenhardt, A., Van Roozen-dael, M., Fayt, C., Hermans, C., Dirksen, R. J., Vlemmix, T., Berkhout, A. J. C., Swart, D. P. J., Oetjes, H., Wittrock, F., Wagner, T., Ibrahim, O., de Leeuw, G., Moerman, M., Curier, R. L.,
15
Celarier, E. A., Cede, A., Knap, W. H., Veefkind, J. P., Eskes, H. J., Allaart, M., Rothe, R., Piters, A. J. M., and Levelt, P. F.: The 2005 and 2006 DANDELIONS NO2and aerosol inter-comparison campaigns, J. Geophys. Res., 113, D16S46, doi:10.1029/2007JD008988, 2008. Burrows, J. P., Dehn, A., Deters, B., Himmelmann, S., Richter, A., Voigt, S., and Orphal, J.:
Atmospheric remote-sensing reference data from GOME: Part 1. Temperature-dependent
20
absorption cross-sections of NO2 in the 231–794 nm range, J. Quant. Spectrosc. Ra., 60, 1025–103, 1998.
Cantrell, C. A., Davidson, J. A., McDaniel, A. H., Shetter, R. E., and Calvert, J. G.: Temperature-dependent formaldehyde cross sections in the near ultraviolet spectra region, J. Phys. Chem., 94, 3902–3908, 1990.
25
Chance, K. and Kurucz, R. L.: An improved high-resolution solar reference spectrum for Earth’s atmosphere measurements in the ultraviolet, visible, and near infrared, available at: http: //www.cfa.harvard.edu/atmosphere (last access: July 2011), 2010.
Chance, K. and Orphal, J.: Revised ultraviolet absorption cross sections of H2CO for the HI-TRAN database, J. Quant. Spectrosc. Ra., 112, 1509–1510, doi:10.1016/j.jqsrt.2011.02.002,
30
AMTD
5, 6679–6732, 2012MAXDOAS formaldehyde slant
column measurements
G. Pinardi et al.
Title Page
Abstract Introduction
Conclusions References
Tables Figures
◭ ◮
◭ ◮
Back Close
Full Screen / Esc
Printer-friendly Version Interactive Discussion
Discussion
P
a
per
|
Dis
cussion
P
a
per
|
Discussion
P
a
per
|
Discussio
n
P
a
per
|
Chance, K. V. and Spurr, R. J. D.: Ring effect studies: rayleigh scattering, including molecular parameters for rotational Raman scattering, and the Fraunhofer spectrum, Appl. Optics, 36, 5224–5230, 1997.
Chance, K., Palmer, P. I., Spurr, R. J., Martin, R. V., Kurosu, T. P., and Jacob, D. J.: Satellite observations of formaldehyde over North America from GOME, Geophys. Res. Lett., 27,
5
3461–3464, 2000.
Cl ´emer, K., Fayt, C., Hendrick, F., Hermans, C., Pinardi, G., Van Roozendael, M.: The simulta-neous retrieval of tropospheric aerosol extinction and NO2vertical profiles from MAXDOAS measurements in Beijing, in: Proceedings of the 8th International Symposium on Tropo-spheric Profiling, ISBN 978-90-6960-233-2, Delft, The Netherlands, 19–23 October 2009,
10
2009.
Cl ´emer, K., Van Roozendael, M., Fayt, C., Hendrick, F., Hermans, C., Pinardi, G., Spurr, R., Wang, P., and De Mazi `ere, M.: Multiple wavelength retrieval of tropospheric aerosol opti-cal properties from MAXDOAS measurements in Beijing, Atmos. Meas. Tech., 3, 863–878, doi:10.5194/amt-3-863-2010, 2010.
15
Curci, G., Palmer, P. I., Kurosu, T. P., Chance, K., and Visconti, G.: Estimating European volatile organic compound emissions using satellite observations of formaldehyde from the Ozone Monitoring Instrument, Atmos. Chem. Phys., 10, 11501–11517, doi:10.5194/acp-10-11501-2010, 2010.
Daumont, M., Brion, J., Charbonnier, J., and Malicet, J.: Ozone UV spectroscopy, I: absorption
20
cross-sections at room temperature, J. Atmos. Chem., 15, 145–155, 1992.
Demoulin, P., Zander, R., Melen, F., Mahieu, E., and Servais, C.: Column abundance mea-surements of formaldehyde above the Jungfraujoch, in: Proceedings of “Atmospheric Spec-troscopy Applications 1999”, Reims, France, 1–3 September 1999, 59–62, 1999.
De Smedt, I.: Long-term global observations of tropospheric formaldehyde retrieved from
25
spaceborne nadir uv sensors, Ph.D. thesis, ULB (Universit ´e Libre de Bruxelles), Brussels, 2011.
De Smedt, I., M ¨uller, J.-F., Stavrakou, T., Van der A, R., Eskes, H., and Van Roozendael, M.: Twelve years of global observations of formaldehyde in the troposphere using GOME and SCIAMACHY sensors, Atmos. Chem. Phys., 8, 4947–4963, doi:10.5194/acp-8-4947-2008,
30
2008.
de-AMTD
5, 6679–6732, 2012MAXDOAS formaldehyde slant
column measurements
G. Pinardi et al.
Title Page
Abstract Introduction
Conclusions References
Tables Figures
◭ ◮
◭ ◮
Back Close
Full Screen / Esc
Printer-friendly Version Interactive Discussion
Discussion
P
a
per
|
Dis
cussion
P
a
per
|
Discussion
P
a
per
|
Discussio
n
P
a
per
|
velopment of an operational product, in: Proceedings of the 2009 EUMETSAT Meteorological Satellite Conference, Bath, UK, 20–25 September 2009, 2009.
De Smedt, I., Stavrakou, T., M ¨uller, J.-F., Van Der A, R. J., and Van Roozendael, M.: Trend detection in satellite observations of formaldehyde tropospheric columns, Geophys. Res. Lett., 37, L18808, doi:10.1029/2010GL044245, 2010.
5
Fleischmann, O. C., Hartmann, M., Burrows, J. P., and Orphal, J.: New ultraviolet absorption cross-sections of BrO at atmospheric temperatures measured by time-windowing Fourier transform spectroscopy, J. Photoch. Photobio. A, 168, 117–132, 2004.
Fraser, A., Adams, C., Drummond, J. R., Goutail, F., Manney, G., and Strong, K.: The polar environment atmospheric research laboratory UV-visible ground-based spectrometer: first
10
measurements of O3, NO2, BrO, and OClO columns. J. Quant. Spectrosc. Ra., 110, 986– 1004, doi:10.1016/j.jqsrt.2009.02.034, 2009.
Fried, A., Cantrell, C., Olson, J., Crawford, J. H., Weibring, P., Walega, J., Richter, D., Junker-mann, W., Volkamer, R., Sinreich, R., Heikes, B. G., O’SulliVan, D., Blake, D. R., Blake, N., Meinardi, S., Apel, E., Weinheimer, A., Knapp, D., Perring, A., Cohen, R. C., Fuelberg, H.,
15
Shetter, R. E., Hall, S. R., Ullmann, K., Brune, W. H., Mao, J., Ren, X., Huey, L. G., Singh, H. B., Hair, J. W., Riemer, D., Diskin, G., and Sachse, G.: Detailed comparisons of airborne formaldehyde measurements with box models during the 2006 INTEX-B and MILAGRO campaigns: potential evidence for significant impacts of unmeasured and multi-generation volatile organic carbon compounds, Atmos. Chem. Phys., 11, 11867–11894,
20
doi:10.5194/acp-11-11867-2011, 2011.
Frieß, U., Monks, P. S., Remedios, J. J., Rozanov, A., Sinreich, R., Wagner, T., and Platt, U.: MAX-DOAS O4 measurements: a new technique to derive information on atmospheric aerosols: 2. Modeling studies, J. Geophys. Res., 111, D14203, doi:10.1029/2005JD006618, 2006.
25
Frieß, U., Sihler, H., Sander, R., P ¨ohler, D., Yilmaz, S., and Platt, U.: The vertical distribution of BrO and aerosols in the Arctic: measurements by active and passive differential optical ab-sorption spectroscopy, AGU, J. Geophys. Res., 116, D00R04, doi:10.1029/2011JD015938, 2011.
Grainger J. F. and Ring, J.: Anomalous Fraunhofer line profiles, Nature, 193, 762,
30
doi:10.1038/193762a0, 1962.