www.atmos-chem-phys.net/9/6581/2009/ © Author(s) 2009. This work is distributed under the Creative Commons Attribution 3.0 License.
Chemistry
and Physics
Microphysical and optical properties of Arctic mixed-phase clouds.
The 9 April 2007 case study.
J.-F. Gayet1, G. Mioche1, A. D¨ornbrack2, A. Ehrlich3,*, A. Lampert4, and M. Wendisch3,*
1Laboratoire de M´et´eorologie Physique, Universit´e Blaise Pascal, Clermont-Ferrand, France 2Institute for Atmospheric Physics, DLR Oberpfaffenhofen, Wessling, Germany
3Johannes Gutenberg University, Institute for Atmospheric Physics, Mainz, Germany 4Alfred Wegener Institute for Polar and Marine Research, Potsdam, Germany
*now at: University of Leipzig, Leipzig Institute for Meteorology (LIM), Leipzig, Germany
Received: 14 April 2009 – Published in Atmos. Chem. Phys. Discuss.: 6 May 2009 Revised: 3 July 2009 – Accepted: 22 July 2009 – Published: 10 September 2009
Abstract. Airborne measurements in Arctic
boundary-layer stratocumulus were carried out near Spitsbergen on 9 April 2007 during the Arctic Study of Tropospheric Aerosol, Clouds and Radiation (ASTAR) campaign. A unique set of co-located observations is used to describe the cloud proper-ties, including detailed in situ cloud microphysical and radia-tion measurements along with airborne and co-located space-borne remote sensing data (CALIPSO lidar and CloudSat radar). CALIPSO profiles indicate cloud top levels at tem-perature between−24◦C and−21◦C. In situ measurements confirm that the cloud-top lidar attenuated backscatter sig-nal along the aircraft trajectory is linked with the presence of liquid water, a common feature observed in Arctic mixed-phase stratocumulus clouds. A low concentration of large ice crystals is also observed up to the cloud top resulting in significant CloudSat radar echoes. Since the ratio of the ex-tinction of liquid water droplets to ice crystals is high, broad-band radiative effects near the cloud top are mostly domi-nated by water droplets. CloudSat observations and in situ measurements reveal high reflectivity factors (up to 15 dBZ) and precipitation rates (1 mm h−1). This feature results from
efficient ice growth processes. About 25% of the theoreti-cally available liquid water is converted into ice water with large precipitating ice crystals. Using an estimate of mean cloud cover, a considerable value of 106m3h−1of fresh wa-ter could be settled over the Greenland sea pool. European Centre for Medium-Range Weather Forecast (ECMWF) op-erational analyses reproduces the boundary layer height vari-ation along the flight track. However, small-scale features
Correspondence to:J.-F. Gayet ([email protected])
in the observed cloud field cannot be resolved by ECMWF analysis. Furthermore, ECMWF’s diagnostic partitioning of the condensed water into ice and liquid reveals serious short-comings for Arctic mixed-phased clouds. Too much ice is modelled.
1 Introduction
al. (2002), Dong and Mace (2003) and Zuidema et al. (2005). There have also been a number of modeling studies published in the last year through analysis of a couple of case studies of single- and multi-layer mixed-phase clouds during M-PACE (Morrison et al., 2008; Fridlind et al., 2007).
The microphysical properties of Arctic clouds are diffi-cult to retrieve from satellite remote sensing because they are very complex and are often composed of solid and liquid water (mixed-phase clouds). Spherical liquid droplets scatter and absorb/emit atmospheric radiation differently compared to solid ice crystals which are mostly nonspherical. This is one of the reasons why the largest errors in ISCCP (Interna-tional Satellite Cloud Climatology Project, 2007) cloud cli-matology occur in the polar region (Rossow et al., 1993). Due to the recent active remote observations from space (Cloud-Aerosol Lidar and Infrared Pathfinder Satellite Ob-servations, CALIPSO, Winker and Trepte, 2007, and Cloud-Sat, Stephens et al., 2002) much more detailed cloud obser-vations are now available. However, serious improvements in satellite retrievals are still hampered, mainly due to the lack of evaluation from dedicated field experiments.
Within this context the Arctic Study of Tropospheric Aerosol, Clouds and Radiation (ASTAR) 2007 project fo-cused on detailed in situ characterisation of microphysical and optical properties of Arctic mixed-phase clouds. The observations allow aerosol-cloud interactions to be studied as well as cloud-radiation interactions and to develop ade-quate methods to validate cloud parameters retrieved from CALIPSO/CloudSat satellite remote sensing techniques.
This paper focusses on observations obtained from a com-bination of instruments installed onboard the Polar-2 aircraft operated by the Alfred Wegener Institute for Polar and Ma-rine Research (AWI). These instruments include: a Polar Nephelometer (Gayet et al., 1997), a Cloud Particle Imager (CPI, Lawson et al., 2001) as well as standard Forward Scat-tering Spectrometer Probe (FSSP-100) to measure cloud par-ticle properties in terms of scattering, morphology and size, and in-cloud partitioning of ice/water content. Remote sens-ing measurements were obtained onboard the Polar-2 aircraft from the Airborne Mobile Aerosol Lidar (AMALi, Stach-lewska et al., 2004) and the Spectral Modular Airborne Radi-ation measurement sysTem (SMART, Wendisch et al., 2001). The paper describes in detail the microphysical and op-tical properties of a mixed-phase boundary-layer cloud ob-served on 9 April 2007. A unique set of concomitant obser-vations is used for this description, including detailed in situ measurements along with airborne remote sensing observa-tions and co-located spaceborne remote sensing data (Lidar on CALIPSO and radar on CloudSat satellites). Observations are then compared to European Centre for Medium-Range Weather Forecasts (ECMWF) analyses.
2 Instrumentation, weather situation and flight
procedure
2.1 Instrumentation
ASTAR 2007 was carried out from 25 March to 19 April 2007, employing the specially equipped AWI Dornier 228-101 aircraft (Polar-2). The research aircraft was instru-mented with common instruments for measurements of basic meteorological parameters along the flight track. The instru-ments used for the determination of microphysical and op-tical properties of Arctic clouds included three independent techniques: (1) the Polar Nephelometer, (2) the Cloud Par-ticle Imager (CPI) and (3) the PMS FSSP-100 probe. The combination of these techniques provides a description of particles within a diameter range varying from a few microm-eters (typically 3µm) to about 2 mm.
The accuracies of measurements could be hampered by the shattering of ice crystals on probes with shrouded in-let (Polar Nephelometer, CPI and FSSP for instance) (Ko-rolev and Isaac, 2005; Heymsfield, 2007; McFarquhar et al., 2007b). For particle diameters larger than about 100µm, the number of shattered particles increases with the concentra-tion of large particles. Techniques have been proposed by Field et al. (2003, 2006) to separate real and artifact-shattered crystals from information of ice particle inter-arrival times, making objective corrections possible. New particle image probes with high pixel resolution may also be used to quan-tify the contribution of shattering to particle size distributions and optical properties (R. P. Lawson, personal communica-tion, 2008). However, these instruments were not available for the present study. The possible effects of ice-crystal shat-tering on the present study will be discussed together with the results below.
The Polar Nephelometer (Gayet et al., 1997) measures the scattering phase function of an ensemble of cloud particles (i.e., water droplets or ice crystals or a mixture of these parti-cles ranging in size from a few micrometers to about 1 mm in diameter). Direct measurement of the scattering phase func-tion allows the discriminafunc-tion of particle shapes (spherical liquid water droplets or nonspherical ice crystals) and the calculation of the integrated optical parameters (such as ex-tinction coefficient and asymmetry parameter, see Gayet et al., 2002). The accuracies of the extinction coefficient and asymmetry parameter derived from the Polar Nephelometer are estimated to be within 25% and 4%, respectively (Gayet et al., 2002). These measurement uncertainties could be af-fected by ice-crystal shattering on the probe inlet.
in the sample area of 2.3µm, so particles of sizes ranging from approximately 10µm to 2 mm are imaged. The shadow depth of each pixel can be expressed in up to 256 grey levels; the refreshing rate of the CCD camera is 40 Hz. A video-processing tool identifies and sizes particles within the pixel array, saving only the regions of interest. The CPI images were processed using the software developed at the Labora-toire de M´et´eorologie Physique (LaMP, Lef`evre, 2007). This software is based on the manual of the original CPIview soft-ware (see CPIview, 2005; Lawson et al., 2001; Baker and Lawson, 2006). Moreover, it provides additional information on the ice-particle morphology that is not available from the CPIview software. Our software uses the method proposed by Lawson et al. (2006) for the determination of the ice wa-ter content from two-dimensional particle imagery. Without available 2D-C measurements (see Appendix A) the CPI data were used in order to derive particle size distributions and microphysical parameters as Gallagher et al. (2005) in cirrus clouds. The method of calibration of the CPI is described in Appendix A with some results of comparison with 2D-C data obtained during the POLAR2D-CAT experiment (Law et al., 2008). The resulting uncertainties on CPI derived micro-physical parameters are found of the same order as the 2D-C, i.e. 75%, 100% and 110% on particle concentration, ice wa-ter content and precipitation rate, respectively.
The FSSP-100 instrument was also installed on the Polar-2 aircraft. It provides information on droplet size distribution for the size range of 2–47µm (Knollenberg, 1981; Baum-gardner et al., 2002). The accuracies of the derived extinction coefficient and liquid water content have been estimated as 20% and 30%, respectively. Referring to the effects of shat-tering of ice crystals on FSSP data, the bulk parameters could be overestimated by about 15–20% (Heymsfield, 2007) and the particle concentration by a factor of 2 or 3 (Field et al., 2003). Similar measurement uncertainties due to shattering effects are expected for CPI data.
The Airborne Mobile Aerosol Lidar (AMALi) was oper-ated onboard the Polar-2 aircraft in nadir configuration to probe the backscatter and depolarization properties of the atmosphere below the aircraft. The instrument, its perfor-mance and the retrieving technique for the final products are described by Stachlewska (2004, 2006) and Lampert et al. (2009). The Polar-2 aircraft was further equipped with the Spectral Modular Airborne Radiation measurement sysTem (SMART, Wendisch et al., 2001) for spectral solar radiation measurements to derive cloud radiative properties (Ehrlich et al., 2008).
2.2 Meteorological situation
The observations discussed in this paper were obtained dur-ing the Polar-2 flight on 9 April 2007 between 08:30 and 10:50 UTC over the Greenland Sea in the vicinity of the West coast of Svalbard as displayed on Fig. 1. This figure rep-resents the visible image of the Moderate-resolution
Imag-CALIPSO track
Polar 2 flight trajectory
Interception (10:06 UTC)
LYR A
B
Fig. 1. Satellite picture taken on 9 April 2007 at 10:06 UTC by MODIS (visible channel). The Polar-2 flight trajectory between the way points A and B is superimposed to the CALIPSO/CLOUDSAT overpasses. The Polar-2 interception point with the satellite track is indicated. LYR is the location of Longyearbyen.
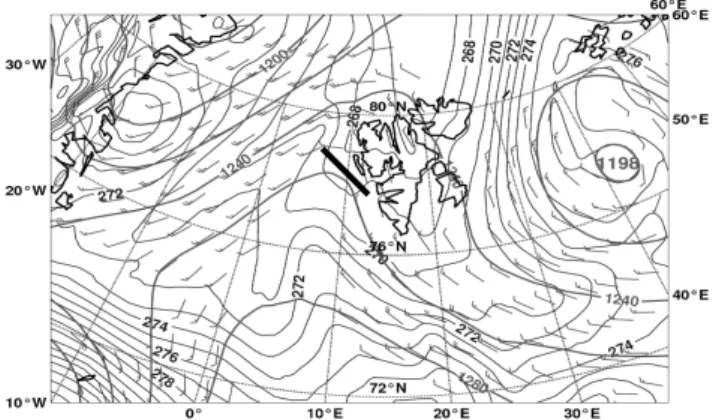
ing Spectroradiometer (MODIS) satellite at 10:06 UTC and gives an overview of the cloud situation. The weather sit-uation on that day has already been described by Richter et al. (2008). The meteorological data are taken from op-erational ECMWF analyses. Figure 2 represents geopoten-tial height (in gpdm), equivalent potengeopoten-tial temperature and wind speed and direction at 850 hPa level on 9 April 2007 at 12:00 UTC. The approximate location of the airborne obser-vations is indicated by a thick black line.
On the back of a slowly north-eastward propagating trough, cold air was ejected from higher latitudes towards Svalbard. This cold-air outbreak was associated with clouds forming south of the ice edge and extending far south (see Fig. 1). On 9 April 2007, a ridge built up west of Sval-bard and disrupted the cold air outflow. After the passage of the ridge axis, warmer and moister tropospheric air from the South replaced the cold air masses from the North.
2.3 Flight procedure
Fig. 2. Geopotential, wind vector and potential temperature fields obtained from the ECMWF analysis at 850 hPa for 12:00 UTC. The black line represents the airborne observation area.
and optical properties of the cloud layer along a horizontal distance of about 250 km, heading towards the way point B (see Fig. 1).
We note in passing that to reduce inherent errors in com-paring quasi-instantaneous spaceborne observations and air-craft measurements carried out during a much longer dura-tion, the flight trajectory was corrected. The method con-sisted to project the flight path onto the CALIPSO/CloudSat vertical plane by considering the mean wind advection at the corresponding levels and the time difference between satel-lite and in situ measurements.
In the following section the microphysical and optical properties of the mixed-phase boundary-layer cloud are de-scribed and linked with the meteorological situation. The concomitant observations are associated with co-located spaceborne remote sensing data, i.e. CALIOP (Cloud-Aerosol Lidar operated at 532 nm and 1064 nm wavelengths with Orthogonal Polarisation at 532 nm) on CALIPSO satel-lite (Winker et al., 2003) and cloud profiling radar operated at 94 GHz on CloudSat satellite (Stephens et al., 2002). The observations are then compared with the ECMWF analyses.
3 Cloud microstructure
The vertical structure of the Arctic mixed-phase cloud ob-served here is first discussed in terms of liquid water phase (supercooled water droplets, see Sect. 3.1) and then in terms of ice water phase (precipitating ice crystals, Sect. 3.2). The liquid water/solid ice phases have been discriminated ac-cording to the asymmetry parameter (g), i.e. liquid water droplets have typical values ofg>0.8 whereas ice crystals have lower g-values (Gayet et al., 2002). In other words and considering visible wavelengths, the first case addresses clouds that can optically be regarded as consisting of liq-uid water droplets, as the possible occurrence of ice crystals does not significantly affect the optical properties, whereas
in the second case the ice-phase is optically dominant with only a weak contribution of possible water droplets on opti-cal properties.
3.1 Liquid water-phase
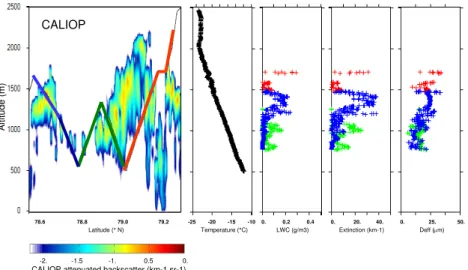
Figure 3a (left panel) displays CALIOP attenuated backscat-ter profile (532 nm channel) at 10:06 UTC along the satel-lite track represented on Fig. 1 between latitudes 78.55◦N and 79.25◦N. The superimposed colored lines represent the Polar-2 flight altitude along the trajectory represented on Fig. 1. The aircraft trajectory has been corrected for advec-tion according to the mean wind vector (8 m/s, 250◦) in order
to reduce inherent errors in comparing quasi-instantaneous spaceborne observations and aircraft measurements carried out during 1 h approximately. The four panels on Fig. 3a display the vertical profiles of several parameters obtained during the Polar-2 ascent-descent sequences. They are: the air temperature, the liquid water content (LWC), the extinc-tion coefficient and the cloud effective diameter respectively. These three last parameters were derived from the FSSP-100 data. Without a bulk water probe, the consistency of the FSSP measurements was verified by comparing the extinc-tion coefficient derived with the Polar Nephelometer data. The results show (not presented here) that the slope parame-ter (0.95) is close to a perfect agreement and the dispersion of the data points (∼20%) is within the probe uncertainties.
CALIOP measurements indicate a cloud top altitude which varies from 2200 m to 1700 m. The corresponding temperatures are−24◦C and−21◦C respectively. The strong
-25 -20 -15 -10 0. 0.2 0.4 0. 20. 40. 0. 25. 50. 78.6 78.8 79.0 79.2
Temperature (°C) LWC (g/m3) Extinction (km-1) Deff (μm) Latitude (° N)
CALIOP
Altitude (m)
CALIOP attenuated backscatter (km-1 sr-1)
-2. -1.5 -1. 0.5 0. CALIOP
Fig. 3a. CALIOP attenuated backscatter profile (532 nm channel) at 10:06 UT along the satellite track represented on Fig. 1 between
latitudes 78.55◦N and 79.25◦N. In colored line is superimposed the Polar-2 flight altitude. The four panels display the vertical profiles of
the following parameters obtained during the Polar-2 ascent-descent sequences: air temperature, liquid water content, extinction coefficient and the effective diameter respectively. The symbols are colored according to the flight sequences.
adiabatic LWC at the highest cloud top level detected by CALIOP (2200 m) is 0.6 g/m3, a significantly higher value
than the observations. This subadiabatic LWC feature is mainly caused by the fractional cloudiness as evidenced from CALIOP observations and by efficient glaciation processes which deplete liquid water as discussed in Sect. 3.3 below (Bergeron-Findeisen process).
The left panel in Fig. 3b displays the FSSP-100 and CPI particle size distributions (averaged over the flight sequence on Fig. 3a). The upper-right panel represents the average scattering phase function (without normalization in units of
µm−1sr−1) measured by the Polar Nephelometer (filled-circle symbols) and the theoretical phase function (cross symbols) calculated from the FSSP-100 size distribution as-suming (spherical) cloud droplets. The mean values of the parameters (see left panel in Fig. 3b) indicate cloud droplet concentration (40 cm−3), liquid water content (0.06 g m−3), extinction coefficient (10 km−1), effective diameter (18µm), asymmetry parameter (0.838) and ice concentration of par-ticle with D>50µm (1.2 l−1). The upper-right panel of Fig. 3b shows that the calculated phase function agrees very well at all scattering angles with the observations from the Polar Nephelometer. In other words, the modeled value of the extinction coefficient matches with the measured one. We note in passing the very good consistency of the two inde-pendent measurements. This also means that Polar Neph-elometer measurements are likely not affected by the pres-ence of ice-crystals detected by the CPI since the liquid water (FSSP-100) to ice crystals (CPI) extinction ratio is about 100 (10 km−1/0.1 km−1). Subsequently the FSSP-100 cloud droplet measurements do not seem to be significantly contaminated by ice-crystal shattering effects due to a low
concentration of ice particles with diameter larger than 100µm (<0.5 l−1). Likewise the droplet shattering seems
unlikely, due to a low concentration of cloud droplets (∼40 cm−3).
3.2 Ice phase
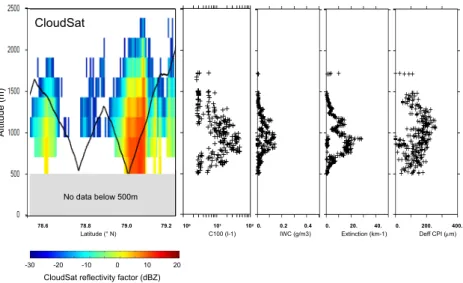
Figure 4a (left panel) displays the reflectivity factor of Cloud-Sat radar at 10:06 UTC along the satellite track represented on Fig. 1 between latitudes 78.55◦N and 79.25◦N. The Polar-2 flight altitude is superimposed to the reflectivity fac-tor with a black line. The four panels on Fig. 4a display the vertical profiles of the following parameters: the concen-tration of ice particles (D>100µm), the ice water content (IWC), the extinction coefficient and the effective diameter (Deff). As in Fu (1996) and Francis et al. (1994) the effec-tive diameter definition in this study is proportional to the volume/area ratio of ice crystals (Gayet et al., 2004). These parameters were derived from the CPI data. It should be no-ticed that the in situ parameters reported on Figs. 3a and 4a originate from simultaneous measurements carried out along the flight track and are separated on the base of g-values.
Diameter (μm) Scattering angle (°)
Concentrati
on (l-1
μ
m-1)
Angu
la
r
sca
tte
ring
c
oeffic
ient (
μ
m-1 sr-1)
Droplet conc. : 40 cm-3 LWC : 0.06 g/m3
Extinction : 10 km-1
Deff : 18.0 μm
g : 0.838
Ice part. conc : 1.2 l-1
Fig. 3b.Liquid water-phase cloud properties.
Right panel: Mean scattering phase function measured by the Polar Nephelometer (circle symbols) and scattering phase function obtained by Mie theory (cross symbols) calculated with the average droplet size distribution measured by the FSSP-100 over the same time-period. Left panel: FSSP-100 and CPI mean size-distributions. Are also reported the mean values of the pertinent microphysical and optical
parame-ters (Cloud droplet concentration, LWC: liquid water content, extinction coefficient, Deff: effective diameter,g: asymmetry parameter). The
concentration of ice particles calculated from the CPI is also indicated.
100 101 102 0. 0.2 0.4 0. 20. 40. 0. 200. 400.
78.6 78.8 79.0 79.2
C100 (l-1) IWC (g/m3) Extinction (km-1) Deff CPI (μm)
Latitude (° N)
-30 -20 -10 0 10 20 CloudSat reflectivity factor (dBZ)
A
ltitude (m)
CloudSat
No data below 500m CloudSat
Fig. 4a. CloudSat Reflectivity factor profile at 10:06 UT along the satellite track represented on Fig. 1 between latitudes 78.55◦N and
79.25◦N. The black line represents the Polar-2 flight altitude. The four panels display the vertical profiles of the following parameters
obtained during the Polar-2 ascent-descent sequences : concentration ice particles (D>100µm), ice water content, extinction coefficient and
the effective diameter of ice particles (all these parameters are calculated from the CPI instrument).
performed during the first descent-sequence through the high radar echo core (see Fig. 4a). The CloudSat signal is corre-lated with ice precipitation since concomitant in situ mea-surements reveal the presence of large ice crystals with ef-fective diameter ranging from about 100µm to 200µm and a mean asymmetry factor of 0.778. This feature has already been observed in Arctic mixed-phase clouds (see among oth-ers Shupe et al., 2006). The largest values of ice parti-cle concentration (50 l−1), IWC (0.15 g/m3) and extinction (30 km−1) are observed at an altitude of about 1000 m when
the aircraft reaches the middle of the radar echo core. We re-call that the ice particle concentration and extinction could be significantly overestimated by effects of shattering of large ice crystals which are observed in this area (up to 2 mm).
It should be noticed that large ice crystals (Deff∼100µm, max. size ∼800µm) are observed up to the cloud top but with a lower concentration (∼2 l−1). This feature explains the observations of radar echoes from CloudSat up to the top of the cloud layer.
(see examples on Fig. 5b) whereas side-plane and irregu-lar ice crystals are observed near the lowest sampled cloud level (500 m/−12◦C, Fig. 5c). Compared to the results
from Korolev et al. (1999) who found that only two per-cent of ice crystals observed in the Arctic are pristine (faceted single crystals) our case study indicates that sin-gle columns and plates (i.e. pristine ice crystals) dominate (∼50%) the particle shape near −20◦C. Differences in ice particle shape occurrence are also found with regards to the results by McFarquhar et al. (2007) in a similar tem-perature range from −12◦C to −15◦C. They mostly ob-served rosette shapes whereas prevalent dendrites (∼40%) with fewer rosette shape (10%) characterize our case study.
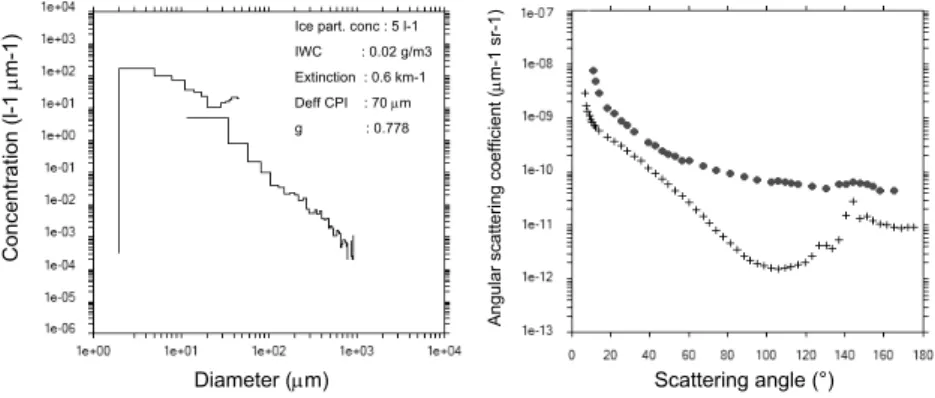
Figure 4b summarizes the microphysical and optical prop-erties of the ice water-phase of the Arctic layer cloud. As-suming that the FSSP probe measures only water droplets, the comparison of the measured phase function and the the-oretically calculated one for the assumed pure water cloud shows (see Fig. 4b, right panel) that scattering by ice par-ticles is considerably stronger at all scattering angles, and particularly at side angles between 60◦and 130◦, leading to
a significantly smaller g-value (0.778) than for the scattering by water clouds. This result confirms the findings by Sassen and Liou (1979) for the mixed-phase clouds formed in their laboratory experiments and those by Gayet et al. (2002) from in situ measurements. Furthermore, the small bump near 145◦ on the measured scattering phase function suggests the presence of a relatively small amount of water droplets which still contribute to the scattering properties. This fea-ture may be qualitatively confirmed by the FSSP measure-ments which evidence a droplet concentration of 2 cm−3and an effective diameter of 23µm. Nevertheless, because of the presence of a relatively large concentration of ice crys-tals larger than 100µm (5 l−1), FSSP-100 and Polar
Neph-elometer measurements are very likely contaminated by ice crystal shattering, which cannot be quantitatively evaluated without specific instruments such as the Fast-FSSP (Field et al., 2003) and the 2D-S (Lawson et al., 2008). According to the CPI measurements, the mean values of the parame-ters (see Fig. 4b) indicate concentration of ice particle larger than 100µm (5 l−1), ice water content (0.02 g m−3), extinc-tion coefficient (0.6 km−1), effective diameter (70µm from CPI) and asymmetry parameter (0.778).
3.3 Discussion of observations
Compared to the results from McFarquhar et al. (2007) ob-tained near Barrow (Alaska) in mixed-phase clouds, the Arc-tic boundary-layer cloud presented here exhibits a deeper water layer (up to∼1000 m versus 580 m) with higher and colder cloud top (2200 m/−24◦C versus 1150 m/−15◦C on the average). The liquid water cloud has similar microphys-ical properties with mean droplet concentration and effec-tive diameter of 40 cm−3 and 18µm respectively, whereas a larger ice particle concentration (5 l−1 versus 2.8 l−1 on
average) is evidenced. The liquid fraction defined by
f l=LWC/(LWC+IWC), is subsequently lower (varying be-tween 0.80 and 0.43 from cloud top to cloud base versus 0.97–0.70) and could indicate a less pronounced dominance of the liquid water phase. Nevertheless most of the data with 0.2<f l<0.8 correspond to the observations carried out through the high echo core (see Fig. 4a) with numerous large ice crystals (up to 50 l−1). Therefore the FSSP-100 measure-ments could likely be contaminated by ice crystal shatter-ing leadshatter-ing to overestimated LWC and subsequent fl-values. From previous studies (Cober et al., 2001; Korolev et al., 2003; McFarquhar et al., 2007) mixed-phase clouds typically
hadf l<0.2 orf l>0.8 with relatively few values in between,
i.e. clouds are dominated either by liquid or by ice.
It is interesting to note that our results are in agreement with those from Garrett et al. (2001) who showed that in Artcic clouds the asymmetry parameter values are decreas-ing from about 0.86 to 0.75 when the fraction of ice particle number varies from 0 (only supercooled water are present) to 1 (glaciated clouds).
An analysis of the results of Figs. 3 and 4 shows that CALIOP and CloudSat observations can be interpreted in terms of cloud microphysical and optical properties. The ob-served mixed-phase cloud exhibits a cloud top layer domi-nated by liquid-water in which ice precipitation was yielded. The visual observation of glory when flying above the cloud layer clearly indicates liquid water cloud droplets. This is a common feature observed in Arctic mixed-phase stratocumu-lus clouds (Hobbs and Rangno, 1998; Lawson et al., 2001; McFarquhar et al., 2007; Verlinde et al., 2007), which was observed even for cloud top temperatures down to−25◦C
during ASTAR. A low concentration of large ice crystals is evidenced up to cloud top and leads to significant Cloud-Sat radar echo (−5 dbZ). Since the liquid water (FSSP-100) to ice crystals (CPI) extinction ratio is on average about 100 (10 km−1/0.1 km−1) the broadband radiative effects near the cloud top are mostly dominated by water droplets as de-scribed by Ehrlich et al. (2008) from spectral solar radiation measurements and by Richter et al. (2008) from airborne Li-dar observations. These findings confirm the results of Mc-Farquhar et al. (2004) obtained in mixed-phase clouds.
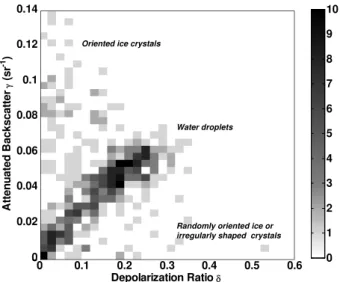
According to investigations of Cho et al. (2008) the rela-tionship between layer-averaged depolarization ratio (δ) and layer attenuated backscatter (γ′) measured by CALIOP gives typical signatures depending on different cloud categories including stratiform clouds in Polar regions. Figure 6 rep-resents the δ–γ′ relationship obtained from CALIOP
Diameter (μm) Scattering angle (°)
Conc
ent
rat
ion
(l-1
μ
m-1)
Angu
la
r
sca
tte
ring
c
oeffic
ient (
μ
m-1 sr-1)
Ice part. conc : 5 l-1 IWC : 0.02 g/m3 Extinction : 0.6 km-1 Deff CPI : 70 μm g : 0.778
Fig. 4b.Ice water-phase cloud properties.
Right panel: Mean scattering phase function measured by the Polar Nephelometer (circle symbols) and scattering phase function obtained by Mie theory (cross symbols) calculated with the average droplet size distribution measured by the FSSP-100 over the same time-period. Left panel: FSSP-100 and CPI size-distributions. Are also reported the mean values of the pertinent microphysical and optical parameters
(Concentration of ice particles withD>100µm, IWC: ice water content, extinction coefficient, Deff: effective diameter,g: asymmetry
parameter).
a
b
c
Altitude (m)
Percentage
0 400 800 μm
-20
-16
-12
Temperature
(°C)
Dendrites
Fig. 5. Vertical profile of the ice particle shape classification (represented for number and forD>100µm) with examples of ice particles
images sampled by the CPI probe at three flight levels:(a)1700 m/−21◦C,(b)1000 m/−16◦C,(c)500 m/−12◦C.
points on Fig. 6 address water droplets, some measurements with highγ′and lowδ values are seen as oriented ice crys-tals according to the theoretical results from Hu et al. (2007). As already discussed above, they correspond to observations for which the lidar was able to penetrate to the surface and detected precipitating ice particles. The in situ observation of ice columns and plates at the uppermost cloud levels may explain this feature. Nevertheless, because only a few data points are considered the results should be confirmed from new observations performed in Arctic mixed-phase clouds during POLARCAT (Mioche et al., 2009).
In situ measurements as well as CloudSat observations ev-idence very efficient ice growth processes since about 25% of the theoretically available liquid water (estimated adiabatic
value of 0.6 g/m3) is converted into ice water (0.15 g/m3, see Fig. 4a) with large ice crystals with sizes up to 2.1 mm which precipitate down to the sea level (confirmed by visual observations on board). This feature is highlighted by the relatively strong radar echo core (up to 15 dBZ) on Fig. 4a. The quantitative comparison of reflectivity factors between CloudSat and in situ observations is displayed on Fig. 7. The method of data processing to derive cloud parameters from in situ data has been described by Mioche et al. (2009) and is discussed in Appendix B. The results highlight a good agree-ment for the observations carried out around 79◦N whereas
0 0 0.02 0.04 0.06 0.08 0.1 0.12 0.14
A
tten
u
a
ted
B
ackscatt
e
r γ
(sr
-1)
0 0.1 0.2 0.3 0.4 0.5 0.6
0
Depolarization Ratio δ
0 1 2 3 4 5 6 7 8 9 10
Water droplets
Randomly oriented ice or irregularly shaped crystals Oriented ice crystals
Fig. 6. CALIOPδ–γ′relationship obtained for measurements ob-tained on 9 April 2007. The color of each pixel represents the
fre-quency of occurrence for a1δ–1γ′ box with 0.02 by 0.004 sr−1
interval. The CALIOP horizontal resolution is 333 m.
Boundary layer mixed-phase clouds such as those de-scribed in this study in the vicinity of the Svalbard archipelago may cover considerable areas and may last sev-eral days. They are gensev-erally observed during spring and autumn seasons and are related to cold air outbreaks coming from Northern ice fields (Richter et al., 2008; Kolstad et al., 2008). We have evidenced that such kind of clouds exhibit rather efficient precipitation formation (see also among oth-ers McFarquhar et al., 2007). Tziperman and Gildor (2002) have hypothesized that the temperature-precipitation feed-back may play an important role in determining the stability of the thermohaline circulation. Therefore, the precipitation rate over the Greenland sea pool is roughly estimated in the following.
The precipitation rate is related to the reflectivity factor as illustrated on Fig. 8 (both parameters are derived from CPI measurements) noting that a reflectivity factor of 15 dBZ corresponds to a precipitation rate of 1 mm h−1. Hypoth-esizing an area of 1000 km×1000 km (approximate area of the Greenland sea pool), a precipitation cover of 5% (rough value from CloudSat data and MODIS cloud field in this study) and a mean precipitation rate of 0.05 mm/h (mean value from our in situ measurements), a considerable value of 106m3h−1of fresh water could be settled over the Greenland
sea pool. Obviously this quantity must only be considered as an order of magnitude (i.e. precipitation rate already rep-resents 110% of error) and should be evaluated much more accurately from interpretation of systematic CloudSat obser-vations and TERRA/MODIS cloud field products over the considered areas.
78.4 78.5 78.6 78.7 78.8 78.9 79 79.1 79.2 -30
-25 -20 -15 -10 -5 0 5 10 15 20
Latitude [°]
R
a
da
r r
e
fl
ec
ti
vi
ty
[dB
Z
]
Fig. 7.Time-series of the reflectivity factor derived from CPI mea-surements (dotted line) and CloudSat reflectivity (full line) along the Polar-2 flight trajectory.
Precipitation rate (log mm/h)
Reflectiv
ity
fac
tor (dBZ)
Fig. 8.Relationship between the reflectivity factor and the precipi-tation rates derived from CPI measurements.
4 Comparison with ECMWF analyses
Although numerical prediction models have been improved, clouds represent the largest uncertainty in present weather and climate models. Some of the operational ECMWF anal-yses are compared with the observations in order to discuss the reliability of microphysical parameterizations which are still a key issue that should be emphasized in numerical mod-elling of the Arctic atmosphere.
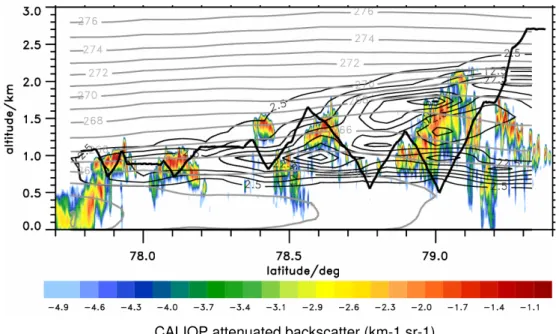
CALIOP attenuated backscatter (km-1 sr-1)
Fig. 9.CALIOP attenuated backscattering profile between the latitudes 77.7◦and 79.4◦N with the aircraft trajectory. Are superimposed the potential temperature and condensed water content (CWC) contour lines. These two last parameters are issued from interpolated ECMWF operational analyses.
CALIOP attenuated backscatter indicates an almost grad-ual increase of the cloud top height towards the north. This observation agrees with the superimposed isentropic (con-stant θ) surfaces and the CWC which both indicate an in-crease of the boundary layer depth. As indicated in Fig. 2, air masses having a different origin have been sampled: Dur-ing the southern portion of the research flight, remnants of the cold-air outbreak associated with a shallower cloud top height were observed. This air mass was gradually replaced by warmer air originating from the south, which we sampled during the descent-ascent sequences in the northern portion of the flight. A good agreement is found between the struc-ture of the modelled CWC fields and CALIOP observations. Indeed cloud top and cloud base defined by the contour of the threshold modelled CWC value (0.0025 g/kg) fit well with the main observed cloud feature. The cloud top level in-creases from 1100 m to 2200 m (towards the Northern part) whereas the coherent cloud base remains at a quasi-constant altitude (600 m). This implies that the weather situation did not change much between the two analyses times 06:00 and 12:00 UTC. However, due to the coarse spatial horizontal and vertical resolutions of about 20 km and 200 m in the bound-ary layer, the ECMWF analyses cannot resolve the mesoscale features of the observed scattered clouds and therefore does not simulate explicitly shallow convection (it is a hydrostatic model).
These results confirm previous Arctic cloud comparisons with the ECMWF model output during SHEBA (Beesley et al., 2000) where good correlation was found between obser-vations and the vertical extent of clouds.
on Fig. 10 are much smaller than those observed (by a factor of about 10).
Although the presence of ice is well predicted by the model, despite with significant differences in magnitude compared to the observed values, the properties of the pre-cipitation which fall down to the sea surface due to large ice crystals are not resolved by the model (see black sym-bols on Fig. 10). Similarly unresolved is the scattered fea-ture of the precipitation fields evidenced from CloudSat (see Fig. 4a). Only more advanced microphysical schemes in cloud-resolving mesoscale models could improve the results but these schemes are not applicable in the context of the ECMWF model. In conclusion the spatial scale plus the mi-crophysical scheme influence the comparison of modelled and observed cloud properties.
These results confirm the conclusions by Beesley et al. (2000) that the ECMWF model did not reproduce the ob-served fraction of water (due to the temperature-dependent parameterization of water phases) and provided a system-atic underestimation of the liquid phase. Morrison and Pinto (2006), Sandvik et al. (2007) and Prenni et al. (2007) also reported on inadequate microphysical schemes underes-timating the liquid phase for Arctic mixed-phase clouds.
5 Conclusions
The combination of CALIPSO/CloudSat data with co-located in situ observations gives new insights on mixed-phase layer clouds in the Arctic region. The results may serve to improve model predictions and satellite retrievals and can be summarized as follow:
The mixed-phased cloud on 9 April 2007 exhibits a cloud top layer dominated by liquid-water in which ice precipi-tation was yielded. This confirms the common feature ob-served in Arctic mixed-phase stratocumulus clouds even for cloud top temperatures down to−25◦C during ASTAR. A low concentration of large ice crystals is also observed up to cloud top, resulting in significant CloudSat radar echo. Since the liquid water to ice crystals extinction ratio is high the broadband radiative effects near cloud top are mostly domi-nated by water droplets.
Very efficient ice growth processes are evidenced in boundary layer clouds since about 25% of the theoretically available liquid water is converted into ice water with large precipitating ice crystals down to sea level. This feature is highlighted by the relatively high CloudSat radar echo core (up to 15 dBZ). The precipitation rate was related to the re-flectivity factor and using a rough estimate of mean cloud cover, a considerable value of 106m3h−1 of fresh water
could be settled over the Greenland sea pool during the 9 April 2007 situation.
ECMWF simulations reproduce the boundary layer height variations and a subsequent good agreement is found be-tween the vertical structure of the modelled condensed water
10-4 10-3 10-2 10-1 100 10-3 10-2 10-1 100
3.0
2.0
1.0
0.0
Altitude (m)
Model Observations
LWC / IWC (g/kg) LWC/ IWC (g/kg)
Fig. 10.Vertical profiles of the modelled and observed liquid water content (red symbols). The black symbols represent the modelled and observed ice water content.
content fields and the observations. The modelled cloud top and cloud base fit well with the main observed cloud feature. However, ECMWF analyses cannot resolve the mesoscale features of the observed scattered clouds but rather give a continuous cloudy layer. Comparison with the observa-tions clearly shows that the ECMWF model reveals a serious shortcoming in that most of the cloud layer is classified as ice clouds and only in the lowermost cloud layer is liquid water found. Thus the modelled liquid fraction (f l) is significantly underpredicted because of the temperature-dependent parti-tioning scheme between liquid water and ice water phases in the model. Furthermore, the magnitudes of the modelled LWC and IWC values are much smaller than observed ones (by a factor of about 10). The properties of the precipitation which falls down to the sea surface as large ice crystals are not resolved (see red symbols on Fig. 10), and neither are the scattered feature of the precipitation fields evidenced from CloudSat. These results confirm previous conclusions that the ECMWF model did not reproduce the observed fraction of water and provided a systematic underestimation of the liquid phase.
Appendix A
greater than the depth of field from the object plane. There-fore, large uncertainties occur on derived size distributions particularly for particles smaller than about 100µm. In or-der to reduce these errors, a calibration method was devised (Connolly et al., 2007) from optical bench measurements which use calibrated glass beads and ice analogs. The CPI operated during ASTAR 2004 and ASTAR 2007 campaigns (see Engvall et al., 2008) was calibrated by applying this method at the University of Manchester (Lef`evre, 2007). As reported in a previous paper (Gayet et al., 2009), the cal-ibration results were conclusively validated by comparing the CPI size distributions to the 2D-C data during the AS-TAR 2004 campaign. Following a similar way the CPI mea-surements were compared to PMS 2D-C and 2D-P data still in Arctic layer clouds during the POLARCAT 2008 exper-iment (Law et al., 2008). We note in passing the ATR42 aircraft used during POLARCAT has very similar perfor-mances (in terms of airspeed) of the Polar2 aircraft. There-fore we may reasonably assume that the CPI validations per-formed from the POLARCAT data are relevant for the results presented in this study. Figure A1a and b displays the re-sults obtained during POLARCAT in a Nimbostratus cloud near−25◦C and in a boundary layer mixed-phase cloud near
−15◦C, respectively. A very good agreement is found be-tween the size distributions for both examples with mostly bullet-Rosette ice crystal shape (Fig. A1a) and rimed parti-cles (Fig. A1b). Mean values of the concentration of partiparti-cles
withD>100µm, extinction coefficient and ice water content
are also reported on Fig. A1 for CPI probe and both PMS 2D-C and 2D-P instruments. The discrepancies between the two probes are undoubtedly within the large uncertainties ex-pected for the PMS instruments (up to 75% and 100% on particle concentration and ice water content respectively, see Gayet et al., 2002) and confirm the previous comparisons re-sults (Gayet et al., 2009). Therefore, we consider the errors on the size distributions and derived microphysical parame-ters calculated from the (calibrated) CPI are of the same order of those from the PMS instruments.
Appendix B
The radar equivalent reflectivity factor is calculated by us-ing the followus-ing relationshipS (Liu and Illus-ingworth, 2000; Hogan et al., 2005; Protat et al., 2007):
Z(mm6m−3)=1015|Ki| 2
|Kw|2 X
j,D
ρeq(j,D)
ρg 2
Nj,D(D)D6f(D)
Z(dBZ)=10 log10Z(mm6m−3)
with:
• Ki and Kw the dielectric factors of ice at 94 GHz
(0.177) and water (0.75) respectively;
a b
Concentration (l
Diameter (μm)
-1
μ
m
-1)
PMS CPI
C100 1.7 2.1 l-1
Ext 0.26 0.30km-1
IWC 13 14 mg/m3
PMS CPI
C100 2.8 2.8 l-1
Ext 0.63 0.68km-1
IWC 29 29 mg/m3
CPI
2D-C
2D-P
CPI 2D-C
2D-P
Fig. A1. Mean particle size distributions measured by the 2D-C, 2D-P and the CPI probes obtained during the POLARCAT
experi-ment in a Nimbostratus cloud near−25◦C(a)and a boundary layer
mixed-phase cloud near−15◦C(b), respectively. Mean values of
the concentration of particles withD>100µm, extinction
coeffi-cient and ice water content are also depicted.
• ρeq(j,D) ρg
is the ratio of the equivalent density of ice crystal to the solid ice density in order to take into account the effects of shape and density of ice crys-tals (Oguchi, 1983). ρeq is determined according to
the shape (j) of the particles recognized from the CPI images (Lef`evre, 2007) and to the correspond-ing mass-diameter relationships (Locatelli and Hobbs, 1974; Mitchell, 1996).ρg=0.9 g cm−3;
• Nj,D(D)is the concentration of particles (l−1) with the
shapejand diameterD(µm);
• f (D)represents the ratio of the Mie scattering to the
Rayleigh scattering at 94 GHz which depends on the particle diameter in order to take into account the ef-fects of Mie scattering when the particles are larger than 600µm (see Boudala et al., 2006).
Acknowledgements. This work was funded by the Centre National d’Etudes Spatiales (CNES), by the Institut Polaire Franc¸ais Paul Emile Victor (IPEV), and the German Research Foundation
(DFG, WE 1900/8-1). We thank the members of OPTIMARE
GmbH and DLR (Deutsches Zentrum f¨ur Luft- und Raumfahrt) who organize the experiment management and aircraft operations. CALIPSO data presented here are courtesy of the NASA Langley Research Center Atmospheric Science Data Center. CloudSat data are courtesy of the CloudSat Data Processing Center. The ECMWF center is acknowledged for the reliable access to the forecasts and
analysis. We acknowledge A. Schwarzenboeck, C. Gourbeyre,
G. Febvre and J.-F. Fournol (LaMP) for their active participation to the experiment. We acknowledge K. James who reviewed the manuscript. We thank anonymous reviewers who made important comments which strengthened the manuscript.
The publication of this article is financed by CNRS-INSU.
References
Baker, B. and Lawson, R. P.: Improvement in Determination of Ice Water Content from Two-Dimensional Particle Imagery, Part I: Image-to-Mass Relationships, J. Appl. Meteorol. Clim., 45, 1282–1290, 2006.
Baumgardner, D., Gayet, J.-F., Gerber, H., Korolev, A. V., and Twohy, C.: Clouds/Measurement Techniques In Situ, in: En-cyclopedia of Atmospheric Sciences, edited by: Holton, J. R., Curry, J. A., and Pyle, J., Academic Press, London, 4000 pp., 2002.
Beesley, J. A., Bretherton, C. S., Jakob, C., Andreas, E. L., Intrieri, J. M., and Uttal, T. A.: A comparison of cloud and boundary layer variables in the ECMWF forecast model with observations at Surface Heat Budget of the Arctic Ocean (SHEBA) ice camp, J. Geophys. Res., 105, 12 337–12 349, 2000.
Boudala, F. S., Isaac, G. A., and Hudak, D.: Ice water content and precipitation rate as a function of equivalent radar reflectivity and temperature based on in situ observations, J. Geophys. Res., 111, 1–13, 2006.
Cho, H.-M., Yang, P., Kattawar, G. W., Nasiri, S. L., Hu, Y., Minnis, P., Trepte, C., and Winker, D.: Depolarization ratio and attenu-ated backscatter for nine cloud types: analyses based on collo-cated CALIPSO lidar and MODIS measurements, Opt. Express, 16(6), 3931–3948, 2008.
Cober, S. G., Isaac, G. A., Korolev, A., and Strapp, J. W.: Assess-ing cloud-phase conditions, J. Appl. Meteorol., 40, 1967–1983, 2001.
Connolly, P. J., Flynn, M. J., Ulanowski, Z., Choularton, T. W., Gal-lagher, M. W., and Bower, K. N.: Calibration of the cloud particle imager probes using calibration beads and ice crystal analogues: The depth of field, J. Atmos. Ocean. Tech., 24, 1860–1879, 2007. CPIview: CPI data processing software, SPEC Incorporated Boul-der, Colorado, (http://www.specinc.com/publications/CPIview Manual.pdf), 2005.
Curry, J. A., Rossow, W. B., Randall, D., and Schramm, J. L.: Overview of Arctic Cloud and Radiation Characteristics, J. Cli-mate, 9, 1731–1764, 1996.
de Boer, G., Eloranta, E. W., and Shupe, M. D.: Arctic mixed-phase stratiform cloud properties from multiple years of surface-based measurements at two high-latitude locations, J. Atmos. Sci., in press, 2009.
Dickson, B., Yashayaev, I., Meincke, J., Turrell, B., Dye, S., and Holfort, J.: Rapid freshening of the deep North Atlantic Ocean over the past four decades, Nature, 416, 832–837, 2002. Dong, X. and Mace, G. G.: Arctic stratus cloud properties and
ra-diative forcing derived from ground-based data collected at Bar-row, Alaska, J. Climate, 16(3), 445–461, 2003.
Ehrlich, A., Bierwirth, E., Wendisch, M., Gayet, J.-F., Mioche, G., Lampert, A., and Heintzenberg, J.: Cloud phase identification
of Arctic boundary-layer clouds from airborne spectral reflection measurements: test of three approaches, Atmos. Chem. Phys., 8, 7493–7505, 2008,
http://www.atmos-chem-phys.net/8/7493/2008/.
Engvall, A.-C., Krejci, R., Str¨m, J., Treffeisen, R., Scheele, R., Hermansen, O., and Paatero, J.: Changes in aerosol properties during spring-summer period in the Arctic troposphere, Atmos. Chem. Phys., 8, 445–462, 2008,
http://www.atmos-chem-phys.net/8/445/2008/.
Field, P. R., Wood, R., Brown, P. R. A., Kaye, P. H., Hirst, E., Greenaway, R., and Smith, J. A.: Ice particle interarrival times measured with a Fast FSSP, J. Atmos. Sci., 20, 249–261, 2003. Field, P. R., Heymsfield, A. J., and Bansemer, A.: Shattering and
interarrival times measured by optical array probes in ice clouds, J. Atmos. Ocean. Tech., 23, 1357–1371, 2006.
Francis, P. N., Jones, A., Saunders, R. W., Shine, K. P., Slingo, A., and Sun, Z.: An observational and theoretical study of the radiative properties of cirrus: Some results from ICE’89, Q. J. Roy. Meteor. Soc., 120, 809–848, 1994.
Fridlind, A. M., Ackerman, A. S., McFarquhar, G., Zhang, G., Poel-lot, M. R., DeMott, P. J., Prenni, A. J., and Heymsfield, A. J.: Ice properties of single-layer stratocumulus during the Mixed-Phase Arctic Cloud Experiment, 2. Model results, J. Geophys. Res., 112, D24202, doi:10.1029/2007JD008646, 2007.
Fu, Q.: An accurate parameterization of the solar radiative proper-ties in cirrus clouds, J. Climate, 9, 2058–2082, 1996.
Gallagher, M. W., Connolly, P. J., Whiteway, J., Figuera-Nieto, D., Flynn, M., Choularton, T. W., Bower, K. N., Cook, C., Busen, R., and Hacker, J.: An overview of the microphysical structure of cirrus clouds observed during EMERALD-1, Q. J. Roy. Meteor. Soc., 131, 1143–1169, 2005.
Garrett, T. J., Hobbs, P. V., and Gerber, H.: Shortwave, single-scattering properties of Arctic ice clouds, J. Geophys. Res., 106, 15 155–15 172, 2001.
Gayet, J. F., Cr´epel, O., Fournol, J. F., and Oshchepkov, S.: A new airborne polar Nephelometer for the measurements of optical and microphysical cloud properties. Part I: Theoretical design, Ann. Geophys., 15, 451–459, 1997,
http://www.ann-geophys.net/15/451/1997/.
Gayet, J.-F., Asano, S., Yamazaki, A., Uchiyama, A., Sinyuk, A., Jourdan, O., and Auriol, F.: Two case studies of winter continental-type water and mixed-phase stratocumuli over the sea 1. Microphysical and optical properties, J. Geophys. Res., 107(D21), 4569, doi:10.1029/2001JD001106, 2002.
Gayet, J.-F., Ovarlez, J., Shcherbakov, V., Str¨om, J., Schumann, U., Minikin, A., Auriol, F., Petzold, A., and Monier, M.: Cirrus cloud microphysical and optical properties at southern and north-ern midlatitudes during the INCA experiment, J. Geophys. Res., 109, D20206, doi:10.1029/2004JD004803, 2004.
Gayet, J.-F., Treffeisen, R., Helbig, A., Bareiss, J., Matsuki, A., Herber, A., and Schwarzenboeck, A.: On the onset of the ice phase in boundary-layer Arctic clouds, J. Geophys. Res., in press, 2009.
Heymsfield, A. J.: On measurements of small ice
par-ticles in clouds, Geophys. Res. Lett., 34, L23812,
doi:10.1029/2007GL030951, 2007.
Hogan, R. J., Mittermaier, M. P., and Illingworth, A. J.: The re-trieval of ice water content from radar reflectivity factor and tem-perature and its use in evaluating a mesoscale model, J. Appl. Meteorol., 45, 301–317, 2005.
Hu, Y., Vaughan, M., Liu, Z., Lin, B., Yang, P., Flittner, D., Hunt, B., Kuehn, R., Huang, J., Wu, D., Rodier, S., Powell, K., Trepte, C., and Winker, D.: The depolarization – attenuated backscatter relation: CALIPSO lidar measurements vs. theory, Opt. Express, 15(9), 5327–5332, 2007.
Inoue, J., Liu, J., Pinto, J. O., and Curry, J. A.: Intercomparison of Arctic Regional Climate Models: Modeling Clouds and Radia-tion for SHEBA in May 1998, J. Climate, 19, 4167–4178, 2006. Intrieri, J. M., Shupe, M. D., Uttal, T., and McCarty, B. J.: An annual cycle of Arctic cloud characteristics observed by radar and lidar at SHEBA, J. Geophys. Res., 107(C10), 8030, doi:10.1029/2000JC000423, 2002.
IPCC, Intergovernmental Panel on Climate Change: Climate
Change 2007 – the Fourth Assessment Report of the IPCC, Cam-bridge University Press, ISBN 978-0521-88009-1, 2007. Knollenberg, R. G.: Techniques for probing cloud microstructure,
in: Clouds, Their Formation, Optical Properties, and Effects, edited by: Hobbs, P. V. and Deepak, A., Academic Press, New York, 15–91, 1981.
Kolstad, E. W., Bracegirdle, T. J., and Seierstad, I. A.: Marine cold-air outbreaks in the North Atlantic: temporal distribution and associations with large-scale atmospheric circulation, Clim. Dy-nam., 33(2–3), 187–197, 2008.
Korolev, A., Isaac, G. A., and Hallett, J.: Ice particle habits in Arctic clouds, Geophys. Res. Lett., 26, 1299–1302, 1999.
Korolev, A., Isaac, G. A., Cober, S. G., Strapp, J. W., and Hallett, J.: Microphysical charaterisation of mixed-phase clouds, Q. J. Roy. Meteorol. Soc., 129, 39–65, 2003.
Korolev, A. and Isaac, G. A.: Shattering during sampling by OAPs and HVPS. Part I: Snow particles, J. Atmos. Ocean. Tech., 22, 528–543, 2005.
Lampert, A., Ehrlich, A., D¨ornbrack, A., Jourdan, O., Gayet, J.-F., Mioche, G., Shcherbakov, V., Ritter, C., and Wendisch, M.: Microphysical and radiative characterization of a subvisible mi-dlevel Arctic ice cloud by airborne observations - a case study, Atmos. Chem. Phys., 9, 2647–2661, 2009,
http://www.atmos-chem-phys.net/9/2647/2009/.
Law, K. S., Ancellet, G., Pelon, J., Turquety, S., Clerbaux, C., Pom-mier, M., de Villiers, R., Gayet, J.-F., Schwarzeboeck, A., Ned-elec, P., Schneider, J., and Borrmann, S.: POLARCAT-France Airborne Experiment: first results, Intern. Global Atmospheric Chemistry conference (IGAC), Annecy, France, 7–12 September 2008.
Lawson, R. P., Baker, B. A., and Schmitt, C. G.: An overview of mi-crophysical properties of Arctic clouds observed in May and July 1998 during FIRE ACE, J. Geophys. Res., 106, 14 989–15 014, 2001.
Lawson, R. P. and Baker, B. A.: Improvement in determination of ice water content from two-dimensional particle imagery, Part II: Applications to collected data, J. of Appl. Meteorol., 45(9), 1291–1303, 2006.
Lef`evre, R.: Physique de la mesure de la sonde CPI. Application `a la campagne ASTAR, Th`ese de l’Universit´e Blaise Pascal. Avail-able at LaMP, 24 av. des Landais 63177 Aubi`ere, France, 187 pp., 2007.
Liu, C. L. and Illingworth, A. J.: Toward more accurate retrievals of ice water content from radar measurements of clouds, J. Appl. Meteorol., 39(7), 1130–1146, 2000.
Locatelli, J. D. and Hobbs, P. V.: Fall speed and masses of solid precipitation particles, J. Geophys. Res., 79, 2185–2197, 1974. Lubin, D. and Vogelmann, A. M.: A climatologically significant
aerosol longwave indirect effect in the Arctic, Nature, 430, 453– 456, 2006.
McFarquhar, G. and Cober, S. G.: Single-Scattering Properties of Mixed-Phase Arctic Clouds at Solar Wavelengths: Impacts on Radiative Transfer, J. Climate, 17, 3799–3813, 2004.
McFarquhar, G., Zhang, G., Poellot, M. R., Kok, G. L., Mc-Coy, R., Tooman, T., Fridlind, A., and Heymsfield, A.: Ice properties of single-layer stratocumulus during the Mixed-Phase Arctic Cloud Experiment, J. Geophys. Res., 112, D24201, doi:10.1029/2007JD008633, 2007.
Mioche, G., Gayet, J.-F., Minikin, A., Herber, A., and Pelon, J.: A comparison between CloudSat and aircraft data for mixed-phase and cirrus clouds EGU symposium, Vienna, Austria, 19–24 April 2009.
Mitchell, D. L.: Use of Mass and Area Dimensional Power Laws for Determining Precipitation Particle Terminal Velocities, J. Atmos. Sci., 53, 1710–1723, 1996.
Morrison, H. and Pinto, J. O.: Intercomparison of bulk cloud micro-physics schemes in mesoscale simulations of springtime Arctic mixed-phase stratiform clouds, Mon. Weather Rev., 134, 1880– 1900, 2006.
Morrison, H., Pinto, J. O., Curry, J. A., and McFarquhar, G.: Sensitivity of modelled Arctic mixed-phase stratocumu-lus to cloud condensation and ice nuclei over regionally varying surface conditions, J. Geophys. Res., 113, D05203, doi:1029/2007JD008729, 2008.
Oguchi, T.: Electromagnetic wave propagation and scattering in rain and other hydrometeors, Proc. IEEE, 71, 1029–1078, 1983. Prenni, A. J., Harrington, J. Y., Tjernstr¨om, M., DeMott, P. J., Avramov, A., Long, C. N., Kreidenweis, S. M., Olsson, P. Q., and Verlinde, J.: Can ice-nucleating aerosols affect Arctic sea-sonal climate?, B. Am. Meteorol. Soc., 88, 541–550, 2007. Protat, A., Delano¨e, J., Bouniol, D., Heymsfield, A. J., Bansemer,
A., and Brown, P.: Evaluation of ice water content retrievals from cloud radar reflectivity and temperature using a large airborne in situ microphysical database, J. Appl. Meteorol. Clim., 46, 557– 572, 2007.
Rangno, A. L. and Hobbs, P. V.: Ice particles in stratiform clouds in the Arctic and possible mechanisms for the production of high ice concentration, J. Geophys. Res., 106, 10 065–15 075, 2001. Richter, A., Gayet, J.-F., Mioche, G., Ehrlich, A., and D¨ornbrack,
A.: Mixed-Phase Clouds in the Arctic: A Synopsis of Airborne Lidar, In-Situ, and Albedometer Observations, complemented by Meteorological Analyses, 24th International Laser Radar Con-ference (ILRC), 23–27 June 2008, Boulder, USA, 881–884, 2008.
Rossow, W. B., Walker, A. W., and Garder, L. C.: Comparison of ISCCP cloud detection, J. Climate, 6, 2370–2393, 1993. Sandvik, A., Biryulina, M., Kvamsto, N. G., Stames, J. J., and
Sassen, K. and Liou, K. N.: Scattering of polarized laser light by water droplet, mixed-phase and ice crystal clouds. Part I : Angu-lar scattering pattern, J. Atmos. Sci., 36, 838–851, 1979. Shupe, M. D., Uttal, T., Matrosov, S., and Frisch, A. S.: Cloud water
contents and hydrometeor sizes during the FIRE Arctic Clouds Experiment, J. Geophys. Res., 106, 15 015–15 028, 2001. Shupe, M. D., Matrosov, S. Y., and Uttal, T.: Arctic mixed-phase
cloud properties derive from surface-based sensors at SHEBA, J. Atmos. Sci., 63, 697–711, 2006.
Shupe, M. D., Kollias, P., Persson, P. O., and McFarquhar, G.: Verti-cal Motions in Arctic Mixed-Phase Stratiform Clouds, J. Atmos. Sci., 65, 1304–1322, 2008.
Stachlewska, I. S., Wehrle, G., Stein, B., and Neuber, R.: Airborne Mobile Aerosol Lidar for measurements of Arctic aerosol, in: Proceeding of the 22nd International Laser Radar Conference, edited by: Pappalardo, G. and Amodeo, A., ESA SP-561, 87–89, 2004.
Stachlewska, I. S.: Investigation of tropospheric arctic aerosol and mixed-phase clouds using airborne lidar technique, Ph.D. the-sis, University of Potsdam, 100 pp., http://opus.kobv.de/ubp/ volltexte/2006/698/, 2006.
Stephens, G. L., Vane, D. G., Boain, R. J., Mace, G. G., Sassen, K., Wand, Z. E., Illingworth, A. J., O’Connor, E. J., Rossow, W. B., Durden, S. L., Miller, S., Austin, R. T., Benedetti, A., and Mitrescu, C.: The CloudSat mission and the A-train. A new di-mension of space-based observations of clouds and precipitation, B. Am. Meteorol. Soc., 83, 1771–1790, 2002.
Tziperman, E. and Gildor, H.: The stabilization of the thermohaline circulation by the temperature-precipitation feedback, J. Phys. Ocean., 32, 2707–2714, 2002.
Wendisch, M., M¨uller, D., Schell, D., and Heintzenberg, J.: An air-borne spectral albedometer with active horizontal stabilization, J. Atmos. Ocean. Tech., 18, 1856–1866, 2001.
Verlinde, J., Harrington, J. Y., McFarquhar, G. M., et al.: The mixed-phase Arctic cloud experiment (M-PACE), B. Am. Me-teorol. Soc., 88(2), 205–221, 2007.
Winker, D. M., Pelon, J., and McCormick, M. P.: The CALIPSO mission: Spaceborne lidar for observation of aerosols and clouds, Status and Performance, Proc. SPIE, 4893, 1–11, 2003. Winker, D. and Trepte, C.: Distribution and Characteristics of
Po-lar Clouds from CALIOP, A-Train-Lille 07 symposium, 22–25 October 2007.