ACPD
13, 18069–18112, 2013Orographic cirrus
H. Joos et al.
Title Page
Abstract Introduction
Conclusions References
Tables Figures
◭ ◮
◭ ◮
Back Close
Full Screen / Esc
Printer-friendly Version Interactive Discussion
Discussion
P
a
per
|
D
iscussion
P
a
per
|
Discussion
P
a
per
|
Discuss
ion
P
a
per
|
Atmos. Chem. Phys. Discuss., 13, 18069–18112, 2013 www.atmos-chem-phys-discuss.net/13/18069/2013/ doi:10.5194/acpd-13-18069-2013
© Author(s) 2013. CC Attribution 3.0 License.
Atmospheric Chemistry and Physics
Open Access
Discussions
Geoscientiic Geoscientiic
Geoscientiic Geoscientiic
This discussion paper is/has been under review for the journal Atmospheric Chemistry and Physics (ACP). Please refer to the corresponding final paper in ACP if available.
Influence of heterogeneous freezing on
the microphysical and radiative
properties of orographic cirrus clouds
H. Joos1, P. Spichtinger2, P. Reutter2, and F. Fusina1,*
1
Institute for Atmospheric and Climate Science, ETH Zurich, Zurich, Switzerland
2
Institute for Atmospheric Physics, Johannes Gutenberg University, Mainz, Germany
*
now at: Swiss International Air Lines AG, 4002 Basel, Switzerland
Received: 23 May 2013 – Accepted: 31 May 2013 – Published: 6 July 2013 Correspondence to: H. Joos ([email protected])
ACPD
13, 18069–18112, 2013Orographic cirrus
H. Joos et al.
Title Page
Abstract Introduction
Conclusions References
Tables Figures
◭ ◮
◭ ◮
Back Close
Full Screen / Esc
Printer-friendly Version Interactive Discussion
Discussion
P
a
per
|
D
iscussion
P
a
per
|
Discussion
P
a
per
|
Discuss
ion
P
a
per
|
Abstract
The influence of heterogeneous freezing on the microphysical and optical properties of orographic cirrus clouds has been simulated with the cloud resolving model EULAG. Idealized simulations with different concentrations of ice nuclei (IN) in a dynamically dominated regime with high vertical velocities have been performed. Furthermore the 5
temperature under which the cloud forms as well as the critical supersaturation which is needed for the initiation of heterogenoues freezing have been varied. The short wave, long wave and net cloud forcing has been calculated under the assumption that the clouds form between 06:00 and 12:00 LT or between 12:00 and 18:00 LT, respectively. In general it can be seen that the onset of homogeneous freezing is shifted in time 10
depending on the IN concentration as part of the available water vapor is depleted before the critical threshold for homogeneous freezing is reached. Although the high vertical velocities in an orographic gravity wave lead to a strong adiabatic cooling fol-lowed by high ice supersaturations, a small number concentration of IN in the order of 5 L−1 is already able to strongly decrease the simulated ice crystal number burden 15
(ICNB), ice water path (IWP) and optical depth of the cloud. In general, the ICNB, IWP and optical depth strongly decrease when the IN concentrations are increased from 0 to 50 L−1. The absolute values of the short wave, long wave and net cloud forcing are also reduced with increasing IN concentrations. If a cloud produces a net warming or cooling depends on the IN concentration, the temperature and the time of day at which 20
the cloud forms. The clouds that form between 06:00 and 12:00 LT are mainly cool-ing whereas the clouds with the same microphysical properties can lead to a warmcool-ing when they form between 12:00 and 18:00 LT. In order to predict the radiative forcing of cirrus clouds it is therefore necessary to take the correct dynamical and thermody-namical processes as well as the possible existence and freezing threshold of hetero-25
ACPD
13, 18069–18112, 2013Orographic cirrus
H. Joos et al.
Title Page
Abstract Introduction
Conclusions References
Tables Figures
◭ ◮
◭ ◮
Back Close
Full Screen / Esc
Printer-friendly Version Interactive Discussion
Discussion
P
a
per
|
D
iscussion
P
a
per
|
Discussion
P
a
per
|
Discuss
ion
P
a
per
|
1 Introduction
Cirrus clouds, i.e. high clouds consisting exclusively of ice crystals, play a crucial role in the climate system. They cover approximately 30 % of the Earth (Wylie and Menzel, 1999). Ice crystals interact with the short and long wave radiation and have a great po-tential to modulate the Earth’s radiative budget. Depending on their microphysical and 5
optical properties, cirrus clouds can either cool or warm the earth–atmosphere system. On the one hand, ice crystals scatter the short wave radiation back to space and thus lead to a cooling (albedo effect). On the other hand, the long wave radiation can be trapped efficiently, leading to a warming (greenhouse effect). In general, optically thin cirrus clouds exert a warming as the absorption of infrared radiation and re-emission 10
at lower temperatures dominates the scattering of incoming solar radiation, whereas optically thick cirrus clouds lead to a cooling as the scattering of short wave radiation back to space is the dominant process. If cirrus clouds lead to a warming or cooling thus depends on their macrophysical properties such as the optical thickness of the cloud which is determined by microphysical properties like the ice crystal number con-15
centration, ice water content, crystal shape and size, respectively (Wendisch et al., 2007).
The microphysical properties of a cirrus cloud depend on the one hand on the un-derlying dynamics and on the other hand on the freezing mechanism. Cirrus clouds can form by homogeneous and heterogeneous freezing. Homogeneous freezing de-20
notes the freezing of supercooled solution droplets. Solution droplets of a certain size start to freeze if a critical supersaturation is exceeded. The critical supersaturation only depends on temperature and is mostly independent of the nature of the solute (Koop et al., 2000). Heterogeneous freezing denotes a freezing process which is associated with solid aerosol particles, the so called ice nuclei (IN). The supersaturation threshold 25
ACPD
13, 18069–18112, 2013Orographic cirrus
H. Joos et al.
Title Page
Abstract Introduction
Conclusions References
Tables Figures
◭ ◮
◭ ◮
Back Close
Full Screen / Esc
Printer-friendly Version Interactive Discussion
Discussion
P
a
per
|
D
iscussion
P
a
per
|
Discussion
P
a
per
|
Discuss
ion
P
a
per
|
45 % are needed (Koop et al., 2000), heterogeneous freezing can be initiated at much lower supersaturations (DeMott et al., 2003; Möhler et al., 2006).
It has been shown in different studies that the existence of INs and the occurrence of heterogeneous freezing can alter the formation of cirrus clouds significantly (Sassen and Benson, 2000; Khvorostyanov and Curry, 2005; DeMott et al., 1997). Spichtinger 5
and Cziczo (2010) investigated in a box model study the influence of INs on the ho-mogeneous freezing at relatively small updraft speeds (0.05–0.2 m s−1). They showed that the existence of INs that freeze at a critical supersaturation smaller than for homo-geneous freezing strongly modifies the subsequent homohomo-geneous freezing and lead to a strong reduction in the simulated ice crystal number concentration (ICNC). The 10
depletion of water vapor by the heterogeneously frozen ice crystals delays the onset and weakens the homogeneous freezing event. The effect of a reduced ICNC due to a previous heterogeneous freezing event compared to a purely homogeneous freez-ing event is also called the “negative Twomey effect” (Kärcher and Lohmann, 2003; Kärcher et al., 2007). Spichtinger and Gierens (2009c) investigated the effect of het-15
erogeneous freezing with the cloud resolving model EULAG. They could show that low IN number concentrations in the order of 5 L−1 modify the microphysical properties of the cloud at least for small updraft speeds in the order of 0.04–0.08 m s−1.
In contrast to previous studies we investigate the influence of INs on the clouds microphysical and optical properties in a highly dynamically dominated regime with 20
vertical velocities of up to 0.8 m s−1 in an orographic gravity wave. Dean et al. (2005) and Joos et al. (2008, 2010) showed that orographically induced cirrus contribute con-siderably to the cirrus cloud amount over and in the lee of mountains and are therefore important also for the radiative budget of the Earth. Additionally, we investigate how the changed microphysical properties modify the radiative properties of the clouds. Fusina 25
proper-ACPD
13, 18069–18112, 2013Orographic cirrus
H. Joos et al.
Title Page
Abstract Introduction
Conclusions References
Tables Figures
◭ ◮
◭ ◮
Back Close
Full Screen / Esc
Printer-friendly Version Interactive Discussion
Discussion
P
a
per
|
D
iscussion
P
a
per
|
Discussion
P
a
per
|
Discuss
ion
P
a
per
|
ties together with the correct representation of the vertical velocity which also strongly determines the ICNC (Kärcher and Lohmann, 2002; Spichtinger and Gierens, 2009b). Until now, it is believed that cirrus clouds lead to a net global warming (Chen et al., 2000). However, it has been shown, that a significant part of the uncertainties in cli-mate predictions arises from the representation of cirrus clouds in the clicli-mate models 5
(Zhang et al., 2005). This is caused by the complex interaction of thermodynamical and dynamical processes which are not included in the models or not resolved by the coarse grid. The poor representation of cirrus clouds and their microphysical and opti-cal properties in GCMs makes it especially difficult to estimate the changes in a future climate and exhibits a major uncertainty for predicting the future climate. In Joos et al. 10
(2009) a first estimate of changes in the microphysical properties of orographic cirrus in a future climate has been presented based on cloud resolving simulations with the EULAG model, whereas in Joos et al. (2010) changes in the microphysical and radia-tive properties are calculated with the global climate model ECHAM5. However, in both studies only homogeneous freezing was considered.
15
In order to gain insight in the complex interactions between dynamics, microphysics and radiation we therefore present the results of 38 idealized simulations of orographic cirrus clouds. We investigate how the microphysical properties are modified by the existence of a varying number of INs at different ambient temperatures, for different efficiencies of the INs and for different times of day at which the clouds form. The oro-20
graphic cirrus clouds and its microphysical properties have been simulated with the cloud resolving model EULAG (Prusa et al., 2008) which contains a detailed ice micro-physics (Spichtinger and Gierens, 2009a). The results of the microphysical properties are then passed as input into a two stream radiative transfer code (Fu and Liou, 1993). This model chain allows us to determine the influence of heterogeneous freezing on 25
the microphysical and radiative properties of orographic cirrus clouds.
ACPD
13, 18069–18112, 2013Orographic cirrus
H. Joos et al.
Title Page
Abstract Introduction
Conclusions References
Tables Figures
◭ ◮
◭ ◮
Back Close
Full Screen / Esc
Printer-friendly Version Interactive Discussion
Discussion
P
a
per
|
D
iscussion
P
a
per
|
Discussion
P
a
per
|
Discuss
ion
P
a
per
|
Sect. 4 the results of all simulations are explained in detail before we summarize our work in Sect. 5.
2 Model description
For this study we use the anelastic, non-hydrostatic model EULAG (Prusa et al., 2008) in order to simulate the orographic cirrus clouds. As in this model a detailed ice mi-5
crophysics is implemented (Spichtinger and Gierens, 2009a), ice crystal number con-centration as well as ice water content are prognostic variables. In our simulations, homogeneous and heterogeneous freezing is considered. The homogeneous nucle-ation rate is parameterized according to Koop et al. (2000) and the background sul-furic acid aerosols are distributed log-normally with an aerosol number concentration 10
of Na=200 cm− 3
, a geometric standard deviation of σr =1.4 and a modal radius of
rm=25 nm, respectively. For heterogeneous freezing a very simple parameterization
is used. The number of available heterogeneous ice nuclei (IN) is prescribed and it is assumed that all INs become ice crystals at a prescribed critical relative humidity with respect to ice (RHihet). If the ice crystals evaporate, the INs can be released back to
15
the atmosphere. The use of such a simple heterogeneous freezing parameterization as in this study is justified as we do not want to investigate different freezing mech-anisms. We want to investigate how the microphysical and optical properties of the cloud change if there were a certain number of INs that freeze at a given RHi, no mat-ter which exact freezing mechanism is active. For a detailed description and validation 20
of the scheme see Spichtinger and Gierens (2009a).
For the calculation of the radiative properties, a two stream radiative transfer code is used. It contains 6 bands in the solar and 12 bands in the thermal infrared regime (Fu and Liou, 1993). The required microphysical variables are ice water content (IWC) and ICNC. Based on these variables the effective ice crystal size is calculated. For the 25
ACPD
13, 18069–18112, 2013Orographic cirrus
H. Joos et al.
Title Page
Abstract Introduction
Conclusions References
Tables Figures
◭ ◮
◭ ◮
Back Close
Full Screen / Esc
Printer-friendly Version Interactive Discussion
Discussion
P
a
per
|
D
iscussion
P
a
per
|
Discussion
P
a
per
|
Discuss
ion
P
a
per
|
the assumption of randomly oriented columns (Fusina et al., 2007; Ebert and Curry, 1992). If heterogeneous freezing is allowed as well, a generalized effective size for the ice crystal size distributions is derived. The derivation is described in detail in the Appendix. Furthermore, the solar zenith angle is calculated corresponding to the day time, the day of year and the geographical latitude; the solar surface albedo is set 5
to 0.3, the infrared surface emissivity is assumed to be 1 and the solar constant is 1340 W m−2.
3 Model setup
In order to calculate orographic cirrus clouds and their microphysical and optical prop-erties we use a set of 38 idealized simulations. We use a 2-D domain (x-z-plane) with 10
a horizontal extension of 320 km and a vertical extension of 20 km with a bell shaped mountain in the middle of the domain with a height of 600 m and a half width of 10 km. The horizontal resolution is 250 m and the vertical resolution is 50 m, respectively. The model is initialized with the ambient potential temperatureθ(z) and pressurep(z) pro-files according to Clark and Farley (1984), using a constant Brunt–Väisäla frequency 15
over the whole troposphere. The tropopause is set atzTP=13 km, followed by higher stratification in the upper part of the domain (13 km≤z≤20 km). Additionally, a wind profileu(z) is prescribed. The wind speed increases between 0 and 2 km height from 4 to 9 m s−1. Above that level it stays constant (u(z)=9 m s−1) until a height of 12 km where it starts to decrease linearly until a height of 15 km to−10 m s−1. The dynami-20
cal timestep is dt=2.5 s and the microphysical time step dtm=10dt =0.25 s. This setup
leads to vertically propagating wave packets, forming a standing wave. Additionally, an ice supersaturated region has been implemented in a height of 8500 m to 9500 m. For a more detailed description of the model setup see also Joos et al. (2009), Sect. 4. In this study it has also been shown that the model represents the measurements of the 25
cam-ACPD
13, 18069–18112, 2013Orographic cirrus
H. Joos et al.
Title Page
Abstract Introduction
Conclusions References
Tables Figures
◭ ◮
◭ ◮
Back Close
Full Screen / Esc
Printer-friendly Version Interactive Discussion
Discussion
P
a
per
|
D
iscussion
P
a
per
|
Discussion
P
a
per
|
Discuss
ion
P
a
per
|
paign (Gayet et al., 2004) very well and is therefore suitable to investigate orographic cirrus clouds.
Our simulations were run for 6 h with an output frequency of 10 min. After approx. 90 min (depending on the number of INs) a cloud starts to form over the mountain and is present over the rest of the simulation time. In order to investigate the influence 5
of heterogeneous freezing we performed one reference simulation with homogeneous freezing only and simulations where the heterogenous freezing is active as well. In or-der to test the sensitivity to the number concentration of INs, simulations with 5, 10 and 50 IN L−1have been carried out. Furthermore, the temperature profile for initializing the model has been shifted such that the temperature inside the ISSR is 10 K warmer or 10
colder then the reference case, respectively, in order to investigate the dependence of the results on the temperature in the cirrus layer. The shift in the temperature profile does not change the flow regime as it is done in a way that the Brunt–Väisäla fre-quency stays the same as in the reference case. Additionally, the RHi which is required for initiating the heterogeneous freezing (RHihet) is set to 120 %, 130 % and 140 %,
re-15
spectively. However, the simulations with RHihet=120 % and 140 % are only performed
for the reference temperature profile and for the simulations from 06:00 to 12:00 LT (see also Fig. 2).
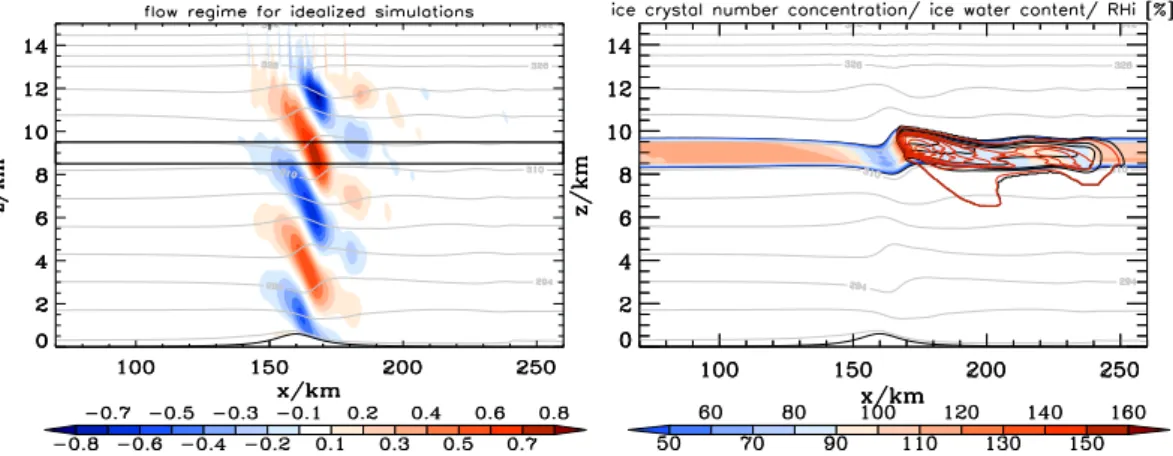
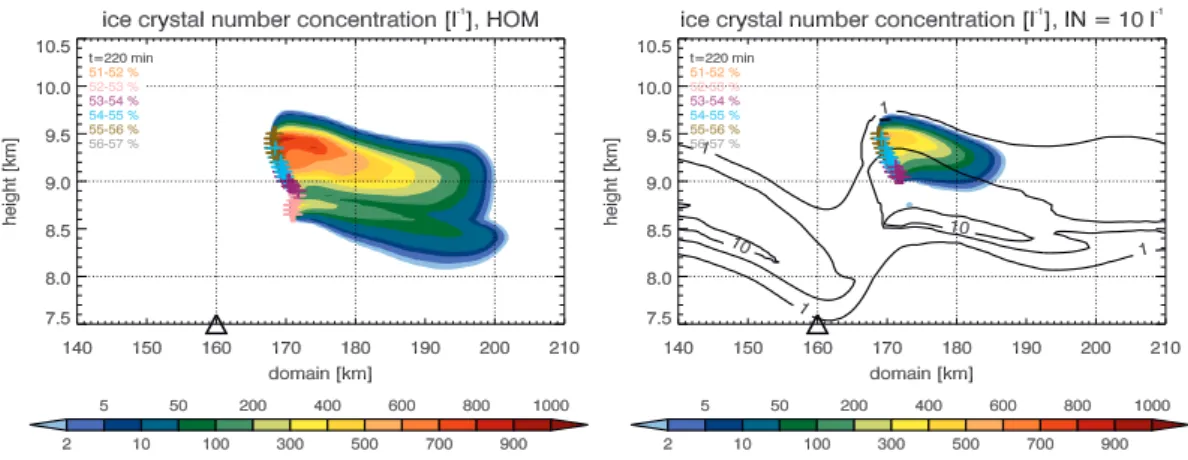
In all simulations a steady mountain wave forms. The vertical velocities reach values up to 0.8 m s−1 and the ISSR is located in a height where the updraft speed reaches 20
its maximum. Thus, the clouds form in a dynamically dominated regime where the high updraft speeds lead to the formation of high ice supersaturations such that an orographic cirrus cloud can form. In Fig. 1 vertical velocities, relative humidity with respect to ice (RHi), ice crystal number concentration (ICNC) and the ice water content (IWC) are displayed for the simulation with homogeneous freezing only (HOM) for the 25
ACPD
13, 18069–18112, 2013Orographic cirrus
H. Joos et al.
Title Page
Abstract Introduction
Conclusions References
Tables Figures
◭ ◮
◭ ◮
Back Close
Full Screen / Esc
Printer-friendly Version Interactive Discussion
Discussion
P
a
per
|
D
iscussion
P
a
per
|
Discussion
P
a
per
|
Discuss
ion
P
a
per
|
below the cloud. This effect can be seen by the red and black lines in Fig. 1, right between∼170 and 200 km where IWC and ICNC are present in subsaturated air.
The simulated ice crystal number concentration and ice water content is used as an input for the radiative transfer code. In order to investigate the influence of the zenith angle on the results we performed simulations from 06:00 to 12:00 LT as well as from 5
12:00 to 18:00 LT. The zenith angle is representative for 50◦N and for 21 March. The radiation code is called every 10 min with the updated ice crystal number concentration and ice water content as well as the actual zenith angle. The output of the radiative transfer code is given by a time series of the cloud optical depth τ and the radiative fluxes at the top of the atmosphere for the infrared as well as solar spectrum over 6 h for 10
each simulation. Based on the radiative fluxes the long wave, short wave and net cloud forcing is calculated. As the cold (warm) temperature profiles have a surface temper-ature of 270 K (298 K), representing the conditions during the Northern Hemispheric mid-latitude winter (summer), additional simulations have been performed where the solar zenith angle is calculated for the 21 December (21 June) instead of 21 March in 15
the other simulations.
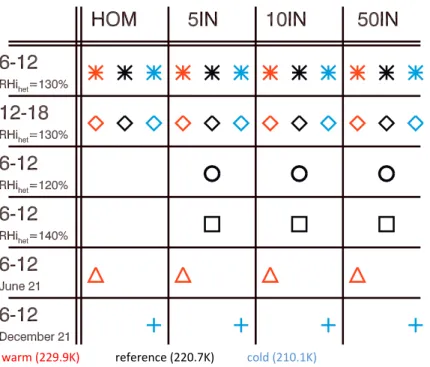
In total we therefore obtain 38 simulations. Four simulations for each of the tempera-ture profiles, namely with homogeneous freezing only and with 5, 10 and 50 IN L−1, calculated for two different time slices of the day (06:00 to 12:00 and 12:00 to 18:00 LT). Additionally, 6 simulations with the reference temperature profile with 5, 10 20
and 50 IN L−1are calculated under the assumption that the INs freeze at a critical su-persaturation of RHihet=120 % or 140 %, respectively. Furthermore, 8 simulations for
homogeneous freezing only and 5, 10 and 50 IN L−1for the cold and warm temperature profiles have been performed where the solar zenith angle is calculated for the 21 June (21 December). In Fig. 2 all 38 simulations are summarized. Each symbol represents 25
ACPD
13, 18069–18112, 2013Orographic cirrus
H. Joos et al.
Title Page
Abstract Introduction
Conclusions References
Tables Figures
◭ ◮
◭ ◮
Back Close
Full Screen / Esc
Printer-friendly Version Interactive Discussion
Discussion
P
a
per
|
D
iscussion
P
a
per
|
Discussion
P
a
per
|
Discuss
ion
P
a
per
|
In the following, a simulation where only homogenous freezing is considered as well as a simulation with 10 IN both for 06:00 to 12:00 LT, the reference temperature profile and RHihet=130 % are explained in detail before a summary of all simulations is given
in Sect. 4.2.
4 Results
5
In order to compare the different simulations, the vertically integrated IWC, the ice wa-ter path (IWP) as well as the vertically integrated ICNC, the ice crystal number burden (ICNB) are calculated for every timestep (10 min). Furthermore, the optical depthτas well as the long wave, short wave and net cloud forcing are calculated for all simula-tions. The optical depth as a mean over all bands is calculated according to Fu and 10
Liou (1993) and is given by
τ=IWP·
a+ b De
(1)
where IWP is the ice water path in g m−3,Deis the generalized size in µm which can be
calculated as described in the Appendix anda,bare coefficients that depend on the wavelength. For IR emissivities, a similar relationship holds. However, from coefficient 15
analysis one can conclude that for solar radiation the size is more important than for thermal radiation, which is strongly driven by ice mass.
The cloud forcing CF is defined as the difference between the clear sky net top-of-atmosphere (TOA) radiation and the net TOA radiation with clouds. The CF can be calculated for the short wave radiation such that SCF=Scs−Scloud whereScs is the
20
short wave clear sky TOA radiation and Scloud is the short wave TOA radiation with clouds. The same can be done for the long wave radiation where LCF=Lcs−Lcloud
(Klein and Hartmann, 1993). SCF is negative asScloudis larger than the corresponding
ACPD
13, 18069–18112, 2013Orographic cirrus
H. Joos et al.
Title Page
Abstract Introduction
Conclusions References
Tables Figures
◭ ◮
◭ ◮
Back Close
Full Screen / Esc
Printer-friendly Version Interactive Discussion
Discussion
P
a
per
|
D
iscussion
P
a
per
|
Discussion
P
a
per
|
Discuss
ion
P
a
per
|
This effect is strongest for high, cold clouds as they radiate back into space with a much lower temperature than the underlying warmer surface.
In order to compare the results for the 38 different simulations, the simulation with only homogeneous freezing and the reference temperature profile as well as the simu-lation with 10 IN and RHihet=130 % for the time period 06:00 to 12:00 LT are described
5
in more detail before a summary of all simulations is discussed in Sect. 4.2.
4.1 Detailed discussion of simulation HOM and 10IN
4.1.1 Simulation HOM
In order to compare the different simulations, the time evolutions of the microphysical properties IWP, ICNB and optical depthτand the long wave (LCF), short wave (SCF) 10
and net cloud forcing (NCF) are shown. Figure 3 shows the time evolution of the IWP, ICNB and τ for the reference simulation where only homogeneous freezing is active (HOM) for the reference temperature profile. After∼3 h the critical supersaturation for homogeneous freezing is reached and a cloud starts to form. The nucleation takes place close to the mountain crest where the updraft speeds are highest. The ice crys-15
tals then grow due to deposition of water vapor and are partly advected downstream and sediment to lower levels. With the time proceeding, more crystals form as the ex-isting ice crystals cannot deplete enough water vapor such that the supersaturation with respect to ice stays high enough and new crystals can form until an equilibrium between the production of supersaturation due to the vertical velocities and the deple-20
tion of water vapor by the existing ice crystals is reached and the ICNB stays more or less constant. Connected to the nucleation of ice crystals the IWP increases with time. The highest values can be seen close to the mountain crest where the crystals form and grow. As during the downstream advection the crystals start to sediment and sub-limate (see also Fig. 1, right panel) the IWP decreases with increasing distance from 25
the formation region. At x∼220 km a second small updraft region in the wave
ACPD
13, 18069–18112, 2013Orographic cirrus
H. Joos et al.
Title Page
Abstract Introduction
Conclusions References
Tables Figures
◭ ◮
◭ ◮
Back Close
Full Screen / Esc
Printer-friendly Version Interactive Discussion
Discussion
P
a
per
|
D
iscussion
P
a
per
|
Discussion
P
a
per
|
Discuss
ion
P
a
per
|
enough to reach the critical threshold for homogeneous nucleation and no new crystals form. The corresponding optical depth also shows highest values close to the mountain crest with decreasing values downstream. The high values of the optical depth close to the mountain crest are caused by the high ICNB as well as the high IWP in this region. The high number concentration of ice crystals in the formation region leads to small 5
Deand thus increases the optical depth (see Eq. 1). Additionally, the mean IWP, ICNB
and optical depth is shown in Fig. 3. The mean is calculated over all values where the optical depth exceeds 0.03, which distinguishes visible from subvisible cirrus clouds. The mean ICNB amounts to 2.65×10⁸m−2, the mean IWP to 4.22 g m−2and the mean optical depth to 0.57, respectively.
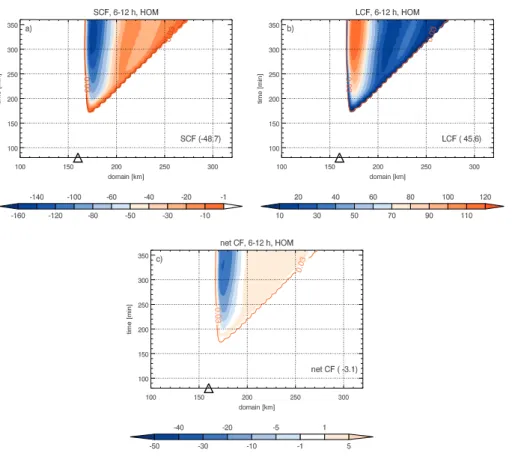
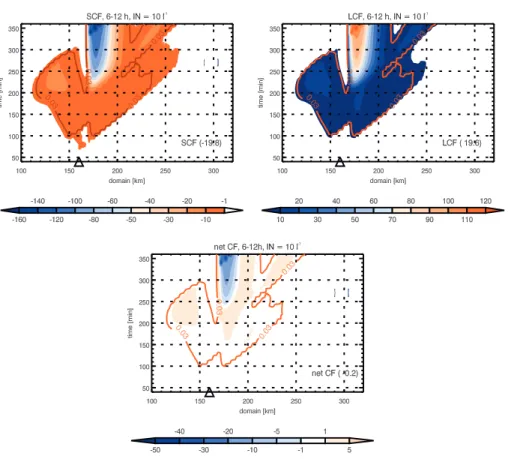
10
In Fig. 4 the SCF, LCF and NCF is shown for the time period from 06:00 to 12:00 LT. As long as no cloud is present, the cloud forcing equals zero as there is no difference to the clear sky radiation. When the cloud starts to form after∼3 h the short wave cloud forcing (SCF) becomes negative as due to the presence of the cloud more radiation is scattered back compared to the clear sky case. The amount of scattered radiation 15
depends on the optical depth of the cloud (see also Fig. 3c). The higher the optical depth, the more incoming radiation is scattered and the more negative is the SCF. The second small updraft region in the wave where the crystals start to grow again can be seen in the optical depth as well as the SCF. The SCF decreases to values below
−150 W m−2 close to the mountain crest where the optical depth is highest and
in-20
creases with decreasing optical depth. The mean SCF averaged over all values where
τ >0.03 amounts to−48.7 W m−2. The long wave cloud forcing (LCF) shows a similar pattern. The highest values of more than 110 W m−2are reached close to the mountain crest where the IWP has its maximum values and the pattern is again determined by the optical depth of the cloud. The mean LCF is given by 45.6 W m−2and is somewhat 25
ACPD
13, 18069–18112, 2013Orographic cirrus
H. Joos et al.
Title Page
Abstract Introduction
Conclusions References
Tables Figures
◭ ◮
◭ ◮
Back Close
Full Screen / Esc
Printer-friendly Version Interactive Discussion
Discussion
P
a
per
|
D
iscussion
P
a
per
|
Discussion
P
a
per
|
Discuss
ion
P
a
per
|
mountain crest the SCF strongly dominates the LCF leading to a cooling whereas in regions where the optical depth is lower (τ <∼0.7) the LCF slightly dominates and the cloud is in a warming regime.
In the following section it is shown how theses microphysical and optical properties change if 10 IN L−1that freeze at RHihet=130 % are added and heterogeneous
freez-5
ing is active as well.
4.1.2 Simulation 10IN
In the simulation presented here, 10 IN L−1that freeze at RHihet=130 % are added to the background aerosol concentration such that the influence of heterogeneous freez-ing on the microphysical and optical properties can be investigated.
10
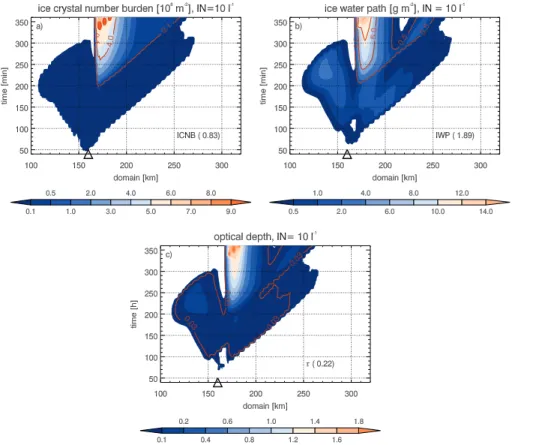
In Fig. 5 the ICNB, IWP and optical depth is shown as an evolution in time. As the heterogeneous freezing starts at lower RHi as the homogeneous freezing (namely at the prescribed 130 %) the formation of the cloud already starts after ∼60 min, thus
∼120 min earlier as in HOM. Additionally, the slight lifting of the streamlines at the
windward side of the mountain is enough to reach the supersaturation needed for the 15
heterogeneous freezing. The cloud is therefore not constrained anymore to the down-stream side of the mountain but extends∼40 km upstream.
The existence of 10 IN L−1is enough to deplete part of the supersaturation such that the onset of homogeneous freezing is delayed about 20 min compared to HOM. The red lines in Fig. 5a, b show the ICNB and IWP, respectively, formed by homogeneous 20
freezing. It can be seen that the onset of homogeneous freezing is slightly shifted in time and that the strength of the homogeneous nucleation event is reduced compared to HOM.
The heterogeneously frozen ice crystals form in an area with high supersaturation. As there are only few ice crystals they rapidly grow and start to sediment. Therefore 25
ACPD
13, 18069–18112, 2013Orographic cirrus
H. Joos et al.
Title Page
Abstract Introduction
Conclusions References
Tables Figures
◭ ◮
◭ ◮
Back Close
Full Screen / Esc
Printer-friendly Version Interactive Discussion
Discussion
P
a
per
|
D
iscussion
P
a
per
|
Discussion
P
a
per
|
Discuss
ion
P
a
per
|
threshold for homogeneous freezing is only reached in a shallow area close to the top of the ISSR and not throughout the whole depth like in HOM. This effect can be seen in Fig. 6 where the homogeneously frozen crystals, the heterogeneously frozen crystals and the points where RHi exceeds the critical supersaturation which is needed for ho-mogeneous freezing are displayed for both simulations (HOM, 10IN). A strong vertical 5
gradient in the heterogeneously frozen crystals builds up (black lines in Fig. 6, right) with ICNC of∼10 L−1at the bottom and∼1 L−1at the top of the cloud. Furthermore it can be seen, that the peak values of RHi that lie above the homogeneous nucleation threshold are smaller in 10IN than in HOM at least for the beginning of the homoge-neous freezing event (see asterisks in Fig. 6) and that the threshold is only exceeded 10
in a much smaller area close to the cloud top as compared to HOM. Due to these two effects the vertically integrated number of homogeneously frozen ice crystals is smaller in simulation 10IN than in HOM. Spichtinger and Gierens (2009c) have seen the effect of a reduced nucleation area and smaller peak values in their simulations of a cirrus cloud which forms under much lower vertical velocities in the order of some cm s−1. 15
However, the results shown here suggest that this effect is even present in a highly dynamically dominated regime with high updraft velocities and that few INs are already enough to change the clouds microphysical properties.
After ∼240 min the homogeneous nucleation takes place over the whole depth of the ISSR, with a delay of ∼60 min compared to HOM. At that time and for the rest 20
of the simulation the remaining heterogeneously frozen ice crystals cannot inhibit the onset of homogeneous freezing also because the high updraft speeds in the mountain wave exhibit a strong source for cooling and thus the formation of ice supersaturation. In summary, the presence of heterogeneous INs strongly modifies the microphysical properties of the cloud. The formation of homogeneously frozen ice crystals is sup-25
ACPD
13, 18069–18112, 2013Orographic cirrus
H. Joos et al.
Title Page
Abstract Introduction
Conclusions References
Tables Figures
◭ ◮
◭ ◮
Back Close
Full Screen / Esc
Printer-friendly Version Interactive Discussion
Discussion
P
a
per
|
D
iscussion
P
a
per
|
Discussion
P
a
per
|
Discuss
ion
P
a
per
|
the optical depth both in the same direction. Fewer but larger ice crystals lead to a de-creasedτas well as does a decreased IWP (see Eq. 1). The optical depth is therefore strongly reduced compared to HOM from 0.57 to 0.22 in the mean over the cloud.
In Fig. 7 the corresponding SCF, LCF and NCF is shown. The decreased optical depth leads to a reduced SCF as less radiation is scattered back to space compared 5
to HOM. The peak values of∼ −150 W m−2 are only reached in a much smaller area than in HOM. The part of the cloud where only heterogeneous freezing is active also influences the radiation as the optical depth is still high enough (above the threshold for subvisible cirrus, i.e.τ >0.03). Thus, a small negative SCF with values up to−10 W m−2 can be seen in these regions. The mean SCF is−19.8 W m−2which is much less than 10
the SCF in HOM (−48.7 W m−2). The LCF exhibits a similar pattern since IWP is also strongly reduced. The slight upward motion of the streamlines in front of the mountain leads to a non-zero LCF up to ∼40 km upstream of the mountain crest. Due to the rapid growth of the crystals which is attended by IWP values of up to 4 g m−2, the LCF reaches values of∼20 W m−2in front of the mountain. On the other side of the moun-15
tain, the LCF is reduced in its amount because of the strengthened sedimentation of the bigger ice crystals as compared to HOM. The mean LCF amounts to 19.6 W m−2 which only corresponds to less than half of the LCF in HOM (45.6 W m−2). The diff er-ence between SCF and LCF decreases leading to a less negative NCF compared to HOM. In the updraft region of the wave where the clouds form, the optical depth is 20
still high enough such that the SCF dominates and the cloud is in a cooling regime. However, the cooling region is smaller as compared to HOM and the peak values are less pronounced. In the other parts of the clouds, the NCF becomes positive leading to a warming. However, the absolute values of the warming are less distinct such that the averaged NCF is given by−0.2 W m−2, i.e. close to zero.
25
ACPD
13, 18069–18112, 2013Orographic cirrus
H. Joos et al.
Title Page
Abstract Introduction
Conclusions References
Tables Figures
◭ ◮
◭ ◮
Back Close
Full Screen / Esc
Printer-friendly Version Interactive Discussion
Discussion
P
a
per
|
D
iscussion
P
a
per
|
Discussion
P
a
per
|
Discuss
ion
P
a
per
|
or delay the onset of homogeneous freezing at least in parts of the cloud which in the following modifies the radiative properties of the cloud.
4.2 Summary of all simulations
In the previous section, two simulations have been explained in detail. In order to give an overview over all simulations, in the following only the mean values of the ice crystal 5
number burden, ice water path, optical depth, LCF, SCF and NCF averaged over all values where the optical depth exceeds 0.03 are shown for all 38 simulations.
4.2.1 Microphysical properties
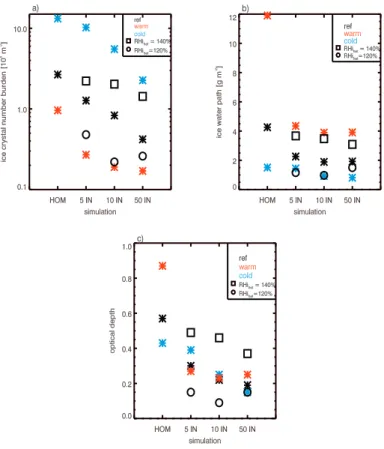
Figure 8 shows the summarized results for the microphysical properties ICNB, IWP and optical depth.
10
The ICNB exhibits a strong dependence on the temperature inside the ISSR (see blue, black and red symbols in Fig. 8 for each simulation). Cold temperatures lead to a decreased crystal growth rate such that the newly formed crystals can only de-plete part of the existing supersaturation and new crystals can form. For the warm temperatures the growth of ice crystals is efficient enough to deplete the supersatura-15
tion and much less new crystals form. Adding heterogeneous IN that freeze at a RHi value of 130 % leads to a reduction of the simulated ICNB. As explained in Sect. 4.1.2 the existence of INs that freeze at lower RHi than the homogeneous threshold leads to a suppression or delay of homogeneous freezing and therefore in total, less crys-tals form. The reduction depends on temperature. For cold temperatures, the relative 20
change is less pronounced than for warm temperatures. The existing IN start to freeze at RHi=130 %, however, due to the cold temperatures the heterogeneously frozen crystals cannot deplete enough supersaturation and new crystals can still form homo-geneously. At higher temperatures, the relative reduction is more pronounced as the heterogeneously formed crystals grow more rapidly and more water vapor is depleted, 25
ACPD
13, 18069–18112, 2013Orographic cirrus
H. Joos et al.
Title Page
Abstract Introduction
Conclusions References
Tables Figures
◭ ◮
◭ ◮
Back Close
Full Screen / Esc
Printer-friendly Version Interactive Discussion
Discussion
P
a
per
|
D
iscussion
P
a
per
|
Discussion
P
a
per
|
Discuss
ion
P
a
per
|
and reference case, the largest reduction occurs between the HOM and 5IN simula-tions whereas for the cold case the difference between 5IN and 10IN is larger. The black circles/squares show the results for simulations with the reference temperature profile but RHihetis set to 140 % (squares) and 120 % (circles) in order to test the sen-sitivity of the results on the efficiency of the heterogeneous INs. If RHihetis increased to
5
140 % the reduction of ICNB is less pronounced as the heterogeneous freezing starts later. Thus, heterogeneously formed ice crystals can grow on a shorter time until ho-mogeneous nucleation kicks in. This leads to less efficient water vapour depletion and the proceeding homogeneous nucleation is suppressed only weakly. Suppression is more pronounced for the 120 % case as there heterogeneous freezing starts imme-10
diately which leads to a strong suppression of homogeneous freezing due to efficient depletion of water vapour.
The simulated IWP depends strongly on the assumed temperature profile. As we initialized the model with an ice supersaturated region of RHi=120 %, the shift of the temperature profile leads to a varying specific humidity inside the ISSR with highest 15
values for the warm case. Therefore, the simulated IWP strongly depends on the as-sumed temperature profile with highest values for the warm case where most water vapor is available (see Fig. 8b). The IWP decreases strongly with decreasing temper-atures. The addition of heterogenous IN also leads to a strong reduction in the IWP as less crystals form. The available water vapor is depleted on the reduced number of 20
ice crystals which then become big enough to sediment. The sedimenting ice crystals start to sublimate which exhibits a sink for the IWP. The change in IWP is strongest between the HOM and 5IN simulation whereas less change is seen from 5IN to 50IN. The change of RHihetto 140 % (120 %) leads to a less (more) pronounced difference
between HOM and 5IN as due to the increase (decrease) in ICNB more (less) water 25
vapor is depleted.
ACPD
13, 18069–18112, 2013Orographic cirrus
H. Joos et al.
Title Page
Abstract Introduction
Conclusions References
Tables Figures
◭ ◮
◭ ◮
Back Close
Full Screen / Esc
Printer-friendly Version Interactive Discussion
Discussion
P
a
per
|
D
iscussion
P
a
per
|
Discussion
P
a
per
|
Discuss
ion
P
a
per
|
for the warm case and the lowest optical depth for the cold case. As the addition of heterogeneous IN leads to a strong decrease in IWP and a decrease in ICNB, the resulting optical depth is characterized by decreasing values with increasing IN con-centration. Again, the difference is largest from HOM to 5IN and the further decrease in optical depth with increasing INs is much less distinct. Again, the shift of RHihet to
5
140 % (120 %) leads to a less (more) pronounced decrease according to the behavior of the IWP and ICNB (see black circles and squares in Fig. 8a, b).
4.2.2 Cloud forcing
In Fig. 9 the SCF, LCF and NCF for all simulations are summarized. The different symbols show the results for the simulations from 06:00 to 12:00 LT (asterisks) and 10
from 12:00 to 18:00 LT (diamonds). In addition, the results for the reference temperature profile and RHihet=140 % (120 %) are shown with black squares (circles) for the time
period 06:00 to 12:00 LT only.
Figure 9a shows the SCF. In all simulations, the most negative values appear for the simulations with the highest optical depth. Thus, for HOM, the warm case reveals the 15
most negative SCF. With decreasing optical depth, SCF decreases in all simulations as does the spread between the reference, cold and warm simulations. The most pro-nounced difference in SCF occurs between HOM and 5IN for the warm and reference cases whereas the change in SCF from 5IN to 50IN is much smaller. For the cold case the largest difference occurs from 5IN to 10IN. Additionally it can be seen that the sim-20
ulations from 06:00 to 12:00 LT show more negative values than the simulations from 12:00 to 18:00 LT. This is caused by the increasing zenith angle with the time proceed-ing. The simulations start at 12:00 LT, thus the clouds start to form between∼13:00 and 15:00 LT depending on the IN concentration. At that time the zenith angle is still small enough to produce considerable scattering of radiation back to space whereas 25
ACPD
13, 18069–18112, 2013Orographic cirrus
H. Joos et al.
Title Page
Abstract Introduction
Conclusions References
Tables Figures
◭ ◮
◭ ◮
Back Close
Full Screen / Esc
Printer-friendly Version Interactive Discussion
Discussion
P
a
per
|
D
iscussion
P
a
per
|
Discussion
P
a
per
|
Discuss
ion
P
a
per
|
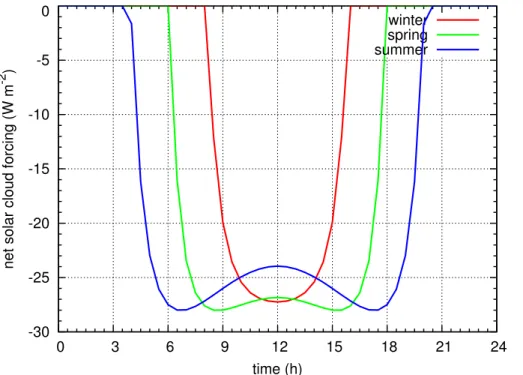
where the clouds are formed at∼07:00 to 9:00 LT depending on the IN concentration. For better illustration, the diurnal cycle of the SCF for a single-column simulation with a cirrus cloud with a mean ice water content of xx mg m−3in a height between 8 and 9 km and an idealized temperature profile is shown in Fig. 10. During night, the SCF equals zero and starts to become negative after sunrise with decreasing solar zenith 5
angle. The simulations are done for different days of the year, namely 21 March, 21 June and 21 December. It can be seen that for spring and summer, the minimum in SCF is not reached at noon at the smallest zenith angle but that it is smaller in the morning and afternoon. This effect has also been found by Meerkötter et al. (1999) (see their Fig. 4a). The exact values of the SCF depend of course on the temperature 10
and humidity profiles and the assumed IWC. However, with Fig. 10 we only want to highlight the general behavior of the SCF during a diurnal cycle.
The simulations with RHihet=140 %/120 % reveal the same behavior as the optical
depth, thus, more negative SCF for RHihet=140 % where the optical depth is higher than for the reference case and less negative SCF for RHihet=120 % where the
op-15
tical depth is strongly decreased by the very efficient heterogeneous INs, supressing homogeneous nucleation.
The LCF shown in Fig. 9b is of course independent from the simulated time of day. Like the SCF it strongly depends on the optical depth. The strongest LCF can be seen for the simulation HOM and the warm case whereas it decreases with increasing IN 20
and decreasing temperature in the ISSR. This would also mean that during night, where there is no contribution from the short wave spectrum, the clouds become less warming with increasing IN concentration.
In Fig. 9c the resulting NCF is shown. Here, a clear distinction between the NCF for the different simulated times of day can be seen. The simulation from 06:00 to 12:00 LT 25
ACPD
13, 18069–18112, 2013Orographic cirrus
H. Joos et al.
Title Page
Abstract Introduction
Conclusions References
Tables Figures
◭ ◮
◭ ◮
Back Close
Full Screen / Esc
Printer-friendly Version Interactive Discussion
Discussion
P
a
per
|
D
iscussion
P
a
per
|
Discussion
P
a
per
|
Discuss
ion
P
a
per
|
reduced with increasing temperatures and increasing IN concentration. For the warm case, a transition from the cooling to the warming regime takes place already from HOM to 5IN whereas the cold case is always cooling and the reference case gets slightly positive (warming) only for the 50IN simulation. The simulations with RHihet=140 %,
120 % show a similar behavior as the reference simulation whereas the difference to 5
the HOM simulation is decreased (increased) for RHihet=140 % (120 %) where the
heterogeneous freezing is less (more) efficient.
The simulations from 12:00 to 18:00 LT lead to a positive NCF. This is caused by the reduced SCF due to the increased zenith angle at the end of the evolution of the cloud where the optical depth is highest. As the LCF is the same for all times of day the 10
reduction of SCF leads to a positive NCF. With decreasing temperature and increasing IN concentration, the NCF is strongly reduced, whereas the largest change for the reference and warm temperature profile occurs from HOM to 5IN whereas for the cold case only smaller changes occur.
In general we might conclude that the same cloud can lead to a warming or cool-15
ing depending on the times of day when it starts to form. For example, in HOM, the same microphysical properties lead to a NCF of−4.2 W m−2for the cold case between 06:00 and 12:00 LT whereas it leads to a positive NCF of 11.7 W m−2 for the 12:00 to 18:00 LT simulation. Additionally, the cloud can shift from a cooling into a warming regime depending on the number of heterogeneous INs. Based on our simulations it 20
seems, that the presence of already a few INs in the order of 5 L−1is enough to strongly modify the clouds microphysical and radiative properties. A further increase in the IN concentration from 5 to 50 L−1reveals a much smaller change.
The warm (cold) temperature profiles correspond to a surface temperature of 298 K (270 K) representative for the Northern Hemispheric mid-latitude summer (winter). We 25
therefore performed additional simulations where the solar zenith angle is representa-tive for 21 June (21 December) according to the surface temperatures. The simulations are performed for 06:00–12:00 LT and with RHihet=130 %. The results can be seen in
ACPD
13, 18069–18112, 2013Orographic cirrus
H. Joos et al.
Title Page
Abstract Introduction
Conclusions References
Tables Figures
◭ ◮
◭ ◮
Back Close
Full Screen / Esc
Printer-friendly Version Interactive Discussion
Discussion
P
a
per
|
D
iscussion
P
a
per
|
Discussion
P
a
per
|
Discuss
ion
P
a
per
|
RHihet=130 % and a solar zenith angle for 21 March are included as well. In gen-eral, the same behavior as for the simulations with the zenith angle representative for 21 March can be seen, with a decreasing SCF with increasing IN concentration. The simulations with the warm profile for 21 June (red triangles) show a reduced SCF as compared to the simulation with the same temperature profile but a zenith angle cal-5
culated for 21 March (red asterisks). This effect is caused by the fact that the SCF reaches the most negative values not at noon but in the morning hours. The cloud develops between 06:00 and 12:00 LT and reaches the highest optical depth at the end of the simulation time around noon. As due to the geometry of the ice crystals (columns) the SCF is less increased around noon for the March simulation than for the 10
June simulation, the mean SCF over the 6 h simulation is slightly less negative for June than for March (see also Fig. 10, blue and green lines). The resulting NCF is therefore more positive for the June simulation than for March. The cold simulation for the 21 December shows the slightly smaller SCF values because of the lower solar altitude in December compared to March, whereas the overall behavior stays the same. This 15
reduced SCF leads to a smaller NCF for the December simulation and the clouds are less cooling than for the March simulation.
5 Summary and discussion
Idealized simulations with the cloud resolving model EULAG (Prusa et al., 2008) and a radiative transfer code (Fu and Liou, 1993) have been performed in order to investi-20
gate the influence of heterogeneous freezing on the microphysical and radiative prop-erties of orographic cirrus clouds.
We performed 2-D simulations of orographic cirrus clouds in a vertically propagat-ing wave with homogeneous freezpropagat-ing only and simulations with heterogeneous and homogeneous freezing whereas the number of heterogeneous INs has been set to 5, 25
ACPD
13, 18069–18112, 2013Orographic cirrus
H. Joos et al.
Title Page
Abstract Introduction
Conclusions References
Tables Figures
◭ ◮
◭ ◮
Back Close
Full Screen / Esc
Printer-friendly Version Interactive Discussion
Discussion
P
a
per
|
D
iscussion
P
a
per
|
Discussion
P
a
per
|
Discuss
ion
P
a
per
|
depth as well as the top-of-atmosphere radiative fluxes for the thermal and solar spec-trum are calculated. The simulations were run for 6 h. During that time a stable flow regime establishes and an orographic cirrus cloud starts to form. The output frequency for the microphysical properties calculated with the EULAG model is 10 min, thus the input fields needed by the radiation code are also available every 10 min. We therefore 5
obtained a time series of microphysical and radiative properties with a time resolu-tion of 10 min over 6 h. Addiresolu-tionally, we performed simularesolu-tions where the temperature inside the ISSR has been increased/decreased 10 K in order to investigate the depen-dence of the results on the temperature in the cirrus layer. Furthermore the radiation calculation has been done for two different time periods (06:00 to 12:00 and 12:00 to 10
18:00 LT) whereas the solar zenith angle which is representative for 50◦N and the 21 March, is updated every 10 min, together with the microphysical input, in order to test the dependence of the results on the time of day. Moreover, the critical relative humid-ity RHihetat which the heterogeneous freezing starts is shifted to 120 % and 140 % for the simulation from 06:00 to 12:00 LT and the reference temperature profile. Additional 15
simulations for HOM, 5IN, 10IN and 50IN have been performed where for the warm (cold) temperature profile a zenith angle representative for 21 June (21 December) is used as the surface temperature corresponds to summer (winter) conditions for the warm (cold) profiles. In total we therefore obtain 38 simulations (see Fig. 2).
Two simulations, one with homogeneous freezing only and one with homogeneous 20
and heterogeneous freezing with an IN concentration of 10 L−1 that freeze at RHihet=
130 % for the reference temperature profile are explained in more detail. It can be seen that the microphysical properties strongly change when 10 IN are added and neous freezing is allowed to occur. Due to the lower freezing threshold of the heteroge-neous INs compared to the threshold for homogeheteroge-neous freezing, a cloud starts to form 25
ACPD
13, 18069–18112, 2013Orographic cirrus
H. Joos et al.
Title Page
Abstract Introduction
Conclusions References
Tables Figures
◭ ◮
◭ ◮
Back Close
Full Screen / Esc
Printer-friendly Version Interactive Discussion
Discussion
P
a
per
|
D
iscussion
P
a
per
|
Discussion
P
a
per
|
Discuss
ion
P
a
per
|
part of the supersaturation. With increasing size the crystals start to sediment such that a vertical gradient in the ice crystal number concentration inside the cirrus cloud develops. This leads to a further depletion of water vapor mainly at the cloud bottom where more crystals are present. Therefore, the critical threshold for homogeneous freezing is only reached in the upper part of the cloud (see Fig. 6). Furthermore, the 5
maxima in the supersaturation that are reached are lower in the case where heteroge-neous freezing is active, which leads to the formation of less homogeheteroge-neously frozen crystals. Summarized it can be seen that the existence of 10 IN strongly modifies the homogeneous freezing and that much less ice crystal are formed. The changed ICNB comes along with a reduced IWP as the fewer but bigger crystals start to sediment 10
and sublimate which exhibits a sink for the IWP. The resulting optical depth is strongly reduced compared to the HOM simulation which has a strong impact on the radiative properties.
The simulated short wave cloud forcing (SCF), long wave cloud forcing (LCF) and net cloud forcing (NCF) is strongly changed by the heterogeneous freezing. Due to the 15
decreased optical depth, the SCF as well as the LCF is reduced compared to HOM. The SCF increases from−48.7 W m−2in HOM to−19.8 W m−2in 10IN and the LCF de-creases from 45.6 W m−2in HOM to 19.6 W m−2in 10IN for the simulation from 06:00 to 12:00 LT. The resulting NCF is getting less negative and is increased from−3.1 W m−2 in HOM to−0.2 W m−2in 10IN. Thus, the addition of heterogeneous INs leads to a mod-20
ification of the microphysical and radiative properties of the cloud, although the cloud forms in a dynamically dominated regime where high updraft speeds provide a strong source for adiabatic cooling and supersaturation. However it has been shown that the existence of a few IN L−1can nevertheless depleted enough water vapor to disturb the homogeneous freezing. The changes in microphysical properties then propagate also 25
to the radiative properties of the cloud leading to less cooling for the case presented here.
ACPD
13, 18069–18112, 2013Orographic cirrus
H. Joos et al.
Title Page
Abstract Introduction
Conclusions References
Tables Figures
◭ ◮
◭ ◮
Back Close
Full Screen / Esc
Printer-friendly Version Interactive Discussion
Discussion
P
a
per
|
D
iscussion
P
a
per
|
Discussion
P
a
per
|
Discuss
ion
P
a
per
|
optical depth of the cloud exceeds 0.03 which distinguishes subvisible from visible clouds.
First of all it can be seen that the results strongly depend on the temperature inside the ISSR. The colder the temperatures the more crystals form due to a reduced depo-sitional growth rate. However, as a constant RHi has been assumed for all temperature 5
profiles the absolute humidity is smallest for the coldest temperatures which leads to the smallest IWP for the coldest simulations. The optical depth which depends on the ICNB as well as on the IWP decreases strongly with increasing IN concentration. For the reference and warm profile, the change is most pronounced from the HOM to 5IN simulations whereas for the cold profile the change is strongest from 5IN to 10IN be-10
cause of the slow growth of the crystals at cold temperatures.
The SCF is dependent on the optical depth as well as on the zenith angle. The SCF is most negative for the simulations with the highest optical depth. Thus, the SCF gets less negative with increasing IN concentration whereas again the strongest change occurs from HOM to 5IN for the warm and reference and from 5IN to 10IN for the cold 15
temperature profile. For the simulation from 06:00 to 12:00 LT the SCF is more negative than the simulation from 12:00–18:00 LT. This is caused by less negative SCF at the end of the simulation (around ∼17:00 LT) where the cloud is optically thick but the zenith angle is already large such that the SCF is reduced. However, the same strong decrease in SCF can be seen for these simulations although the absolute values are 20
smaller.
The LCF is independent of the simulated time of day. However, like the SCF it strongly depends on the temperature profile. The largest LCF can be seen for the warm case of the HOM simulation where also the optical depth is highest. Again, with increasing INs the LCF strongly decreases as does the optical depth. Like for the other 25
variables the decrease is most pronounced from HOM to 5IN for the warm and refer-ence temperature and from 5IN to 10IN for the cold profile.
ACPD
13, 18069–18112, 2013Orographic cirrus
H. Joos et al.
Title Page
Abstract Introduction
Conclusions References
Tables Figures
◭ ◮
◭ ◮
Back Close
Full Screen / Esc
Printer-friendly Version Interactive Discussion
Discussion
P
a
per
|
D
iscussion
P
a
per
|
Discussion
P
a
per
|
Discuss
ion
P
a
per
|
absolute values of the NCF decrease with increasing IN concentration whereas the change is again most pronounced from HOM to 5IN for the warm and reference profile and from 5IN to 10IN for the cold profile. For the simulation from 06:00 to 12:00 LT the NCF shifts from a cooling into a warming regime already for 5IN for the warm case whereas the cold case is always in a cooling regime. The simulations from 12:00 to 5
18:00 LT are always in the warming regime with strongly decreasing absolute values with increasing IN concentration.
If the calculation of the solar zenith angle is done for 21 June for the warm profile and for 21 December for the cold profile, the overall dependence of SCF and NCF on the IN concentration does not change. However, a reduced SCF in summer and winter 10
as compared to spring leads to a more positive NCF.
These results emphasize the complexity of processes that have to be taken into ac-count when the radiative effect of orographic cirrus (or cirrus in general) is calculated. Joos et al. (2009) demonstrated the dependence of the microphysical properties on the underlying dynamics as well as thermodynamic conditions under which the cloud 15
forms.Together with the results presented here we want to illustrate that in order to predict whether a cloud is warming or cooling it is necessary to predict the correct dynamical forcing of the cloud, the correct thermodynamical conditions, the availabil-ity and efficiency of heterogeneous INs as well as the time of day. A change in the anthropogenically produced IN concentration in future might have an influence on the 20
radiative properties of cirrus clouds if more INs were transported to the upper tropo-sphere. Taking into account wrong conditions for the cloud formation, the cloud forcing can change from a warming to a cooling regime or strongly change the absolute value. The intention of this study is to highlight the influence of heterogeneous freezing, temperature and time of day on the microphysical and radiative properties in a highly 25
ACPD
13, 18069–18112, 2013Orographic cirrus
H. Joos et al.
Title Page
Abstract Introduction
Conclusions References
Tables Figures
◭ ◮
◭ ◮
Back Close
Full Screen / Esc
Printer-friendly Version Interactive Discussion
Discussion
P
a
per
|
D
iscussion
P
a
per
|
Discussion
P
a
per
|
Discuss
ion
P
a
per
|
used as a motivation to further investigate the manifold multiscale interactions between dynamics, thermodynamics and cirrus clouds for predicting e.g. their impact on the earth radiation budget.
Appendix
5
We assume the following general case of an ice crystal size distribution:
f(L) :=f1(L)+f2(L)+. . .+fn(L)= n X
i=1
fi(L) (A1)
Here, the distribution type offi(L) is not specified. However, we have to assume that
for all distributionsfi(L),i =1,. . .,nthe generalized moments
µk,i[L] :=
∞
Z
0
Lkfi(L) dL (A2)
10
fork≤1 exist. Similarly, we define the generalized truncated moments
µk,i[L,L1,L2] :=
L2 Z
L1
Lkfi(L) dL (A3)
Since the integral is a linear operator, the generalized moments and the generalized truncated moments for the whole distributionf(L) can be described as
µk[L]=
∞
Z
0
Lkf(L) dL= ∞
Z
0
n X
i=1
Lkfi(L) dL= n X
i=1
µk,i[L] (A4)
ACPD
13, 18069–18112, 2013Orographic cirrus
H. Joos et al.
Title Page Abstract Introduction Conclusions References Tables Figures ◭ ◮ ◭ ◮ Back Close
Full Screen / Esc
Printer-friendly Version Interactive Discussion Discussion P a per | D iscussion P a per | Discussion P a per | Discuss ion P a per |
µk[L,L1,L2]=
L2 Z
L1
Lkf(L) dL=
L2 Z
L1 n X
i=1
Lkfi(L) dL=
n X
i=1
µk,i[L,L1,L2] (A5)
For ice crystals of columnar shape (e.g. as described in Spichtinger and Gierens, 2009) we can find a power law relationship between mass m and maximum length L via
m=α(m)·Lβ(m) with piecewise constant coefficients as follows: 5
α(m)= (
α1 form≤mcrit α2 form > mcrit
β(m)= (
β1 form≤mcrit β2 form > mcrit
(A6)
The diameterDof the columnar shaped ice crystals can be described using the aspect ratiora:=L/D, which can be described as:
ra:=
1 form≤mcrit
s√
27·ρb
8·α
3 β2 2
·m
3−β2
2β2 form > m
crit (A7)
Here,ρb=0.81×10 3
kg m−3denotes the bulk ice mass density. The generalized eff ec-10
tive sizeDe(e.g. Fu and Liou, 1993) can be defined as follows:
De:=
R∞
0 D 2
Lf(L)dL
R∞
0 DLf(L)dL =
R∞
0 D 2
Lf(L)dL
R∞
0 DLf(L)dL
(A8)
Thus, for the calculation of the effective size we have to find expressions for the quantitiesD2L and DL, respectively, for the different ranges in the mass regime (i.e.
m≤mcrit,m > mcrit).
15
– m≤mcrit, i.e. α=α1,β=β1=3,ra≡1 (Droxtals): for this regime we obtain the
following expressions:
D=rL a
=L= 1 αβ1
ACPD
13, 18069–18112, 2013Orographic cirrus
H. Joos et al.
Title Page Abstract Introduction Conclusions References Tables Figures ◭ ◮ ◭ ◮ Back Close
Full Screen / Esc
Printer-friendly Version Interactive Discussion Discussion P a per | D iscussion P a per | Discussion P a per | Discuss ion P a per |
D2=DL=L2= 1 α2β
mβ2 (A10)
D2L=L3= 1 αβ3
m3β β==3 1
αm (A11)
– m > mcrit, i.e. α=α2,β=β2,ra>1 (columns): for this regime we obtain the
fol-lowing expressions: 5
D= L ra
=
v u u
t 8α
3 β √
27ρb
mβ2β−3 1 αβ1
mβ1 = 1 αβ1
v u u
t 8α
3 β √
27ρb
mβ2β−1 (A12)
DL= 1 αβ1
v u u
t 8α
3 β √
27ρb
mβ2β−1 1 α1β
mβ1 = 1 αβ2
v u u
t 8α
3 β √
27ρb
mβ2β+1 (A13)
D2L= 8α 1 β √
27ρb
mββ−1 1 αβ1
mβ1 = 8 √
27ρb
m (A14)
We can then carry out the integration in the mass space, using the transformation law 10
for probability densities (f(L)dL=f(m)dm); this leads to the following integrals:
∞
Z
0
D2Lfi(L)dL=
∞
Z
0
D2(m)L(m)fi(m)dm (A15)
=
mcrit Z
0
D2(m)L(m)fi(m)dm+
∞
Z
mcrit
D2(m)L(m)fi(m)dm (A16)
= mcrit Z 0 1 α1
mfi(m)dm+ ∞
Z
mcrit
8
√
27ρb